
I will help you conduct exploratory data analysis using R and write report
- 0
- (0)
Project Details
Why Hire Me?
📱Click to Connect on Whatsapp to Discuss Your Project
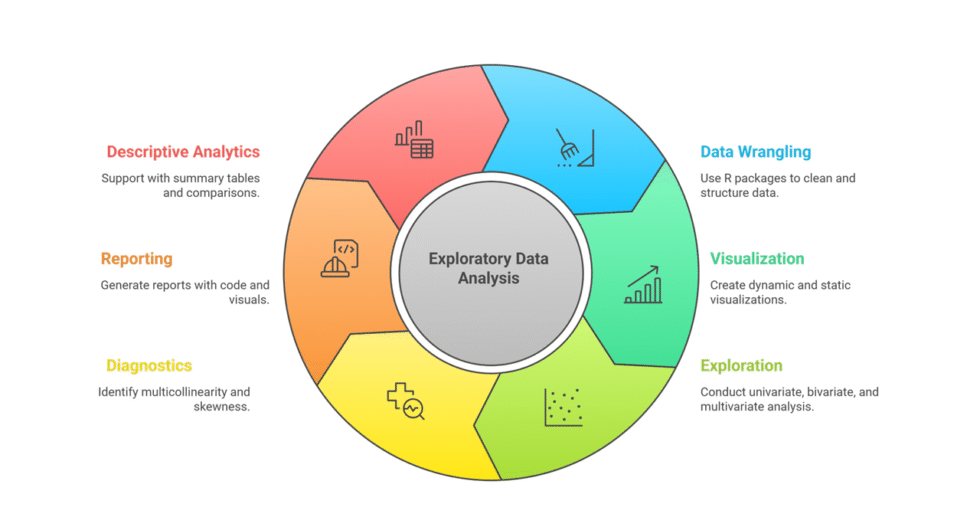
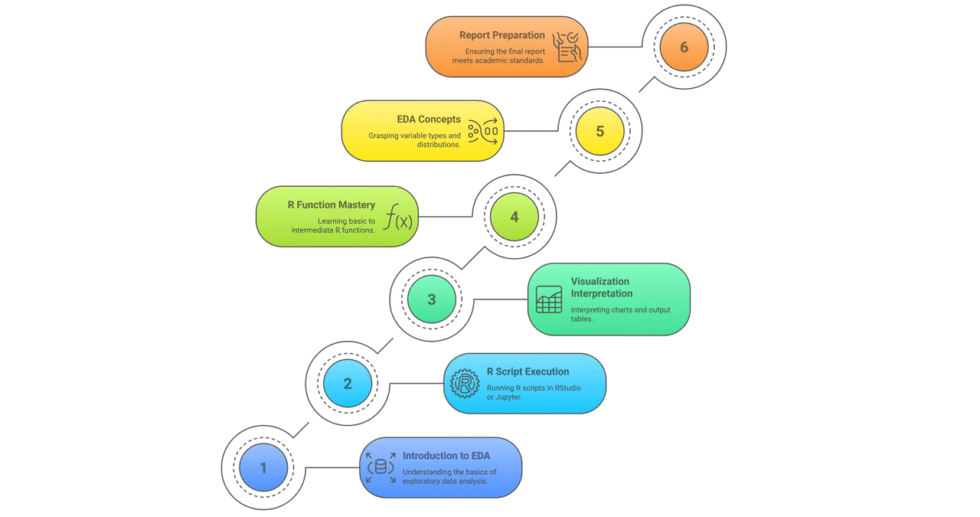
My expertise in R, combined with a thorough approach to data exploration, allows me to guide you in effectively uncovering and understanding the intricacies within your data. I focus on teaching you to not only conduct EDA but also to communicate findings compellingly in reports.
Key Strengths:
-
Skilled in
ggplot2,dplyr, andtidyrfor clean, visual analysis -
Experienced with structured reporting for academic and business contexts
-
Able to handle datasets of all sizes and complexities
-
Adaptable approach for all skill levels, including complete beginners
-
Proven ability to extract hidden insights and trends that inform decisions
What I Need to Start Your Work
To deliver high-quality EDA tailored to your needs, I will require:
-
Project Details
-
Your project’s objective and the role of EDA in meeting that goal
-
Specific questions or hypotheses you wish to explore
-
-
Data and Description
-
The dataset in CSV, Excel, or R-compatible formats
-
Description of variable types, data source, and any prior cleaning done
-
-
Exact Requirements
-
Particular features to explore: outliers, trends, distributions, etc.
-
Visualization or summary techniques you want included
-
-
Reporting Preferences
-
Level of technical detail and preferred format (Word, PDF, Markdown)
-
Any style guidelines, especially for academic or business reports
-
-
Communication Preferences
-
How you want to be contacted and how often
-
Any specific deadlines or milestones for report delivery
-
Portfolio

Retail Demand Pattern Discovery Using Exploratory Data Analysis in R for a U.S. Grocery Chain
Used R to uncover seasonal demand patterns, outlier products, and category-level trends for a U.S. grocery chain. Informed stocking and discount strategies across regional stores.
Exploratory Data Analysis in R for Public Transport Ridership Trends in a U.S. Metro System
Applied EDA techniques in R to analyze ridership patterns by route, time of day, and demographics. Helped city transit planners realign service schedules based on peak load behaviors.
Student Performance Trends in R: Exploratory Analysis for a U.S. Community College
Conducted univariate and bivariate EDA in R to explore relationships between attendance, online access, workload, and GPA. Enabled targeted academic support for at-risk student groups.
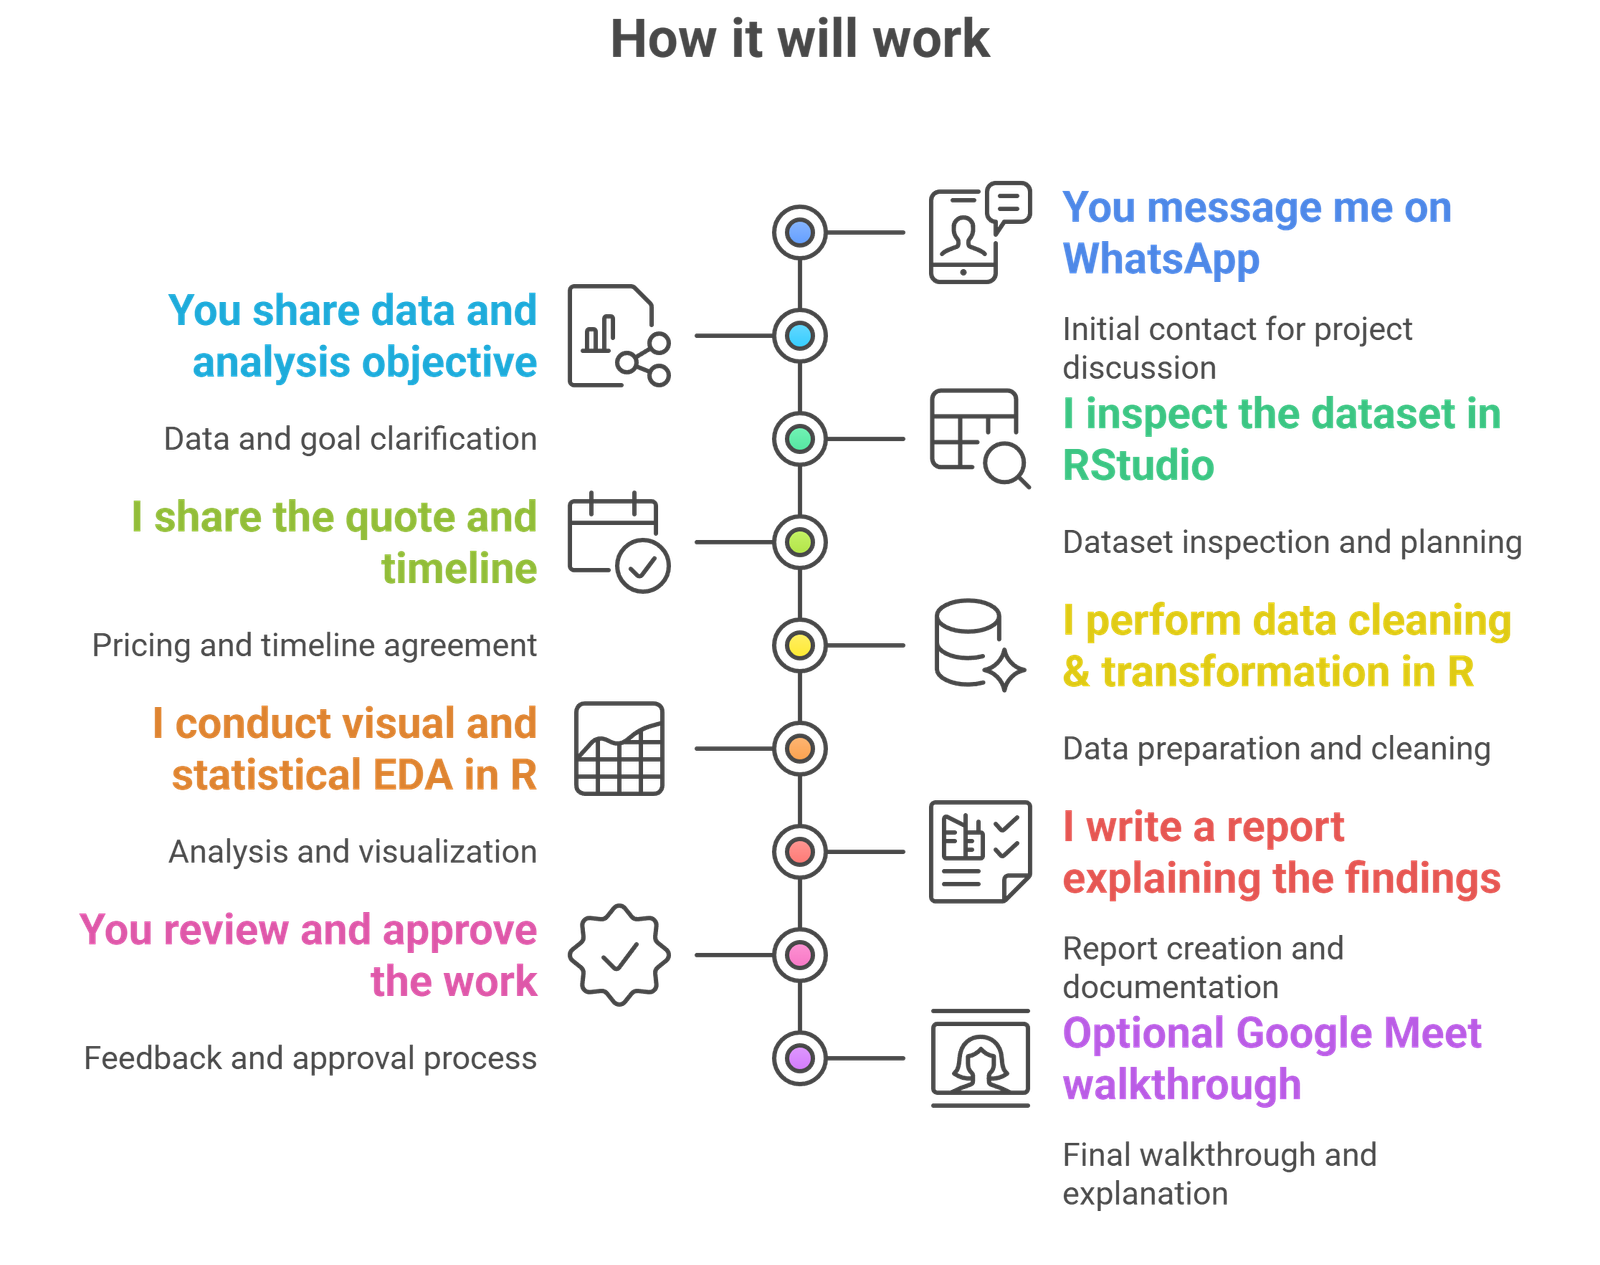
Process
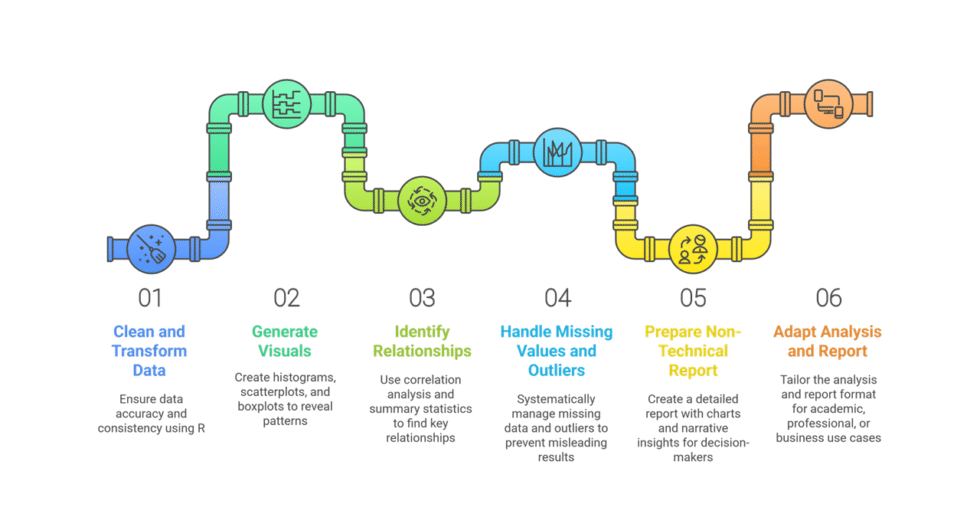
EDA Quick Scan
Starts at $25
Clean and basic summary
-
 3
Days Delivery
3
Days Delivery
-
 1
Revision
1
Revision
EDA Trend Check
Starts at $65
Intermediate plots and insights
-
5
Days Delivery
-
2
Revisions
EDA Deep Dive
Starts at $120
Full report with visual summary
-
7
Days Delivery
-
3
Revisions


