
I can help you develop your sales dashboard using Google Data Studio/ Looker Studio
- 0
- (0)
Project Details
Why Hire Me?
📱Click to Connect on Whatsapp to Discuss Your Project
I have 7+ years of experience in building interactive dashboards tailored for sales monitoring, combining data visualization expertise with a deep understanding of business KPIs. My dashboards not only display metrics but provide decision-ready insights.
Why Clients Choose Me:
-
Expert in Google Data Studio and Looker Studio with real-time dashboard solutions
-
Skilled at connecting diverse data sources (e.g., Excel, BigQuery, Google Sheets, CRMs)
-
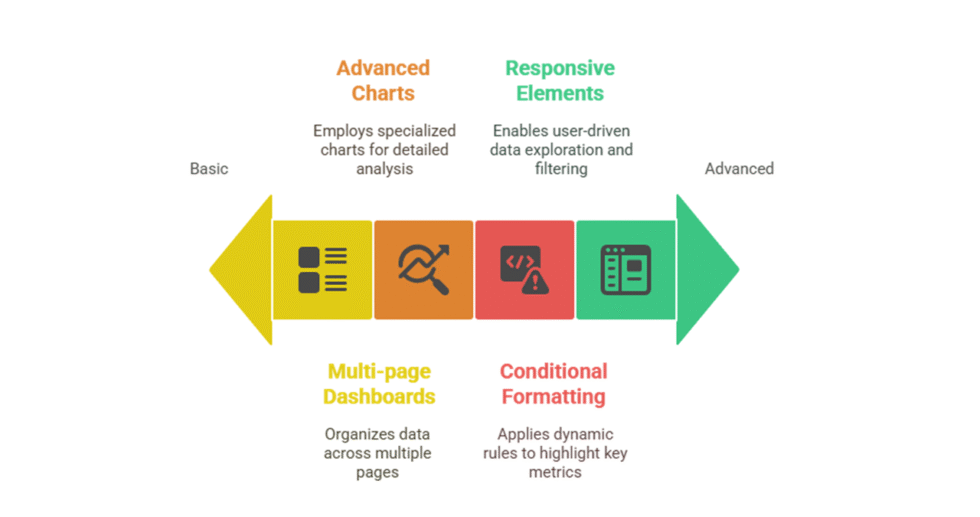
Designs include drill-down filters, comparative views, and intuitive layouts
-
Experience in retail, SaaS, B2B, and e-commerce sales data
-
Supports KPI alignment, performance tracking, and team training
-
Delivery includes maintenance-ready templates and clear documentation
What I Need to Start Your Work
Please provide the following to ensure an efficient dashboard setup:
1) Project Overview and Dashboard Objectives
-
Purpose of the dashboard (e.g., sales team tracking, regional sales comparison, product category insights)
-
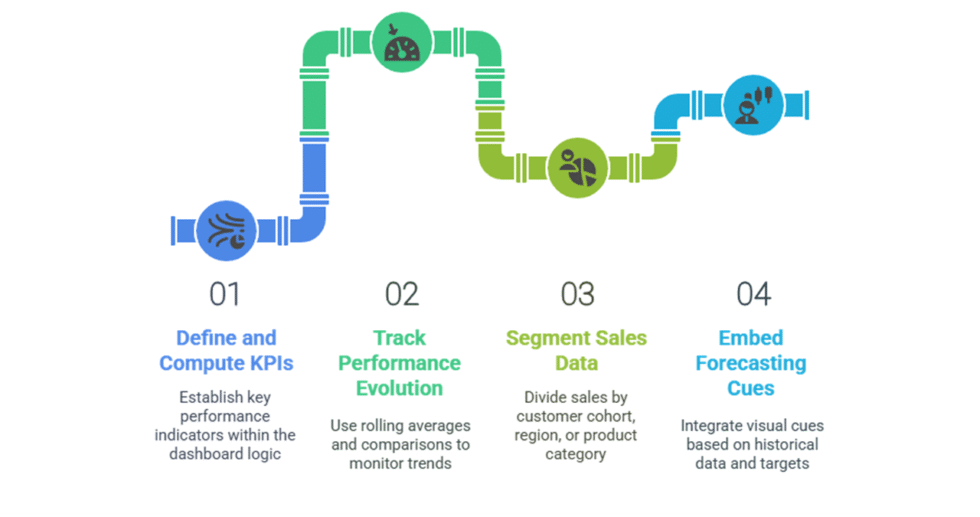
Key KPIs to be tracked (e.g., revenue, conversion rate, average order value)
2) Data Source and Integration Requirements
-
Type and source of sales data (e.g., Google Sheets, CRM, POS, SQL databases)
-
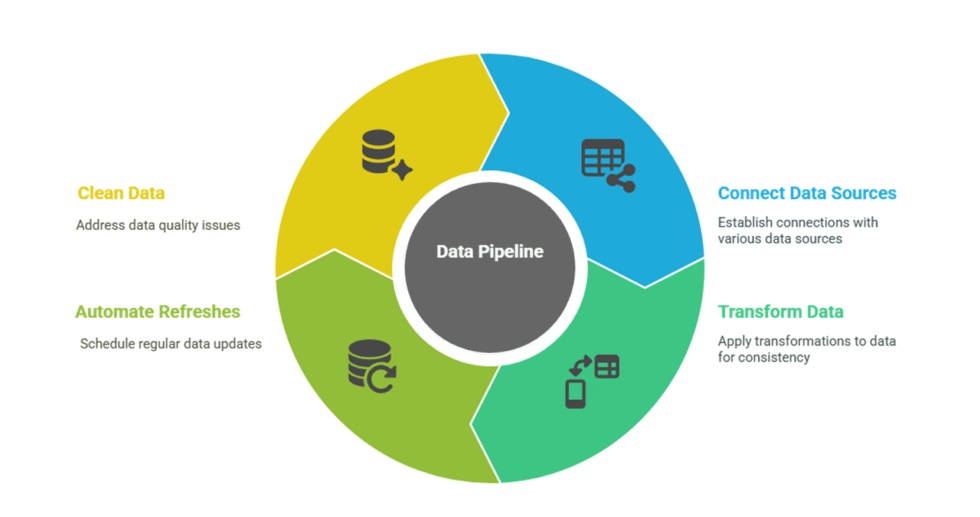
Frequency of data refresh (real-time, daily sync, manual upload)
-
Details on login credentials, API keys, or access permissions
3) Dashboard Design and Features
-
Preferred layout or sample references (if any)
-
Visual elements needed: bar charts, line graphs, pie charts, tables, heat maps
-
Filters or segments: by region, product, time, team, etc.
4) Reporting and Insights Focus
-
Specific sales patterns to highlight: trends, dips, peaks, YoY comparisons
-
Desired granularity: daily, weekly, monthly, quarterly views
-
Any alert thresholds or performance benchmarks to include
5) Access and Sharing Preferences
-
Who needs access (email IDs, roles)
-
Permission levels: viewer, editor, admin
-
Export requirements: PDF, CSV, scheduled email reports
6) Compliance and Data Security
-
Any legal compliance to consider (e.g., GDPR, internal IT policies)
-
Preferred method for secure file sharing and data handling
7) Project Timeline and Milestones
-
Final delivery deadline
-
Prototype/demo review checkpoints
-
Time for final revisions and QA testing
8) Communication and Collaboration
-
Preferred channel (e.g., WhatsApp, Slack, Email)
-
Frequency of check-ins (daily, bi-weekly, milestone-based)
9) Additional Requirements or Customizations
-
Custom color themes, logo placement, white-labeling
-
Integration with other dashboards or platforms
-
Any future scalability considerations (e.g., for adding more data sources)
Portfolio

Multi-Region Sales Dashboard in Google Data Studio
Explore how a retail chain used Google Data Studio to build a real-time sales dashboard tracking regional performance, sales reps, and product KPIs. A case study in sales data visualization and decision-making efficiency.
SaaS Sales Funnel Dashboard in Looker Studio
See how a SaaS company used Looker Studio to visualize its lead-to-conversion funnel by integrating Google Analytics, HubSpot, and Stripe. A case study in aligning sales, marketing, and revenue insights through data.
Product-Level Sales and Inventory Dashboard for E-Commerce
Learn how a D2C brand used Google Data Studio to track SKU-level sales, profit margins, and stock levels. A case study in e-commerce dashboard design for data-driven inventory and pricing decisions.
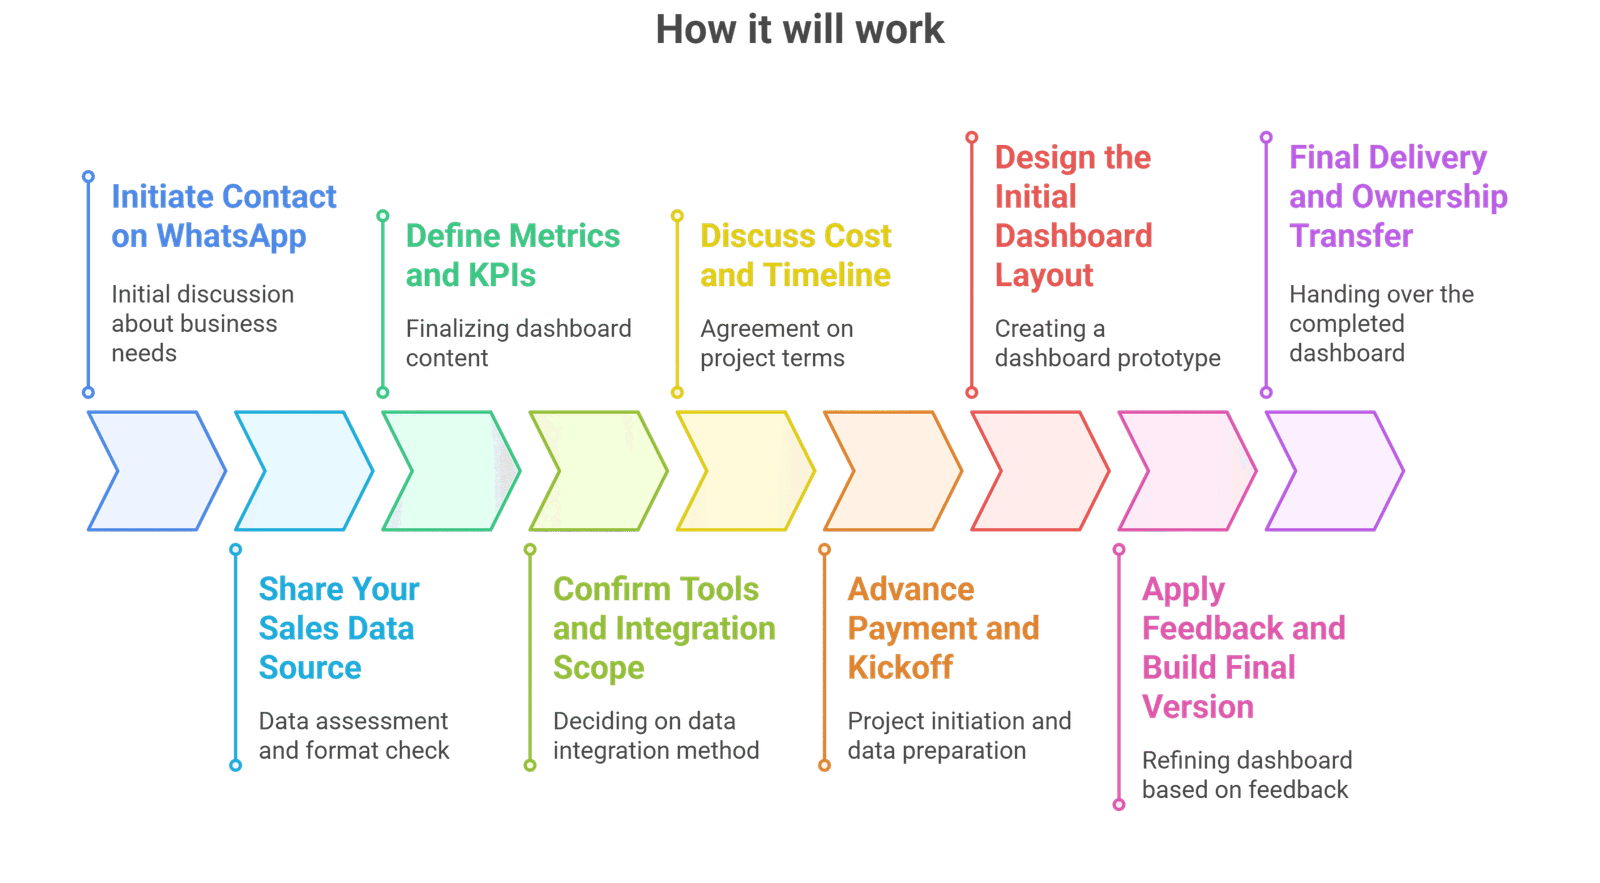
Process
Quick View
Starts at $55
Basic dashboard, limited filters
-
 3
Days Delivery
3
Days Delivery
-
 1
Revision
1
Revision
Growth Monitor
Starts at $95
Interactive insights with drilldowns
-
5
Days Delivery
-
3
Revisions
Pro Dashboard
Starts at $250
Advanced analytics with full access
-
12
Days Delivery
-
Unlimited
Revisions


