
I can help you develop compelling data story in Tableau
- 0
- (0)
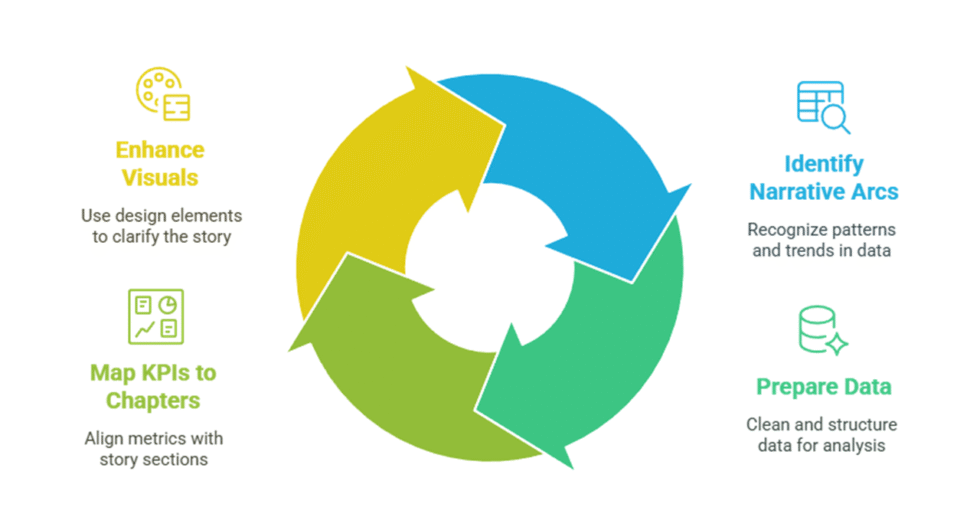
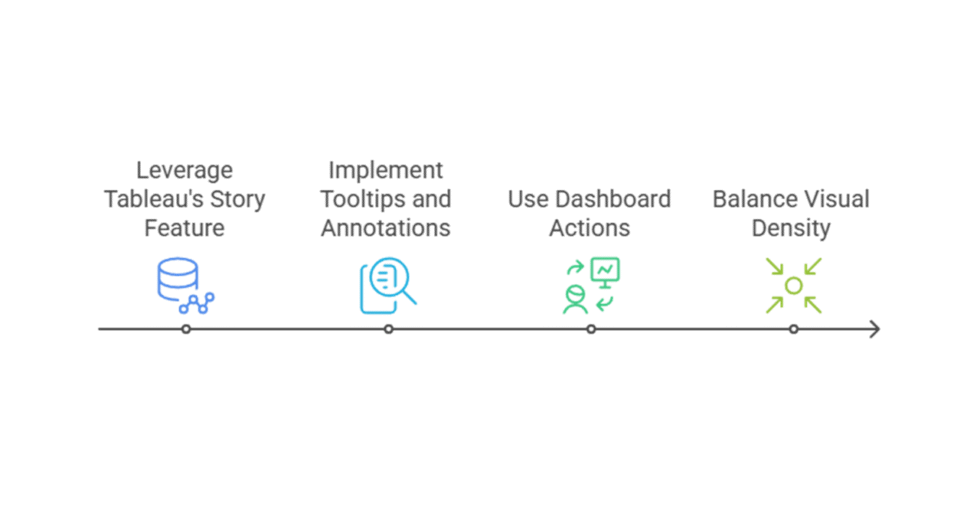
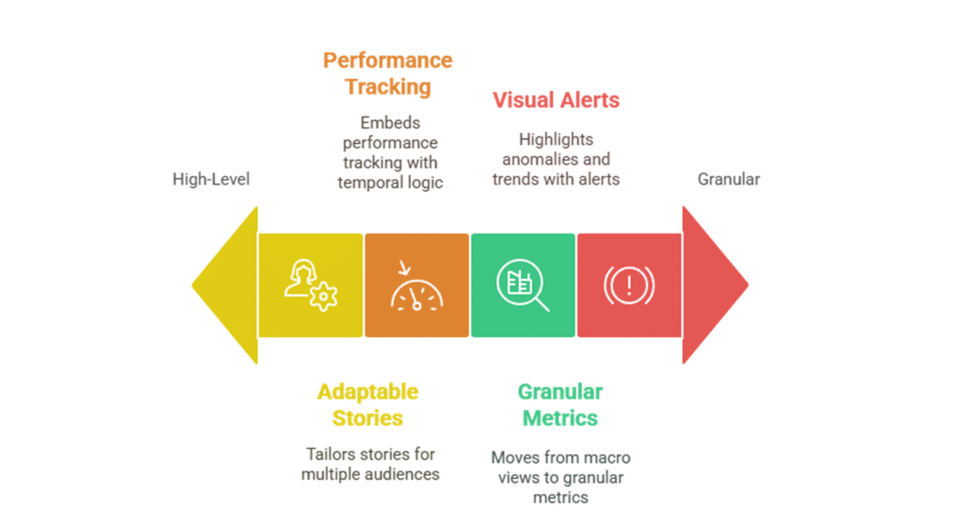

Project Details
Why Hire Me?
📱Click to Connect on Whatsapp to Discuss Your Project
I bring 7+ years of experience in data storytelling, dashboard design, and visualization strategy, helping clients across industries communicate data-driven insights in a format that is both intuitive and persuasive.
Why Clients Choose My Tableau Storytelling Service:
-
Deep expertise in narrative design using Tableau Story Points and interactive flows
-
Proficient in aligning visuals with business context and audience expectations
-
Skilled in multi-source data handling, annotation, layout design, and guided navigation
-
Experience across sectors: business analysis, academia, policy research, marketing
-
Focus on user engagement, clarity, and decision-enabling insights
-
I support you in presenting and explaining your data story confidently
What I Need to Start Your Work
To begin building a compelling Tableau data story tailored to your goals, please share the following:
1) Project Overview and Storytelling Objectives
-
Brief summary of what message or insight the data story should communicate
-
Primary theme or question the story should answer (e.g., growth, change, trend, correlation)
2) Data Requirements and Sources
-
All relevant data files or access credentials (CSV, Excel, SQL, cloud sources)
-
Data definitions (variable meanings, timeframes, units, etc.)
-
Indicate if the data is clean or needs preparation
3) Visualization and Design Elements
-
Any style guide, brand elements, or visual preferences to follow
-
List of desired charts (e.g., maps, time series, waterfall, heatmaps)
-
Preferences for Tableau features like filters, actions, or story navigation points
4) Narrative Flow and Content Structuring
-
Preferred structure: intro, development, resolution, or business case walkthrough
-
Key observations or turning points in the data to highlight
-
Requirements for embedded text, captions, or explanations within the visual
5) User Engagement and Accessibility
-
Intended audience: internal team, leadership, public, clients, etc.
-
Preferred interactivity level: passive viewing or active exploration
-
Specific accessibility concerns (e.g., font size, color contrast)
6) Compliance and Data Ethics
-
Mention any privacy laws (e.g., GDPR, HIPAA) or internal compliance guidelines
-
Notes on sensitive content or data masking needs
-
Expectations for neutral, ethical interpretation of findings
7) Project Timeline and Review Stages
-
Ideal deadline and any intermediate checkpoints
-
Review expectations (e.g., 1 draft, 2 revisions)
-
Preferred turnaround time for feedback
8) Communication and Collaboration Approach
-
Your preferred mode of communication (Email, WhatsApp, Zoom, Trello)
-
Frequency of updates or progress check-ins
-
Collaborative tools if co-authoring the story or providing live feedback
9) Additional Customizations or Requirements
-
Need for mobile/tablet responsiveness
-
Requirement for exporting to PDF, PowerPoint, or Tableau Public
-
Requests for dashboard embedding or live publishing setup
Portfolio

India's Digital Divide: A Tableau Data Story on Internet Access and Socioeconomic Inequality
This Tableau story highlights disparities in internet access across Indian states and links them to education, income, and rural–urban differences. Designed to help NGOs and policy-makers visually explore digital inequality.
From Heatwaves to Hazards: A Tableau Narrative on Climate Extremes in Indian Cities
Explore rising temperature patterns, climate vulnerability, and health risks in Indian urban areas through an interactive Tableau story. Built to support environmental NGOs and research outreach.
The Journey of a Buyer: A Tableau Storyboard on E-commerce Funnel Analysis
A visual story that traces customer behavior from site entry to purchase, with drop-off points and conversion zones. Ideal for D2C brands seeking visual insights into marketing performance.
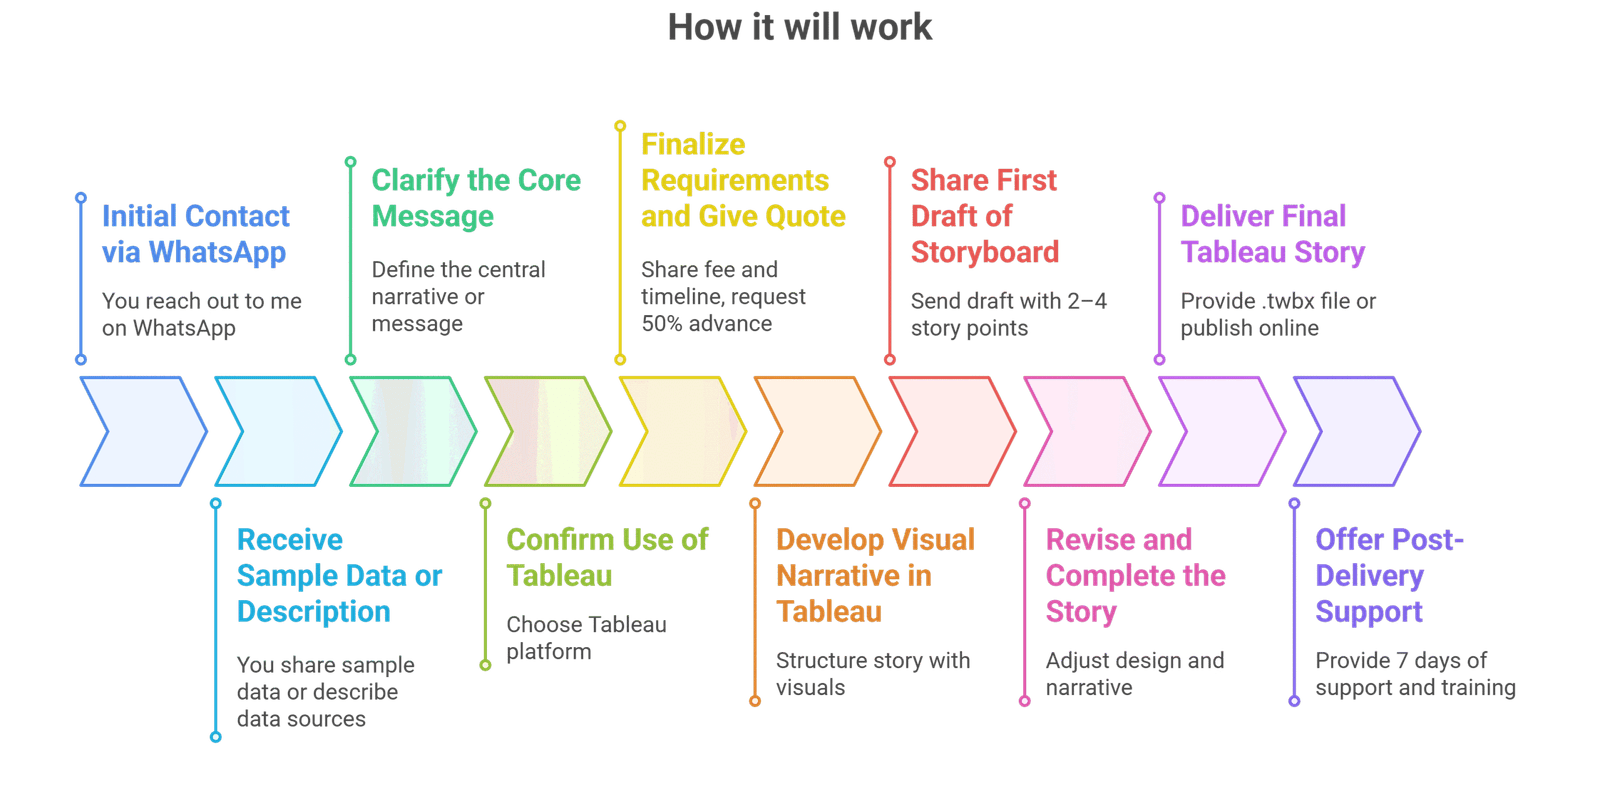
Process
Starter Storyline
Starts at $55
Visual story using static charts and annotations
-
 3
Days Delivery
3
Days Delivery
-
 1
Revision
1
Revision
Interactive Narrative
Starts at $150
Multi-step story with interactive elements
-
5
Days Delivery
-
3
Revisions
Strategic Data Journey
Starts at $299
Full story arc with drilldowns and insights
-
12
Days Delivery
-
Unlimited
Revisions


