
I can help you conduct statistical analysis and reporting using R
- 4.7
- (5)
Project Details
Why Hire Me?
📱Click to Connect on Whatsapp to Discuss Your Project
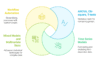
With 7+ years of experience across industries, I provide statistical analysis using R that is both methodologically sound and tailored to your goals.
-
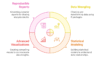
Advanced proficiency in R packages such as
ggplot2,dplyr,tidyr,shiny,caret, andstats -
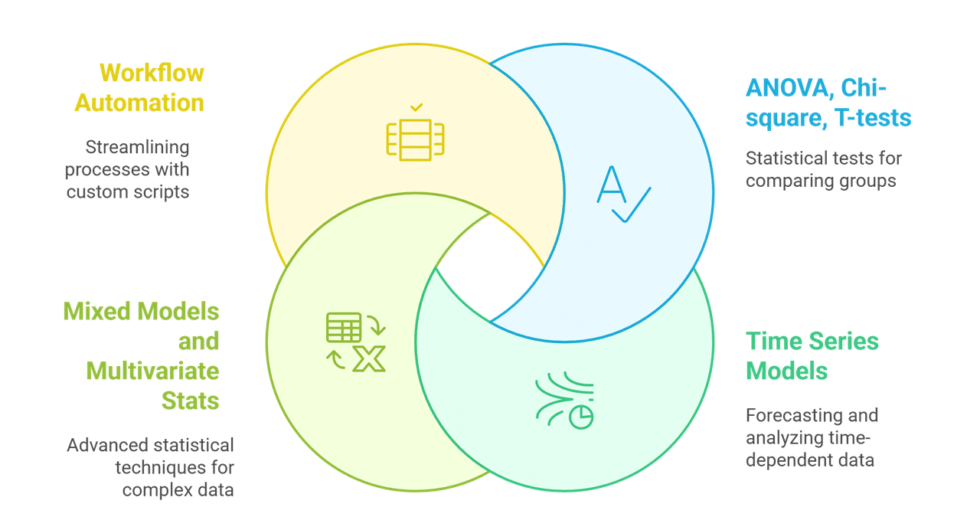
Skilled in descriptive, inferential, and predictive techniques, including regression, ANOVA, and time-series modeling
-
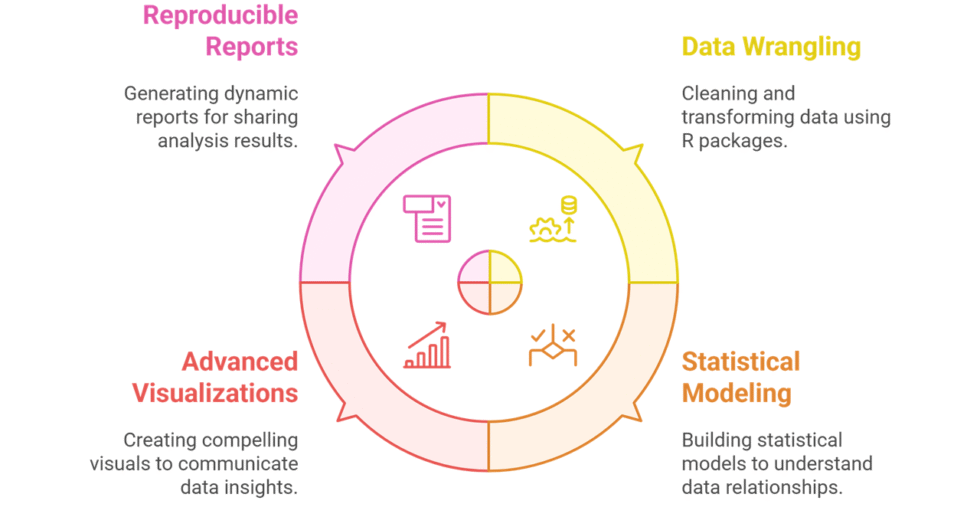
Capable of integrating narrative and visuals in R Markdown for clear reporting
-
Experienced in academic, corporate, and policy-oriented projects
-
Focused on interpretability, reproducibility, and client-specific outcomes
What I Need to Start Your Work
-
Project Details
-
Clear objective of the project and specific research or business questions
-
Any background details that impact analysis scope or assumptions
-
-
Data and Data Description
-
Dataset(s) in CSV, Excel, or text format
-
Metadata including source, variable definitions, units, and any preprocessing already done
-
-
Analytical Requirements
-
Desired techniques (e.g., regression, t-tests, clustering, forecasting)
-
Any mandatory R packages or custom functions to be used
-
-
Reporting Preferences
-
Required format (e.g., PDF via R Markdown, HTML dashboard via Shiny)
-
Any academic or professional formatting requirements
-
Expectations for visualizations, tables, or appendix content
-
-
Communication & Timeline
-
Preferred communication method and update frequency
-
Key milestones or final deadline for delivery
-
Portfolio
Statistical Analysis of Mental Health Survey Data Using R for a U.S. University Counseling Program
Applied descriptive and inferential statistics in R to analyze mental health trends from student surveys. Findings guided the expansion of tele-counseling services at a major U.S. university.
ANOVA and Regression Modeling in R to Assess Sales Channel Performance for a U.S. Retail Brand
Used ANOVA and multiple regression in R to evaluate how in-store, online, and third-party sales channels impact total revenue. Enabled a U.S. retailer to reallocate 18% of its quarterly marketing budget.
Time Series Forecasting and Statistical Reporting in R for a U.S. Public Health Initiative
Performed time series decomposition and forecasting in R to monitor flu season trends across counties. Supported early vaccine distribution planning in collaboration with a state health department.
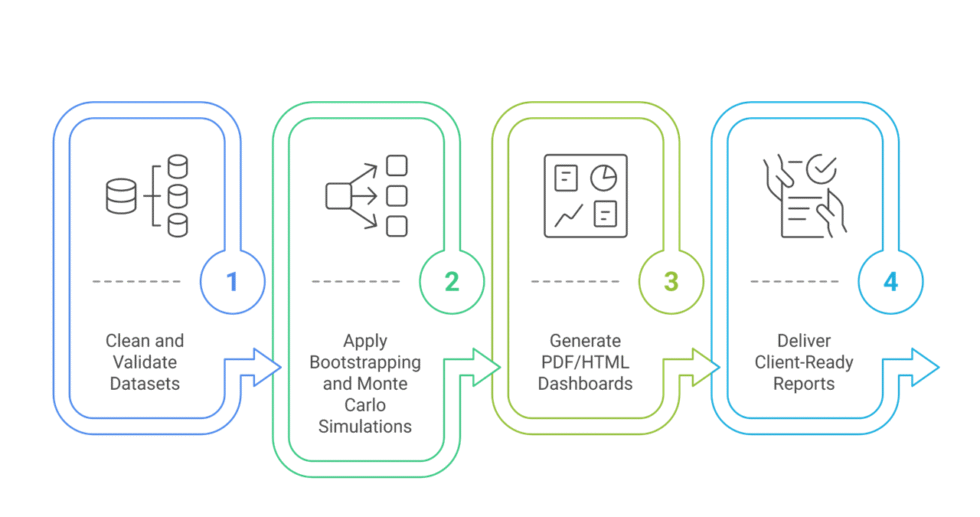
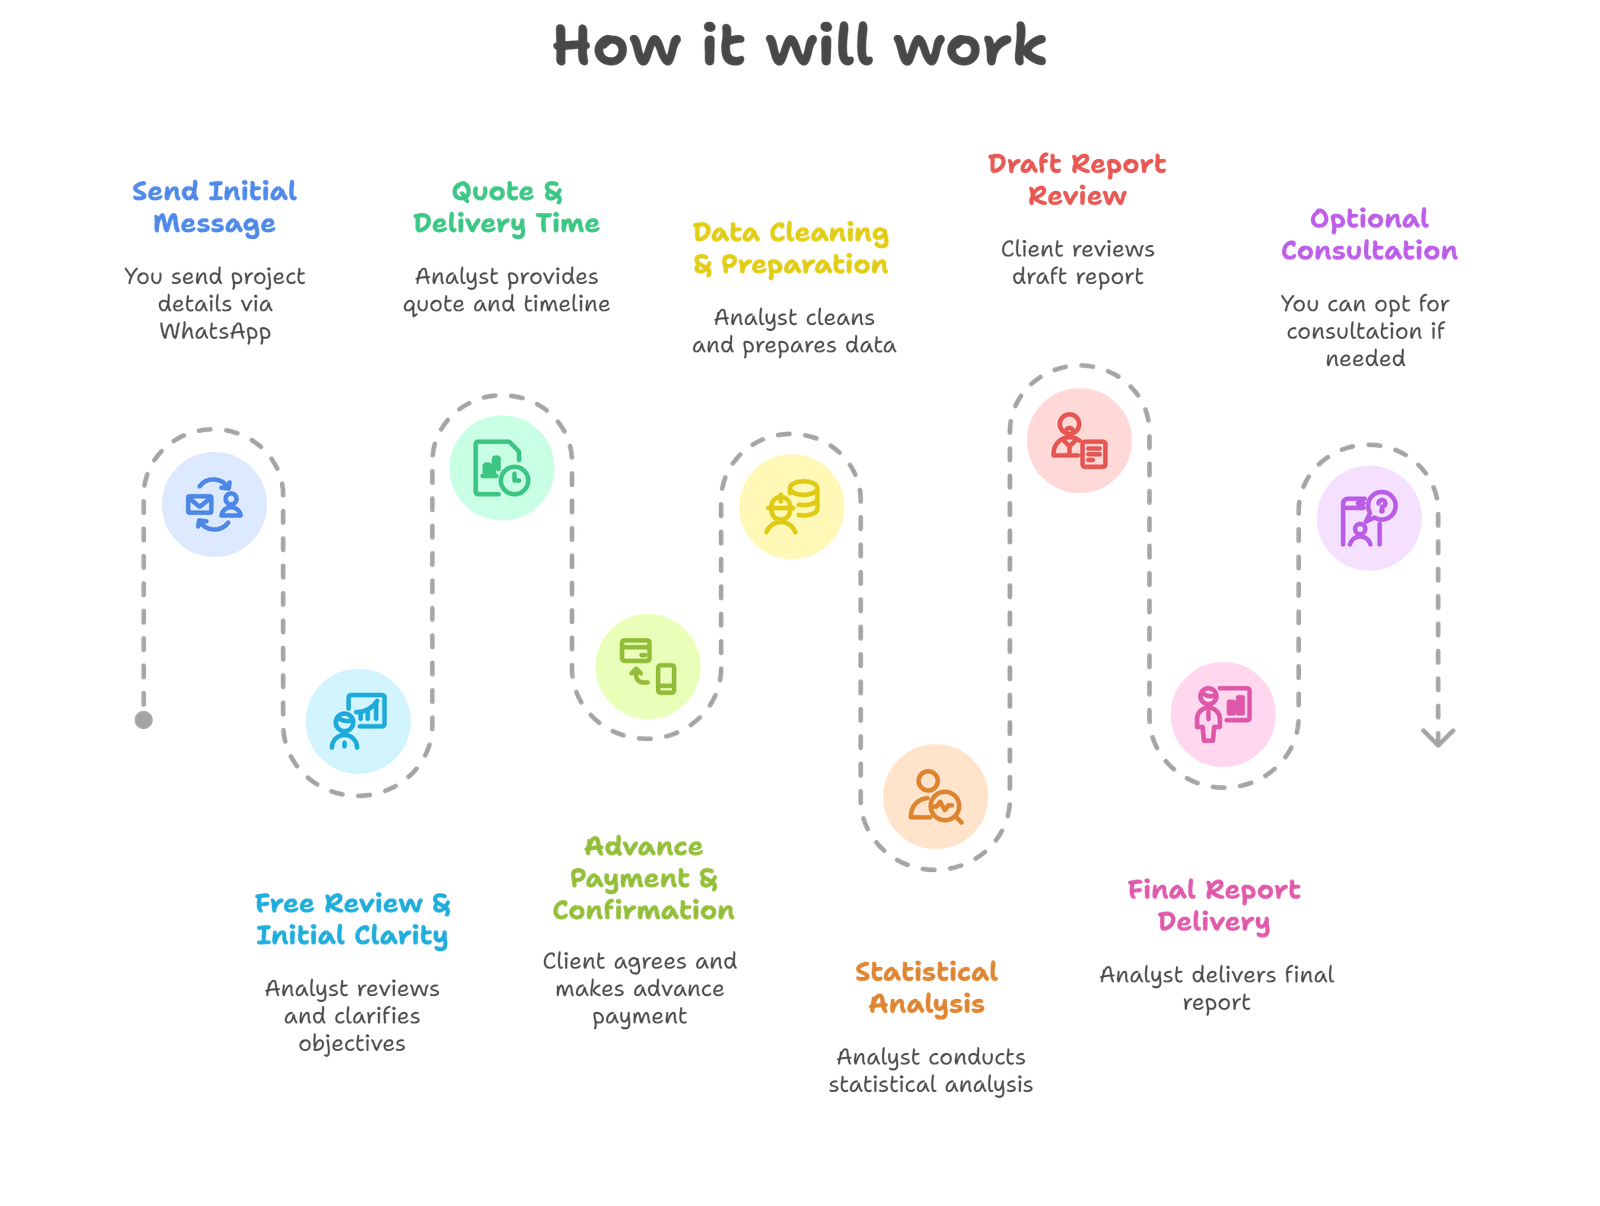
Process
Customer Reviews
5 reviews for this Gig ★★★★★ 4.7
very professional approach explained everything in simple terms helped me understand the ANOVA output and assumptions clearly
the analysis was okay but some of the plots needed more labels after i mentioned it he revised them quickly without issue
i liked the depth of the analysis especially how he handled outliers in my data using base r and visualised with ggplot
cleaned my dataset using dplyr and did everything from t tests to regression the final output looked very polished
he used R markdown to build my report and even added visualizations that helped me explain the trends better to my professor
R Programming Basics
Starts at $25
Summary stats with visuals
-
 3
Days Delivery
3
Days Delivery
-
 1
Revision
1
Revision
R Programming Analytics
Starts at $65
Hypothesis-driven visual report
-
5
Days Delivery
-
2
Revisions
R Forecast Pro
Starts at $120
Predictive modelling + output
-
7
Days Delivery
-
3
Revisions


