
I can help you conduct data analysis and reporting using Excel
- 4.5
- (5)

Project Details
Why Hire Me?
📱Click to Connect on Whatsapp to Discuss Your Project
With over 7 years of experience working across industries, I specialize in using Excel for efficient data analysis and reporting. My approach ensures accuracy, actionable insights, and clear presentations tailored to client-specific goals.
Key Strengths:
-
Expert in PivotTables, nested formulas, and advanced functions like INDEX-MATCH, SUMIFS, and array formulas
-
Skilled in creating interactive dashboards, automated reports, and business models in Excel
-
Experienced with financial, marketing, HR, and research datasets
-
Proficient in regression, scenario analysis, data cleaning, and trend reporting
-
Committed to timely delivery, data privacy, and industry-standard output formats
What I Need to Start Your Work
To deliver an accurate and custom analysis, please share the following:
1) Project Overview and Objectives
-
What is the core purpose of this project?
-
Specific problems or questions the Excel analysis should address
2) Data Specifications
-
Format and size of the dataset (Excel, CSV, Google Sheets, etc.)
-
Key variables and indicators to focus on
-
Current status: raw, partially cleaned, or preprocessed
3) Excel Analysis Requirements
-
Functions/tools needed: e.g., PivotTables, VLOOKUP/XLOOKUP, conditional formatting, solver
-
Type of statistical or financial analysis required
-
Any formulas or logic to be retained or rewritten
4) Report Format and Output
-
Report format (dashboard, table, written summary, presentation-ready workbook)
-
Expected length and required visualizations
-
Citation or formatting requirements, if academic
5) Data Privacy and Ethics
-
Whether the data contains any sensitive or confidential content
-
Any NDAs or privacy compliance requirements
6) Timeline and Deadlines
-
Final submission deadline
-
Preferred schedule for interim updates or drafts
7) Communication Preferences
-
Preferred communication mode: WhatsApp, Email, Google Docs
-
Review schedule and feedback format
8) Additional Notes
-
Any prior work to refer to
-
Preferences for formatting, color schemes, or Excel version compatibility
Portfolio
Excel-Based HR Dashboard to Analyze Employee Attrition Patterns
Explore how Excel PivotTables and dashboards were used to analyze employee attrition in an IT company. This case study includes tenure analysis, department-level trends, and HR insights to improve retention strategies.
Excel Sales Dashboard for Regional Profitability Tracking
Learn how a retail business used Excel to merge regional revenue and cost data into a dynamic profitability dashboard. This case study highlights KPI tracking, gross margin analysis, and interactive visuals built entirely in Excel.
Excel Dashboard for Analyzing Complaint Resolution Time and SLA Breaches
Explore how a service company used Excel to analyze complaint resolution times, identify SLA breaches, and improve customer support efficiency. This case study features time-based metrics, heatmaps, and actionable dashboards built entirely in Excel.
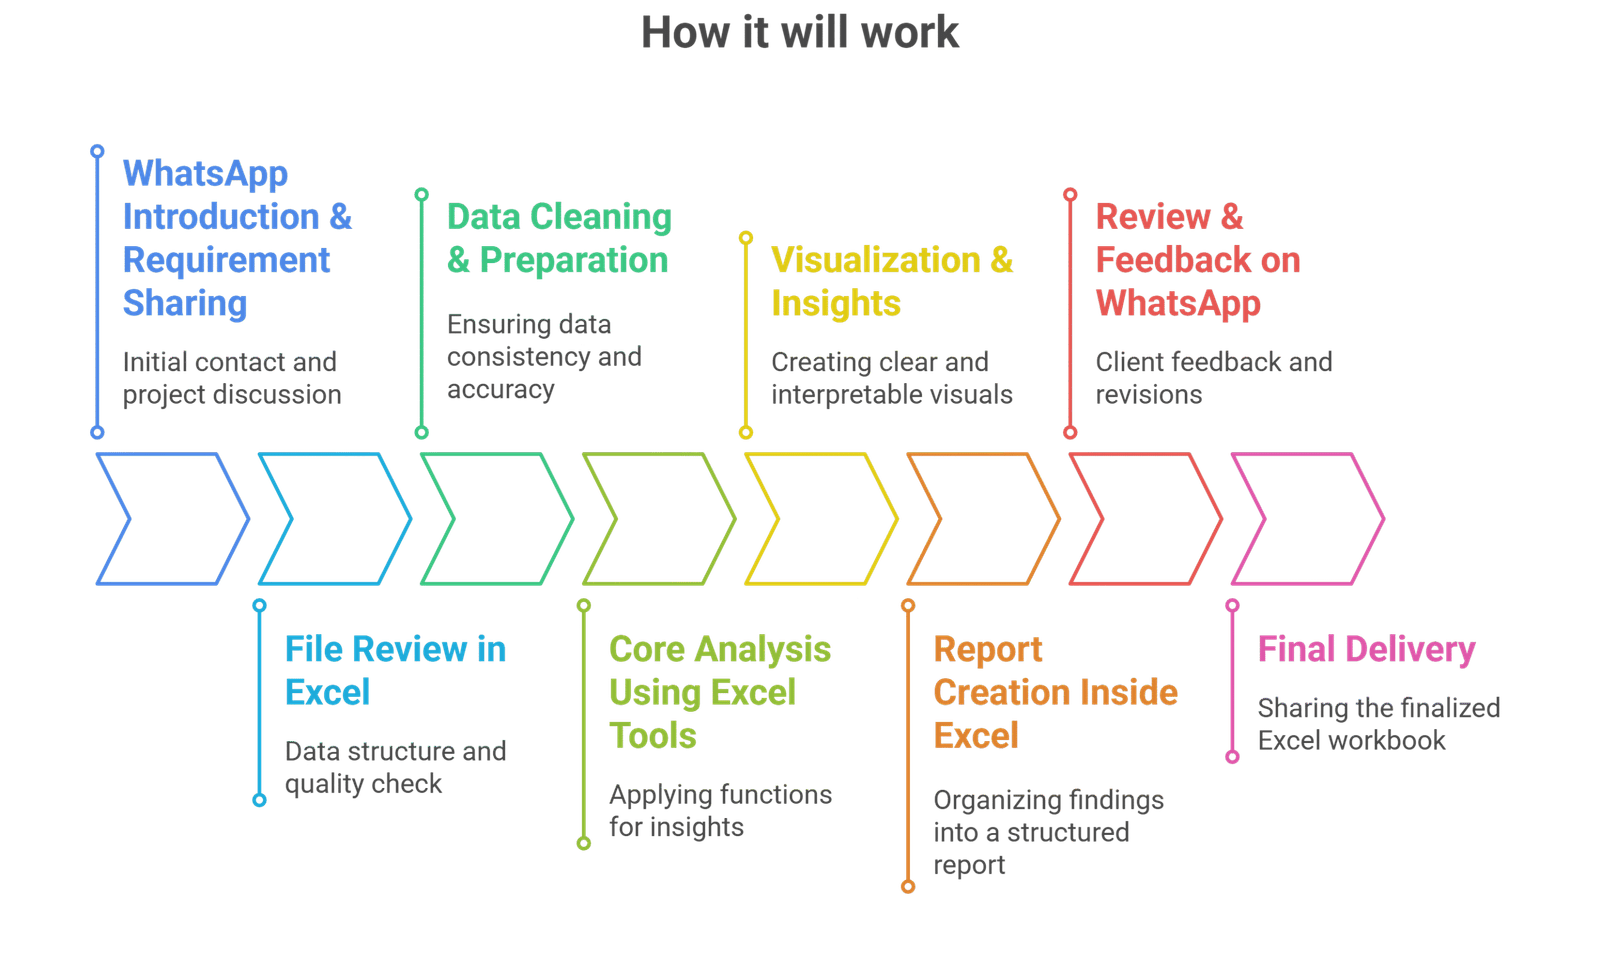
Process
Customer Reviews
5 reviews for this Gig ★★★★★ 4.5
i needed help with cointegration and granger causality and he did it so neatly only wish i had found him earlier would have saved weeks
he knew how to run all the stationarity tests and explained every step worked great for my economic research paper
used eviews for panel data regressions in my thesis he found an issue with my model that even my professor missed highly recommend
report was super helpful especially the graphs still felt a bit heavy with too much technical stuff maybe simpler summary in start would help
i had a forecasting task for exchange rate data and he handled it very professionally got the VAR output clean and well explained
Quick Summary
Starts at $55
Clean and summarize data
-
 3
Days Delivery
3
Days Delivery
-
 1
Revision
1
Revision
Visual Report
Starts at $95
Structured report with charts
-
8
Days Delivery
-
3
Revisions
Dashboard Pro
Starts at $150
Full dashboard and insights
-
12
Days Delivery
-
Unlimited
Revisions


