
Future with Exponential Smoothing in Excel: A Guide to Forecasting Like a Pro
Need Help with Statistics, Machine Learning, Data Science?
Hey there, Welcome to Statssy! Long time back I read a book where author quoted an amazing line. “Forecasting techniques are as accurate as a bling folded monkey throwing darts.” But I don’t completely agree with that because forecasting techniques may not be 100% accurate but even a 70-80% accuracy can bring you unimaginable benefits. So in today’s tutorial, I will be explaining you end to end about Exponential Smoothing technique in Excel.
What is Forecasting in Business
Hey there, trendsetters and future moguls! Ever wondered how you could be the first to know about the next big thing? Whether it’s predicting the next viral TikTok dance or knowing when your fave brand is dropping their latest collection, forecasting is your magic wand.
So, What’s the Secret Sauce of Exponential Smoothing?
Let’s talk about “Exponential Smoothing”—yeah, it sounds like a term from a sci-fi movie, but trust us, it’s the real deal. This is the technique that helps businesses predict future sales, trends, and so much more. Imagine it as the algorithm behind your personalized Netflix recommendations but for, you know, important business stuff.
Your Crystal Ball for Business
Speaking of business, how about a tool that’s like a crystal ball but for your company’s future? That’s where our forecasting service comes in. It’s designed to help you see what’s coming so you can plan like a pro. Check it out here!
What Market Research Reports say about Forecasting
Still not convinced? Let’s sprinkle in some mind-blowing stats:
- According to the Aberdeen Group, companies that nail their forecasts are 7-10% more likely to see year-over-year sales growth. Not just that, they’re twice as likely to outshine their competitors.
- A 2021 study by InsightSquared revealed that a whopping 68% of companies missed their forecasts by more than 10%. But here’s the kicker: the same research shows there’s room for improvement through better processes and tech.
- And get this, in a 2021 McKinsey Global Survey, 56% of respondents said they transformed their sales game by using forecasting based on past data and trends.
So, ready to dive into the world of Exponential Smoothing and forecasting with Excel? Let’s get started!
Forecasting—What’s the Big Deal?
Ever wondered how businesses seem to know just what you want, even before you do? Well, that’s the magic of forecasting!
What Even is Forecasting, Though?
So, you know how you check your weather app to see if you’ll need to grab an umbrella on your way out? That’s a basic form of forecasting! But instead of predicting rain or shine, businesses use forecasting to predict all sorts of things—like how many people will buy their new product or what the next big trend will be.
In the simplest terms, forecasting is like having a crystal ball for businesses. It’s not always 100% accurate (sorry, no spoilers here! ), but it’s close enough to help you make some pretty smart decisions. So, why is forecasting important? It’s the key to planning for the future, avoiding costly mistakes, and seizing opportunities before anyone else does.
The Ultimate Cheat Code for Businesses to Use Exponential Forecasting
Imagine you’re deep into a video game, and you’ve got this cheat code that tells you where all the hidden treasures are. That’s what forecasting is for businesses—it’s the cheat code for decision-making!
Whether you’re a business owner about to launch a new product or a student diving into the world of business analytics, forecasting is your go-to tool for making informed decisions. Just like knowing the release date of the next big game helps you plan your gaming nights, forecasting helps businesses plan their strategies. It’s the cheat code for businesses that want to level up.
To give you some context, these are just a few examples how businesses are using Forecasting Techniques.
| Theme | Application | Detailed Example |
|---|---|---|
| Plan for the Future | ||
| Strategic Planning | TrendyThreads TrendyThreads, a fashion retailer, uses forecasting to analyze past sales data and social media trends. They predict that sustainable fashion will be the next big thing. Based on this, they decide to launch a new eco-friendly clothing line in the upcoming season. | |
| Resource Allocation | HealMeQuick Hospital HealMeQuick Hospital uses patient volume forecasts to determine busy hours and days. They allocate more nurses and doctors during flu season and keep fewer staff during slow periods, ensuring efficient use of resources. | |
| Avoid Costly Mistakes | ||
| Risk Assessment | RiskyBiz Investments RiskyBiz Investments uses market forecasts to assess the risk levels of various stocks and bonds. They decide to pull out of investing in a tech company that shows signs of declining in the next quarter, thus avoiding a potential financial pitfall. | |
| Cost Savings | YumYum Eateries YumYum Eateries uses inventory forecasts to manage their perishable goods. They predict lower customer turnout during a local sports event and therefore reduce their order of fresh produce, minimizing waste and saving costs. | |
| Seize Opportunities | ||
| Market Trends | GlamGlow Cosmetics GlamGlow Cosmetics uses social media trend forecasts to identify that unicorn-themed products are gaining traction. They quickly launch a limited edition “Unicorn Glow” makeup line, seizing the market trend before competitors. | |
| Competitive Advantage | QuickRide QuickRide, a ride-sharing company, uses demand forecasts to adjust pricing dynamically. They notice that demand spikes during local concerts and implement surge pricing, gaining a competitive edge and maximizing profits. |
Exponential Smoothing Formula
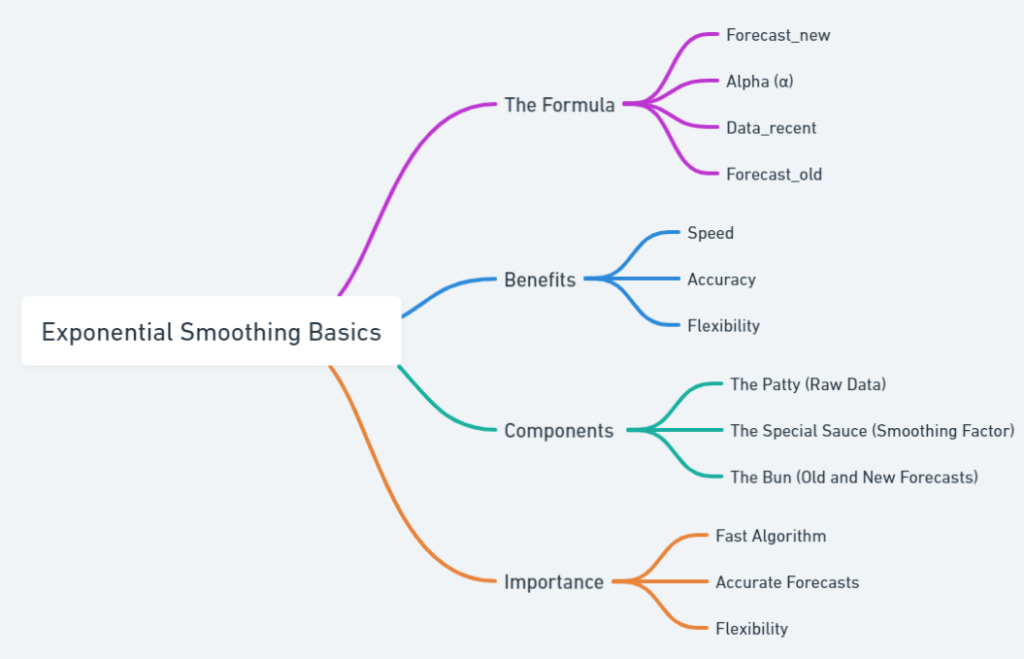
Alright, let’s get into the meat of the matter—the Exponential Smoothing formula itself! The formula looks like this:
Forecastnew = α × Datarecent + (1 – α) × Forecastold
Don’t worry; it’s not as complicated as it looks! Let’s break it down:
- Forecast_new: This is what we’re trying to find—the forecast for the next period.
- α (Alpha): This is the smoothing factor, a number between 0 and 1. It determines how much weight we give to the most recent data. The closer it is to 1, the more weight recent data gets.
- Data_recent: This is the most recent actual data point you have.
- Forecast_old: This is the forecast you made for the most recent period.
How to Cook this Forecasting Burger
- The Patty (Raw Data): Your historical data, like past sales, is your base. This is your
Data_recent. - The Special Sauce (Smoothing Factor): The alpha (α) is your secret ingredient. It’s what makes your forecast unique. If you set α closer to 1, your forecast will react more to recent changes. If it’s closer to 0, it’ll be more stable but slower to respond.
- The Bun (Old and New Forecasts): Your
Forecast_oldis the bottom bun that holds everything together. YourForecast_newis the top bun, completing your forecasting burger.
The VIP Pass to Forecasting: Why Exponential Smoothing?
Exponential Smoothing is like the VIP pass to the forecasting world. Why? Because it’s:
- Fast: This algorithm is quick, giving you forecasts in no time.
- Accurate: By adjusting the alpha (α), you can make your forecasts as sensitive to recent changes as you want.
- Flexible: Whether you’re forecasting sales for a Black Friday event or predicting website traffic during a holiday, you can adjust the formula to meet your specific needs.
To summarize what I said about exponential smoothing, lets see a quick reference guide.
Section 3: Why Excel is Your New BFF
Alright, so we’ve talked about the magic of forecasting and the secret sauce that is the Exponential Smoothing formula. Now, let’s talk about the kitchen where all this magic happens—Excel!
Why use MS Excel – The Photoshop for Numbers
You know how Photoshop is the go-to for anything related to photo editing? Well, think of Excel as the Photoshop for numbers. It’s where data transforms into insights, and numbers turn into strategies. Excel is the go-to platform for Exponential Smoothing because it offers a blend of simplicity and power that’s hard to beat. Whether you’re a student trying to forecast grades or a business owner predicting sales, Excel has got you covered.
Setting Up Your Forecasting Adventure in Excel
Before you start your forecasting journey, you’ll need to set up Excel for Exponential Smoothing. Here’s how:
- Open a New Workbook: Launch Excel and open a new, blank workbook.
- Input Your Data: Enter your historical data in a column. This could be anything from past sales figures to website traffic numbers.
- Install Analysis ToolPak: Go to
File > Options > Add-Ins. In the Manage box, selectExcel Add-insand clickGo. Check theAnalysis ToolPakbox and clickOK. - Navigate to Data Analysis: Once the ToolPak is installed, go to the
Datatab and you’ll see aData Analysisoption. Click on it and selectExponential Smoothing. - Configure Settings: You’ll be prompted to select your data range and input your smoothing factor (alpha). Do so according to your needs.
And just like that, you’re all set to use Excel for Exponential Smoothing and make some killer forecasts! We will see an example also. Don’t worry!
Why Excel Wins: A Comparative Look
When it comes to forecasting tools, there are several big names in the game. But what makes Excel the GOAT? Check the table below for quick comparison with other tools!
| Feature | Excel | SPSS | STATA | Python | R | SAS | AI-Based Tools |
|---|---|---|---|---|---|---|---|
| Ease of Use | High (Chill) | Medium (Meh) | Low (Yikes) | Medium (Meh) | Low (Yikes) | Medium (Meh) | Low (Yikes) |
| Customizability | High (Lit) | High (Lit) | High (Lit) | Very High (Fire) | Very High (Fire) | High (Lit) | Very High (Fire) |
| Cost-Effectiveness | Medium (Gucci) | Low (Nope) | Low (Nope) | High (Dope) | High (Dope) | Low (Nope) | Medium (Gucci) |
| Data Handling | High (Lit) | High (Lit) | Medium (Meh) | Very High (Fire) | Very High (Fire) | High (Lit) | Very High (Fire) |
| Community Support | Extensive (Squad Goals) | Moderate (Fam) | Limited (Ghosted) | Extensive (Squad Goals) | Extensive (Squad Goals) | Moderate (Fam) | Emerging (Newbie) |
| Learning Curve | Easy (No Cap) | Moderate (Bet) | Steep (Oof) | Moderate (Bet) | Steep (Oof) | Moderate (Bet) | Steep (Oof) |
| Built-in Functions | Extensive (Squad Goals) | Extensive (Squad Goals) | Limited (Ghosted) | Requires Libraries (DIY) | Requires Libraries (DIY) | Extensive (Squad Goals) | Requires Libraries (DIY) |
| Real-Time Analysis | Limited (Basic) | Available (Flex) | Limited (Basic) | Available (Flex) | Available (Flex) | Available (Flex) | Available (Flex) |
Feature Breakdown:
- Ease of Use (Chill vs. Yikes): Excel’s user-friendly interface makes it accessible to everyone, from students to CEOs. While Python and R offer great functionality, they require coding skills.
- Customizability (Lit vs. Fire): Python and R offer the most customization but require coding expertise. Excel offers a good balance of customizability and ease of use.
- Cost-Effectiveness (Gucci vs. Nope): Python and R are open-source and free, but they have a steep learning curve. Excel offers a middle ground with moderate costs and a user-friendly interface.
- Data Handling (Lit vs. Fire): While Python and R can handle large datasets, Excel offers more than enough capability for small to medium-sized datasets, which is often sufficient for most businesses.
- Community Support (Squad Goals vs. Newbie): Excel has been around for ages and has a large community. Python and R also have strong communities but are more specialized.
- Learning Curve (No Cap vs. Oof): Excel is generally easier to pick up, especially if you’re not from a coding background. Tools like STATA and SAS require specialized training.
- Built-in Functions (Squad Goals vs. DIY): Excel and SPSS offer a wide range of built-in functions for statistical analysis, making it easier for beginners to get started.
- Real-Time Analysis (Basic vs. Flex): Advanced tools like SPSS and Python offer real-time data analysis capabilities, but Excel is catching up with features like Power BI integration.
So, are you convinced that Excel is your new BFF for forecasting?