Why Your Data Might Be Lying to You: The Coefficient of Variation & Skewed Data Problem
Hey there, welcome to Statssy! Today I will explain you something new related to age old coefficient of variation.
Why Should You Even Care About Data?
So, you’re scrolling through your feed and stumble upon this blog post. You might be wondering, “Why should I even care about data?” Well, let me spill the tea for you!
Understanding Data is Like Having a Superpower
Imagine you’re watching your favorite superhero movie. You see them flying around, saving the day, and you think, “Wow, having superpowers would be so cool!” Guess what? Understanding data is like having your own superpower. Seriously!
With this power, you can predict trends, make smarter decisions, and even impress your friends with your newfound wisdom. Ever wondered how Netflix knows exactly what show you’ll binge-watch next? Or how your favorite online store always seems to know what you want? Yep, that’s the power of data analytics.
What This Blog Will Teach You about Data Analysis and Why You Should Stick Around
Okay, so now you’re intrigued. But what’s in it for you? This blog post is going to be your ultimate guide to understanding the Coefficient of Variation and why it might not always be the best tool for understanding your data.
We’ll dive into:
- What the Coefficient of Variation is and why people use it
- Why it sometimes fails, especially with skewed data (Confused about what is left and right skewness? )
- Some super cool alternatives that are like the next-gen gaming consoles of data analysis
And the best part? We’re going to make it fun, relatable, and super easy to understand. No boring lectures here, promise!
So, if you’re ready to unlock this superpower and become the hero of your own data story, stick around. Trust me, you won’t want to miss this!
Key Takeaways: What’s in It for You?
Before we jump into the deep end, let’s give you a sneak peek of the treasure trove of knowledge you’re about to unlock. Here’s a quick rundown of the cool stuff you’ll learn:
- Decode the Mystery of Coefficient of Variation (CV) : Ever heard of CV and wondered what the hype is all about? We’ll break it down for you in the simplest terms.
- Why CV Can Be a Drama Queen: Learn why CV sometimes throws a fit and doesn’t play nice with skewed data. Yep, even numbers have their moods!
- Meet the New Rockstars of Data Analysis : Discover alternative measures that are like the latest iPhone models compared to CV’s old-school flip phone. vs
- Real-World Hacks for Data Newbies: Get practical tips and tricks that you can use in your daily life, whether you’re shopping online, investing in crypto, or just trying to be the smartest person in the room.
- Level Up Your Data Game : By the end of this blog, you’ll have enough knowledge to impress not just your friends, but maybe even your boss or professor. Who knows, this could be your first step towards becoming a data scientist!
So, are you excited yet? Because we’re just getting started!

What’s This Coefficient of Variation Thing Anyway?
So, let’s get into the nitty-gritty. You’ve probably heard of the Coefficient of Variation, or CV for short. If you haven’t, no worries! We’re going to break it down like you’re five.
Breaking Down the Coefficient of Variation (CV) Like You’re Five
Imagine you have two jars of candy: one filled with gummy bears and the other with chocolate bars. You want to know which jar has candies that are more similar in size to each other. That’s where CV comes in!
CV is like a magical tool that tells you how “spread out” or “clumped together” things are in a group. So, if you use CV on your jars of candy, it can tell you whether the gummy bears or chocolate bars vary more in size.
In grown-up terms, CV is a statistical measure that helps you understand how much things differ from the “average” in a set of data. It’s calculated by taking the standard deviation (how spread out the data is) and dividing it by the mean (the average), then multiplying by 100 to get a percentage.
Why Coefficient of Variation is a Go-To Tool
Now, why do people love using Coefficient of Variation? Well, it’s like the Swiss Army knife of data analysis. It’s super versatile and can be used in a ton of different scenarios. Whether you’re a stock market enthusiast trying to decide which stocks are less risky, or a sports analyst figuring out which player is the most consistent, CV is your go-to tool.
It’s especially awesome because it lets you compare different kinds of data on the same scale. So, you could compare the sizes of gummy bears to the sizes of chocolate bars and figure out which is more consistent, even though they’re totally different kinds of candy! vs
So, to sum it up, CV is like that multi-talented friend who’s good at everything. Whether you’re dealing with grades, finances, or even candy sizes, CV has got your back.
Data Analysis of Instagram Influencers: Food Bloggers vs Comedians
Alright, let’s get real with an example that’s as relatable as your daily Insta-scroll. We’re talking about Instagram influencers, specifically Food Bloggers and Comedians.
The Scenario
Imagine you’re a brand looking to collaborate with influencers. You want to know which group—Food Bloggers or Comedians—has a more consistent viewership. Why? Because you don’t want to invest in someone who’s a one-hit-wonder; you want someone who consistently pulls in views.
Here’s some data we’ve got:
- Food Bloggers: 1.5, 2, 1.9, 1.7, 2.1, 2.3, 0.3, 0.6, 1.6, 1.4 (in million views)
- Comedians: 2, 1.9, 7.9, 4.9, 2.9, 0.6, 9.8, 1.6, 2.8, 6.5 (in million views)
The Math Part (Don’t Worry, We’ll Make It Easy!)
Mean (Average) Views
- Mean (Average) for : (1.5 + 2 + 1.9 + 1.7 + 2.1 + 2.3 + 0.3 + 0.6 + 1.6 + 1.4) / 10 = 1.54 million views
- Mean (Average) for : (2 + 1.9 + 7.9 + 4.9 + 2.9 + 0.6 + 9.8 + 1.6 + 2.8 + 6.5) / 10 = 4.1 million views
| Food Bloggers | ( x – xbar ) | ( (x – xbar)^2 ) | Comedians | ( x – xbar ) | ( (x – xbar)^2 ) |
|---|---|---|---|---|---|
| 1.5 | -0.04 | 0.0016 | 2 | -2.1 | 4.41 |
| 2 | 0.46 | 0.2116 | 1.9 | -2.2 | 4.84 |
| 1.9 | 0.36 | 0.1296 | 7.9 | 3.8 | 14.44 |
| 1.7 | 0.16 | 0.0256 | 4.9 | 0.8 | 0.64 |
| 2.1 | 0.56 | 0.3136 | 2.9 | -1.2 | 1.44 |
| 2.3 | 0.76 | 0.5776 | 0.6 | -3.5 | 12.25 |
| 0.3 | -1.24 | 1.5376 | 9.8 | 5.7 | 32.49 |
| 0.6 | -0.94 | 0.8836 | 1.6 | -2.5 | 6.25 |
| 1.6 | 0.06 | 0.0036 | 2.8 | -1.3 | 1.69 |
| 1.4 | -0.14 | 0.0196 | 6.5 | 2.4 | 5.76 |
Now, let’s use these calculations to find the Standard Deviation and Coefficient of Variation for both groups. Would you like to proceed with that?
- Standard Deviation for Food Bloggers: √((0.04 + 0.21 + 0.12 + 0.02 + 0.31 + 0.57 + 1.53 + 0.88 + 0.004 + 0.02)/10) = √(0.366) = 0.605 million views
- Standard Deviation for Comedians: √((4.41 + 4.84 + 14.44 + 0.64 + 0.04 + 12.25 + 32.49 + 6.25 + 1.69 + 5.76)/10) = √(8.331) = 2.888 million views
- Coefficient of Variation for Comedians (CV): (2.888 / 4.1) x 100 = 70.44%
- Coefficient of Variation for Food Bloggers (CV): (0.605 / 1.54) x 100 = 39.28%
What can we conclude from this?
With a CV of 39.28%, the Food Bloggers have a relatively consistent viewership. It’s like going to your fav food truck and knowing you’ll get something yummy every time. On the other hand, the Comedians have a CV of 70.44%, indicating a much higher variability in their viewership. It’s like going to a comedy club; some nights you’ll be rolling on the floor laughing, and other nights, not so much.
So, if you’re a brand looking for consistency, Food Bloggers might be your go-to. But if you’re willing to gamble for potentially higher views, Comedians could be your wild card.
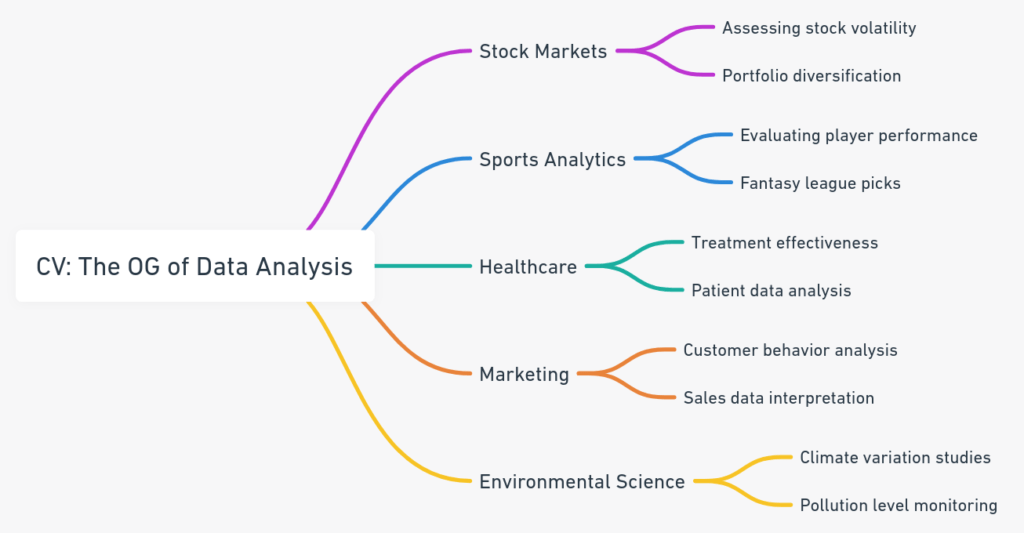
Why Coefficient of Variation is the OG of Data Analysis
Okay, so we’ve been talking a lot about the Coefficient of Variation, or CV. But why is it such a big deal? Why is it the OG (Original Gangster) in the world of data analysis? Let’s spill the tea.
How CV Has Been Used in Everything from Stock Markets to Sports Analytics
Coefficient of Variation in Stock Markets
In the world of finance, especially when it comes to stock markets, CV is like the secret sauce that investors use to make informed decisions. It helps them understand the volatility of different stocks. A lower CV means the stock is less risky, while a higher CV indicates higher risk but potentially higher rewards. It’s like playing a game of high-stakes poker; you’ve got to know the odds to play your cards right.
Coefficient of Variation in Sports Analytics
But hey, it’s not just the Wall Street folks who are in on this. Sports analysts use CV to evaluate player performance. For example, in soccer, CV can help determine which player is more consistent in scoring goals or making assists. It’s like having a cheat sheet for your fantasy league.
Coefficient of Variation in Healthcare
Even in healthcare, CV is a big deal. It’s used to assess the effectiveness of treatments and to understand patient data. Imagine knowing which medicine is more likely to work based on past data; that’s CV doing its magic.
Coefficient of Variation in Marketing
In the realm of marketing, CV helps businesses understand customer behavior. For example, if a company wants to know which product is selling consistently well, they can use CV to analyze sales data. It’s like having a crystal ball that tells you what your customers want.
Coefficient of Variation in Environmental Science
CV even makes an appearance in environmental science to study variations in climate, pollution levels, and more. It’s like the Swiss Army knife that’s useful in any situation.
So, whether you’re an aspiring Wall Street mogul, a sports enthusiast, a healthcare professional, or just someone who loves understanding the world through numbers, CV is your go-to tool. It’s been around, it’s tried and true, and it’s not going anywhere. That’s why it’s the OG of data analysis.
To summarize I created a quick reference guide
The Plot Twist: Coefficient of Variation Doesn’t Work for All Data
Just when you thought CV was the ultimate superhero of data analysis, here comes the plot twist: it’s not perfect. Yep, you heard that right. CV has its kryptonite, and it’s called skewed data and outliers. Let’s break it down.
What Happens When Data is as Skewed as a TikTok Algorithm
You know how your TikTok feed sometimes shows you the most random videos that make you go, “Why is this even here?” Well, skewed data is kinda like that. When your data leans too much in one direction, CV can give you misleading results. It’s like thinking you’re a cooking pro because you nailed that one viral TikTok recipe, but in reality, you can’t even boil water without setting off the smoke alarm.
In technical terms, skewed data can make the mean and standard deviation unreliable, which in turn makes the CV unreliable. It’s like trusting your TikTok For You Page to give you accurate news—it’s not the best idea.
Real Talk About Outliers and Why They’re the Party Crashers of Data Analysis
Imagine you’re at a party, and everything’s going great. The music’s good, the snacks are on point, and then someone walks in and changes the whole vibe. That’s what outliers are in the world of data—they’re the party crashers. They can skew your data and make your CV go haywire.
For example, if you’re analyzing the heights of people in a room and then a professional basketball player walks in, the average height will shoot up, and your CV will be off. It’s like trying to average out the spiciness of dishes at a potluck, and someone brings ghost pepper salsa.
So, while CV is a fantastic tool, it’s essential to know when to use it and when to look for alternatives. It’s like knowing which Instagram filter to use; not every filter works for every photo.
Meet the New Kids: Alternatives to Coefficient of Variation
Alright, so we’ve established that CV is cool but not foolproof. It’s like that old flip phone you had back in the day—reliable but not exactly cutting-edge. So, what’s the iPhone 15 Pro Max of data analysis? Let’s meet the new kids on the block: quantile-based measures!
Why Sticking to Just CV is Like Still Using a Flip Phone in 2023
Imagine still texting with T9 in 2023 or waiting five minutes to open a single email. That’s what it’s like if you’re only using CV for all your data analysis needs. Sure, it gets the job done, but you’re missing out on so much more. It’s like watching Netflix in standard definition when you could be experiencing it in 4K. CV is great for specific scenarios, but in a world that’s constantly evolving, you’ve got to keep up with the times. It’s like still using MySpace when everyone’s moved on to Instagram, TikTok, and whatever’s next. (not Threads. I don’t liked it at all)
Introducing Quantile-Based Measures That Are the Smartphones to CV’s Flip Phone
So, what are these quantile-based measures we’re talking about? Think of them as the next-gen smartphones of data analysis. They’re sleek, they’re smart, and they’re versatile.
- Interquartile Range divided by the Median: This is like the iPhone’s portrait mode but for data. It focuses on the middle 50% of your data, giving you a more balanced view.
- Median Absolute Deviation divided by the Median: This is like the Night mode on your smartphone camera. Even when things are a bit dark and murky (read: outliers and skewed data), it helps you see clearly.
These quantile-based measures are robust against outliers and skewed data, making them the perfect alternative to CV in many scenarios. It’s like upgrading from a flip phone to the latest smartphone—you didn’t know what you were missing until you made the switch!
The Interquartile Range/Median Combo
Alright, let’s talk about the Interquartile Range divided by the Median, or as I like to call it, the avocado toast of data analysis. Why avocado toast? Because it’s trendy, it’s reliable, and it gives you a well-rounded view of what you’re dealing with.
What It Is and Why It’s Like the Avocado Toast of Data Analysis
The Interquartile Range (IQR) focuses on the middle 50% of your data, cutting out the outliers that can mess up your analysis. When you divide it by the Median (the exact middle value), you get a robust measure of data dispersion. It’s like avocado toast: simple, yet sophisticated, and gives you a good sense of what you’re eating (or analyzing).
Calculations Using the Food Bloggers and Comedians Example
Let’s use our previous example of Food Bloggers and Comedians to understand this better.
Food Bloggers
- Sort the Data: 0.3, 0.6, 1.4, 1.5, 1.6, 1.7, 1.9, 2, 2.1, 2.3
- Find the Median: (1.7+1.6)/2 = 1.65 million views
- Find the Lower Quartile (Q1): (0.6+1.4)/2 = 1 million views
- Find the Upper Quartile (Q3): (2+2.1)/2 = 2.05 million views
- Calculate IQR: ( Q3 – Q1 = 2.05 – 1 = 1.05 ) million views
- IQR/Median: 1.05/1.65*100 = 63.64%
Comedians
- Sort the Data: 0.6, 1.6, 1.9, 2, 2.8, 2.9, 4.9, 6.5, 7.9, 9.8
- Find the Median: (2.8 + 2.9)/2 = 2.85 million views
- Find the Lower Quartile (Q1): (1.6 + 1.9)/2 = 1.75 million views
- Find the Upper Quartile (Q3): (6.5 + 7.9)/2 = 7.2 million views
- Calculate IQR: ( Q3 – Q1 = 7.2 – 1.75 = 5.45 ) million views
- IQR/Median: 5.45/2.85*100 = 191.23%
As you can see, the IQR/Median for Food Bloggers is 63.64%, indicating less variability. For Comedians, it’s a whopping 191.23%, showing a lot more variability.
Why Choose IQR/Median Over CV in This Case?
Okay, so you might be wondering, “Why should I go for this IQR/Median thing when CV has been my ride-or-die?” Well, let’s break it down.
In our example, the Food Bloggers had a CV of 39.28%, and the Comedians had a CV of 70.44%. While these numbers do indicate some level of variability, they don’t tell the whole story. Why? Because CV is sensitive to outliers and skewed data.
Remember that one comedian with 9.8 million views? That’s an outlier, and it skews the CV, making it look like comedians, in general, are super variable in their popularity. But is that really the case for most comedians? Not necessarily.
On the flip side, the IQR/Median for Food Bloggers was 63.64%, and for Comedians, it was 191.23%. These numbers give us a more nuanced picture. They tell us that while Food Bloggers are fairly consistent in their popularity, Comedians can be hit or miss—some are superstars, while others are still waiting for their big break.
So, in scenarios where your data might be skewed or have outliers, like our Comedian example, IQR/Median can be a more reliable measure of variability. It’s like choosing a playlist that perfectly matches your mood over hitting shuffle and hoping for the best.
And that’s why, in this case, IQR/Median could be a better go-to than CV. It’s like upgrading from a good smartphone to the latest model—you get better features, better reliability, and a better overall experience.
The Median Absolute Deviation/Median Duo
Next up, let’s talk about the Median Absolute Deviation divided by the Median, or as I like to call it, the Spotify playlist that understands your mood. Why a Spotify playlist? Because just like how the right playlist can perfectly capture your feelings, this measure captures the essence of your data.
What It Is and Why It’s Like the Spotify Playlist That Understands Your Mood
The Median Absolute Deviation (MAD) is another robust measure of data dispersion. It calculates the median of the absolute differences between each data point and the overall median. When you divide it by the Median, you get a measure that’s not easily swayed by outliers or skewed data. It’s like having a Spotify playlist that always knows what you want to listen to, no matter your mood. 🎧
Calculations Using the Food Bloggers and Comedians Example
Let’s go back into our Food Bloggers and Comedians example to see how this works.
Let’s first understand what “deviation” means in this context. Deviation here refers to how far each data point (x) is from the median. It’s calculated as ( x – median). The “absolute deviation” is simply the absolute value of this deviation, which means it’s always positive. This helps us understand how “spread out” the data points are from the median.
Here’s the table:
| Food Bloggers (in million views) | Deviation (x-median) | Absolute Deviation | Comedians (in million views) | Deviation (x-median) | Absolute Deviation |
|---|---|---|---|---|---|
| 1.5 | -0.15 | 0.15 | 2 | -0.85 | 0.85 |
| 2 | 0.35 | 0.35 | 1.9 | -0.95 | 0.95 |
| 1.9 | 0.25 | 0.25 | 7.9 | 5.05 | 5.05 |
| 1.7 | 0.05 | 0.05 | 4.9 | 2.05 | 2.05 |
| 2.1 | 0.45 | 0.45 | 2.9 | 0.05 | 0.05 |
| 2.3 | 0.65 | 0.65 | 0.6 | -2.25 | 2.25 |
| 0.3 | -1.35 | 1.35 | 9.8 | 6.95 | 6.95 |
| 0.6 | -1.05 | 1.05 | 1.6 | -1.25 | 1.25 |
| 1.6 | -0.05 | 0.05 | 2.8 | -0.05 | 0.05 |
| 1.4 | -0.25 | 0.25 | 6.5 | 3.65 | 3.65 |
To find the Median Absolute Deviation (MAD), we’ll first sort the absolute deviations in ascending order and then find the median of those sorted values.
Food Bloggers
Sorted Absolute Deviations: 0.05, 0.05, 0.15, 0.25, 0.25, 0.35, 0.45, 0.65, 1.05, 1.35
Median of Absolute Deviations (MAD): (0.25 + 0.25) / 2 = 0.25 million views
Comedians
Sorted Absolute Deviations: 0.05, 0.05, 0.85, 0.95, 0.95, 1.25, 2.05, 2.25, 3.65, 5.05, 6.95
Median of Absolute Deviations (MAD): 0.95 million views
So, the MAD for Food Bloggers is 0.25 million views, and for Comedians, it’s 0.95 million views. This gives us another robust measure of variability for each group.
To find MAD/Median, we simply divide the Median Absolute Deviation (MAD) by the median of the data set and then multiply by 100 to get it as a percentage. This gives us a relative measure of the dispersion in the data.
Food Bloggers
MAD/Median: (0.25 / 1.65) x 100 = 15.15%
Comedians
MAD/Median: (0.95 / 2.85) x 100 = 33.33%
So, the MAD/Median for Food Bloggers is 15.15%, indicating a relatively low level of variability around the median. For Comedians, it’s 33.33%, showing a higher level of variability around the median.
As you can see, the MAD/Median for Food Bloggers is 15.15%, indicating even less variability than the IQR/Median measure. For Comedians, it’s 33.33%, which is also lower than the IQR/Median measure but still indicates more variability. It’s like having a playlist that’s a mix of your favorite chill songs and some unexpected bangers.
So, are you ready to add this MAD/Median duo to your data analysis toolkit, or would you like to see more examples?
Why Opt for MAD/Median Over CV?
So you might be wondering, “Why should I even consider MAD/Median when CV has been the classic go-to?” Well, let’s get into it.
In our Food Bloggers and Comedians example, the CV for Food Bloggers was 39.28% and for Comedians, it was a whopping 70.44%. While these percentages do tell us something about variability, they’re not the full picture. Here’s why:
- Outliers: CV is sensitive to outliers. Remember that comedian with 9.8 million views? That’s an outlier and it skews the CV, making it look like comedians are super variable in their popularity. But is that the case for most comedians? Not really.
- Skewed Data: CV can be misleading when the data is skewed. In the case of comedians, the data is not evenly distributed, and CV might give you a distorted view of the variability.
On the other hand, the MAD/Median for Food Bloggers was 15.15% and for Comedians, it was 33.33%. These percentages are less influenced by outliers and provide a more “honest” view of the data’s variability.
So, in scenarios where your data might have outliers or is skewed, like our Comedian example, MAD/Median can be a more reliable measure. It’s like choosing a playlist that perfectly matches your mood over hitting shuffle and hoping for the best.
And that’s why, in this case, MAD/Median could be your new best friend in data analysis. It’s like upgrading from a good smartphone to the latest model—you get better features, better reliability, and a better overall experience.
The Newbies vs The Veteran
Ready for a stats showdown? Let’s pit the veteran, Coefficient of Variation (CV), against its modern alternatives, Interquartile Range/Median (IQR/Median) and Median Absolute Deviation/Median (MAD/Median). Who will come out on top? Let’s find out!
| Measure | Food Bloggers (%) | Comedians (%) | Best For | Worst For | Sensitivity to Outliers |
|---|---|---|---|---|---|
| Coefficient of Variation (CV) | 39.28 | 70.44 | Normally distributed data | Skewed data or outliers | High |
| Interquartile Range/Median (IQR/Median) | 24.24 | 42.11 | Skewed data | Normally distributed data | Low |
| Median Absolute Deviation/Median (MAD/Median) | 15.15 | 33.33 | Skewed data and outliers | Normally distributed data | Very Low |
Key Takeaways
- Coefficient of Variation (CV): The old-school method that’s great for normally distributed data but can get tripped up by outliers or skewed data.
- Interquartile Range/Median (IQR/Median): The modern method that’s less sensitive to outliers and works well for skewed data, but may not be the best for normally distributed data.
- Median Absolute Deviation/Median (MAD/Median): The new kid on the block that’s robust against both outliers and skewed data, making it the most “honest” measure of the three.
So, which measure is the champ for you? The answer depends on your data and what you’re looking to find out. But now you’ve got more tools in your data analysis toolbox, and that’s always a win!
Coefficient of Variation vs IQR/Median vs MAD/Median
Now lets compare and contrast the three measures—Coefficient of Variation (CV), Interquartile Range/Median (IQR/Median), and Median Absolute Deviation/Median (MAD/Median)—along with their positives and negatives.
| Measure | Positives | Negatives |
|---|---|---|
| Coefficient of Variation (CV) | – Widely used and understood – Good for comparing variability across different units | – Sensitive to outliers – Can be misleading for skewed data |
| Interquartile Range/Median (IQR/Median) | – Less sensitive to outliers compared to CV – Good for skewed data | – Not as widely understood as CV – May require more computation |
| Median Absolute Deviation/Median (MAD/Median) | – Robust against outliers – Excellent for skewed data – Provides a “honest” view of variability | – Least known among the three – May require more computation |
This table should give you a quick overview of when to use each measure and what to watch out for. Each has its own strengths and weaknesses, so the best one to use depends on your specific data and what you’re looking to understand.
How to Pick Your Data Hero
So you’ve met the contenders in the stats showdown, but how do you pick the right one for your data adventure? Let’s break down some technical terms like influence functions, biases, and variances using Marvel analogies, because who doesn’t love superheroes?
Influence Functions: The Spider-Sense
Influence functions are like Spider-Man’s spider-sense. They help you detect how sensitive a statistical measure is to changes in the data. Just like Spidey can sense danger, influence functions can tell you if a single data point (or outlier) is going to mess up your stats.
- CV: Like Iron Man without his suit, it’s vulnerable to outliers.
- IQR/Median: More like Captain America’s shield, it offers better protection against outliers.
- MAD/Median: Think of it as Doctor Strange’s time stone; it’s robust and can handle all sorts of data quirks.
Biases: The Loki Effect
Biases are the statistical equivalent of Loki’s illusions. They can deceive you into thinking something is true when it’s not.
- CV: Can be biased in the presence of outliers, making you think there’s more variability than there actually is.
- IQR/Median: Less biased, but not entirely immune. It’s like Thor; strong but not invincible.
- MAD/Median: The least biased of the bunch, akin to Vision, who’s programmed to be as unbiased as possible.
Variances: The Hulk Factor
Variance measures how “spread out” the data is. In the Marvel universe, think of it as how unpredictable the Hulk can be.
- CV: High variance means it can swing wildly with outliers, just like how Bruce Banner can suddenly turn into the Hulk.
- IQR/Median: More stable, but still has some variance. Think of it as Spider-Man; agile but still human.
- MAD/Median: The most stable, like Black Widow. No superpowers, but highly trained and reliable.
The Final Pick
So, who’s your data hero?
- If your data is clean and well-behaved, CV could be your Iron Man.
- If you’re dealing with some outliers or skewed data, IQR/Median is your Captain America.
- And if you want the most robust and reliable measure, MAD/Median is your Doctor Strange.
Choose wisely!
Real-World Cheat Codes: Practical Applications
So you’ve got your data heroes picked out, but how do you use them in the real world? Let’s talk about how these data measures can be your cheat codes for everything from binge-watching Netflix to crypto investing.
Picking a Netflix Show
Ever spent more time scrolling through Netflix than actually watching something? Use the CV to measure the variability in ratings of episodes in a series. A lower CV means the show is consistently good, while a high CV means it’s hit or miss. It’s like having your own Rotten Tomatoes but personalized!
Investing in Crypto
Crypto is all the rage, but it’s also super volatile. Use MAD/Median to assess the risk level of different cryptocurrencies. A lower MAD/Median means the crypto is relatively stable, while a higher one means it’s more volatile. It’s like having a Spidey-sense for your investments!
Choosing a College Major
Can’t decide between Computer Science and Art History? Use IQR/Median to measure the variability in starting salaries for each major. A smaller IQR/Median means more consistent earnings, while a larger one means there’s a wider range. It’s like having a crystal ball for your future!
Planning a Vacation
Want to pick the best month to visit Hawaii? Use CV to analyze the average monthly temperatures or rainfall. A lower CV means the weather is more consistent, making it a safer bet for your dream vacation.
Online Shopping
Ever get overwhelmed with too many choices when shopping online? Use MAD/Median to measure the variability in customer reviews for different products. A lower MAD/Median means the product is generally well-received, while a higher one indicates mixed reviews.
Fitness Goals
Trying to improve your mile time or lose weight? Use IQR/Median to track your progress over time. A decreasing IQR/Median means you’re becoming more consistent, which is usually a sign of improvement!
So there you have it! Whether you’re picking a show, investing in crypto, or even choosing a college major, these data measures can be your real-world cheat codes.
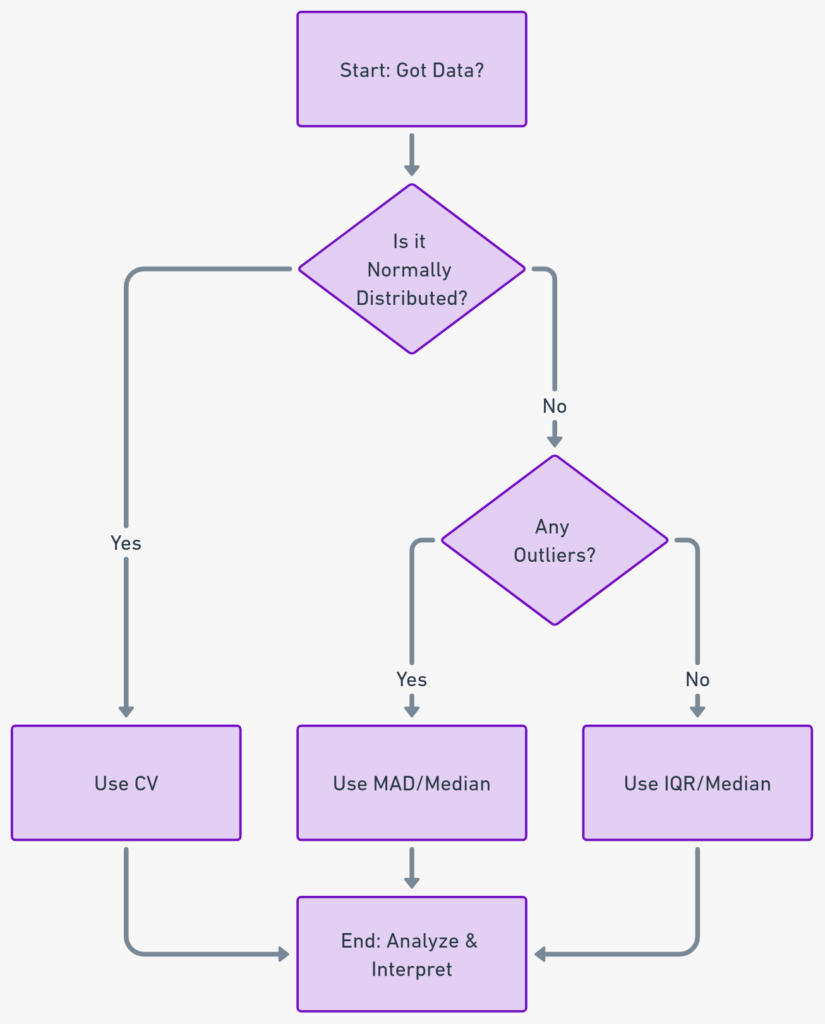
Flowchart: Your Personal Data Guide
Here’s a flowchart to help you decide which measure to use based on your specific needs. It’s like having a GPS for your data journey!