
What to choose for data analysis – R vs Stata – Beginners guide 2026
Are you confused between R vs. Stata – Which one to choose? 100% your confusion will be gone today!
What to Choose for Data Analysis R vs Stata Beginner Guide 2026
Two tools. Two different ways of working. One decision that can shape how you start your data analysis career. This guide helps you choose clearly.
Many beginners search for R vs Stata and get confused. Most articles are either too technical or too general. This guide keeps things simple.
R and Stata are not direct competitors. They were created for different types of work. Many professionals use both. If you can start with only one, this comparison will help you decide.
R vs Stata at a Glance
This section gives a quick overview. Use the toggle to see how each tool feels if you are a beginner or if you are switching careers.
-
CostCompletely free. You can download and start without paying anything.
-
Time to first projectUsually takes about 3 to 4 weeks before you can do a small project on your own.
-
Community sizeVery large community. Thousands of packages and tutorials are available online.
-
Where it leadsUsed in startups, tech companies, and data science teams. Offers wide career options.
-
Transition speedWith regular practice, many people become job ready within 4 to 6 months.
-
Salary jump potentialEntry level roles in tech often pay well. Salary growth improves with experience.
-
Portfolio valueProjects shared on GitHub show practical skills. This helps during tech interviews.
-
Risk levelLow risk choice. Free to learn and widely accepted in analytics and tech roles.
-
CostPaid software. Many universities give free access to students.
-
Time to first projectFaster start than R. Many beginners do basic analysis within 1 to 2 weeks.
-
Community sizeSmaller than R but more focused. Strong support in academics and research.
-
Where it leadsCommon in government, healthcare, academia, and policy roles where audit checks matter.
-
Transition speedIf you know basic statistics, you can become comfortable within 2 to 3 weeks of focused practice.
-
Salary positioningGood pay in research roles. Your domain knowledge matters more than just the tool.
-
Portfolio valueDo files and written research reports help a lot. Reproducible work is valued in these roles.
-
Risk levelLow risk within its field. If you target regulated research work, Stata fits well.
What R Actually Does Well
R is more than a statistics tool. It is a complete platform for working with data. This section explains where R truly performs better.
Many comparisons between R and Stata stay very shallow. People talk about syntax or package count. That misses the real point. R is strong because it supports the full data workflow. You can collect data, clean it, analyse it, and present results using one tool. The learning takes time at the start. But the long term flexibility is much higher.
Where R Stands Out
What Stata Actually Does Well
Stata is trusted by economists, researchers, and policy teams. It focuses on accuracy and structured analysis.
Stata is often misunderstood as old or limited. That is not true. It is designed for serious research work. The software is tested carefully and updated regularly. Stata may not cover every data task. But where it is strong, it performs extremely well.
Where Stata Stands Out
Industry by Industry, Which Tool Wins?
The best tool depends on your industry. Check where you plan to work and learn that tool first.
This is not only a technical choice. It is a work choice. Teams use tools they trust and reviewers expect a certain format. So your industry matters more than syntax. Tap a card to see which tool usually fits that sector.
Tap a sector to expand
How Much Does Each Tool Actually Pay?
The tool on your CV changes what employers are willing to pay. Here is where the money actually lands across five common benchmarks.
Salary Benchmarks (USD, Annual)
Skill Premiums That Pay Extra
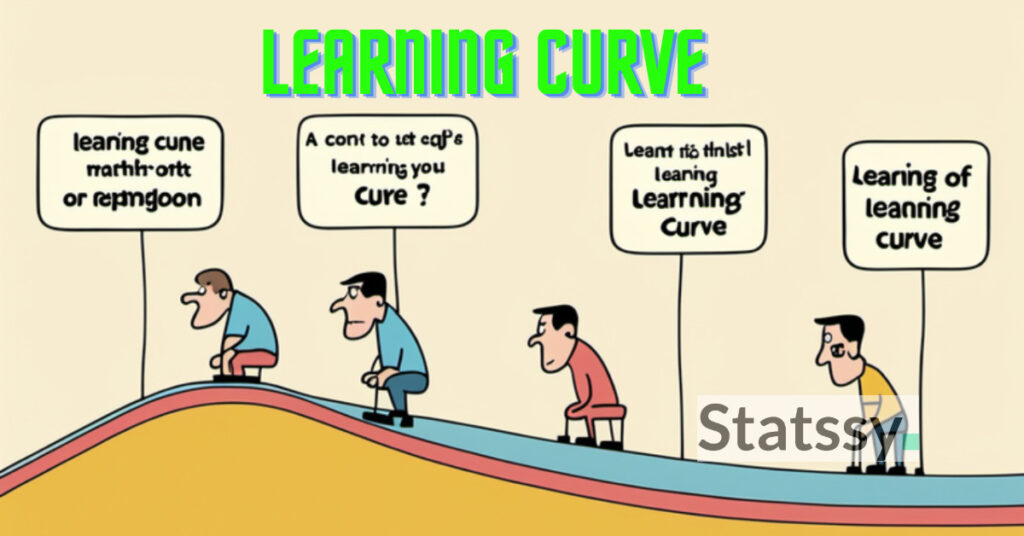
The Learning Curve Reality
Stata gets you to your first result faster. R takes longer to click but opens more doors down the road. Here is what that actually looks like in practice.
AI and the Future
Both tools are moving toward AI, but at very different speeds and in very different directions. Here is where each one is heading.
The Real Answer Is Learn Both
There is no single winner. The smartest move depends on where you are in your career right now.
Where to Start Learning
Pick your path. Each one takes you from zero to productive.
FAQ
Questions People Actually Ask
Struggling with syntax?
If you’re not ready to write code yet, you can still perform professional analysis.
Hypothesis Test
Use One-Sample T-Test Calculator.
Regression
Try Simple Linear Regression Tool.
More Statistics
Master the Math Before the Code.
Understanding R and Stata
What Are R and Stata?
- R: A free, open-source programming language specifically designed for statistical computing, data analysis, and visualization. Popular among data scientists and statisticians, R offers a wide range of packages and flexibility for complex analyses.
- Stata: A paid statistical software that excels in econometrics, research, and academia. It’s user-friendly with a straightforward command-line interface, making it easier to learn for beginners.
Comparison by Industry
- R: Widely utilized in data science, machine learning industries, financial services for risk management, healthcare for clinical trials, and more¹.
- Stata: Highly regarded in the social sciences, especially in economics, healthcare for health services research, finance for econometrics, and public policy².
To explore more about using R for specific tasks like calculating the coefficient of variation, you can find a detailed tutorial here, or if you’re interested in mastering descriptive statistics in Stata, we have a beginner’s guide.
Need help with R/Stata?
Connect on Whatsapp
Comparison by Job Profile
- R: Primarily used by data scientists, machine learning engineers, statisticians, and big tech companies like Google for advertisements effectiveness, economic forecasting, and more¹.
- Stata: Mostly used by statisticians, economists, and social scientists.
Stata Usage
According to enlyft.com, Stata has a significant presence in various industries:
- Usage: Found in 1,007 companies, mostly in the United States and Higher Education industry.
- Market Share: In the Analytics category, Stata has a market share of about 0.4%.
- Users: Predominantly in the United States (57%), Italy (13%), and the United Kingdom.
- Users by Industry: Higher Education (33%), Hospital & Health Care (6%), Research (6%).
- Users by Company Size: Large (>1000 employees) 60%, small (<50 employees) 14%, medium-sized 24%.
- Users by Revenue: Small (<$50M) 41%, medium-sized 8%, large (>$1000M) 43%.
Comparison by Learning Curve
- R: Known for its steeper learning curve but offers more power and adaptability.
- Stata: More application-driven and easier to learn.
If you are a beginner, it might be helpful to explore our tutorials on calculating the coefficient of variation in Stata or mastering the use of the dollar sign operator in R.
The Debate: R vs Stata – Which One is Better for Data Science?
This question often sparks a debate, and some even say, “Folks, the R vs Stata discussion is boring and stupid. Use what works best for you.” But as a beginner, the choice can be overwhelming.
To further understand the intricacies of both R and Stata, let’s delve into the following aspects:
- Salary Comparison: The average salary for a data scientist with R skills is $96,000 per year, while the average salary for a statistician with Stata skills is $73,000 per year.
- Job Market Insights: Both R and Stata are in high demand, reflecting the growth of data science and statistics fields.
- Tool Efficiency: R provides more flexibility, whereas Stata is more user-friendly for simple analyses.
Comparison by Industry, Job Profile, and Learning Curve

R vs Stata in Different Industries
When it comes to industry preference, both R and Stata hold significant places, but in varying fields. Let’s dig into the industry-specific uses:
- R:
- Data Science and Machine Learning: R is a favorite in data science due to its robustness in statistical modeling and machine learning. Whether you’re in fintech, retail, or government sectors, R can provide powerful solutions¹[1].
- Healthcare: Clinical trials and epidemiology have seen R as a key player for statistical analysis.
- Manufacturing and More: Explore how R is being used across various industries in our R programming tutorials.
- Stata:
- Social Sciences and Economics: Stata is a staple in these fields and has proven its worth in policy analysis and econometrics.
- Healthcare and Finance: Whether it’s health services research or financial analysis, Stata is up to the task. Learn more in our Stata tutorial section.
- Public Policy: Policymakers often turn to Stata for insights into the effectiveness of various programs.
Comparison by Job Profile
Different job roles often require different tools. Here’s how R and Stata align with various profiles:
- R:
- Data Scientists: Highly valued for complex data manipulation and predictive modeling.
- Machine Learning Engineers: Check our machine learning tutorials to see how R can be a vital part of this field.
- Statisticians: R is the go-to language for many statisticians.
- Stata:
- Economists: With its stronghold in economics, Stata is a must-know tool.
- Statisticians and Social Scientists: Stata’s ease of use makes it an appealing option.
Learning Curve: R vs Stata
The journey of learning these tools can differ significantly:
- R’s Steeper Learning Curve:
- R offers great power and adaptability but requires more time to master. But don’t worry! Our comprehensive guide to using R can make the process more enjoyable.
- Stata’s User-Friendly Nature:
- More application-driven and easier to learn, Stata lets statisticians get started quickly. Start with our beginner’s guide to Stata.
“Choosing between R and Stata is not just about picking one over the other; it’s about understanding the specific requirements of your role and industry. Both have their unique strengths and are best suited for particular domains.”
Stata: A Snapshot of Market Usage
According to Enlyft, here’s a snapshot of Stata’s market presence:
- Stata Usage: Primarily found in the United States (57%) and notably in Higher Education and Healthcare⁴[4].
- Market Share: Stata holds about 0.4% of the market in the Analytics category³[3].
- Users by Revenue and Size: Large companies and those with significant revenue often choose Stata as their statistical software⁶[6].
Would you like to see how Stata is used in calculating variations in business? Check our tutorial on calculating the coefficient of variation in Stata.
Salaries, Job Market, and Tool Efficiency

Salaries: R vs Stata Professionals
In the competitive world of data analytics, understanding the salary landscape for professionals with expertise in R or Stata can help in career planning. Here’s a breakdown:
- R Professionals:
- Data Scientists: In the US, the median salary is around $96,000 per year.
- Statisticians: Earning a median salary of approximately $89,000 per year.
- Machine Learning Engineers: Generally, the median salary falls in the range of $112,000 per year²[2].
- Entry-Level Positions: Entry-level roles with R expertise tend to start around $60,000 per year¹[1].
- Stata Professionals:
- Economists: On average, Stata-skilled economists earn about $105,000 per year.
- Statisticians and Social Scientists: Median salaries fall around $78,000 annually.
- Research Analysts in Public Policy: Salaries range from $65,000 to $85,000 per year.
Job Market: Opportunities and Trends
The job market is constantly evolving, and the demand for R and Stata professionals reflects the broader trends in data analytics and statistical modeling.
- R’s Dominance:
- Emerging Opportunities: The rise in machine learning, AI, and data science has led to a surge in R-related jobs.
- Versatility: R’s adaptability across industries enhances its job market appeal.
- Top Companies Hiring: Major companies like Google, Amazon, and Facebook are continually looking for R experts.
- Stata’s Niche:
- Focused Market: Stata’s specialized usage in economics, healthcare, and public policy translates to specific job opportunities.
- Academic and Research Roles: Universities, think tanks, and research organizations often prefer Stata.
Tool Efficiency: Productivity and Performance
The efficiency of a tool in completing tasks and optimizing workflows is essential. Here’s a comparison:
- R:
- Highly Flexible: R’s package ecosystem and functional programming make it highly adaptable.
- Scalability: R has been improving in handling large data sets, though some challenges remain.
- Integration: R’s ability to integrate with other tools and languages such as Python and SQL is a plus.
- Stata:
- Ease of Use: Stata’s GUI makes it user-friendly, ideal for non-programmers.
- Performance in Specific Tasks: Stata excels in linear regression, time-series analysis, and other specialized tasks.
- Limitations: Stata may not be as versatile as R in handling varied data manipulation and analysis tasks.
Community Support and Documentation : (data analysis – R vs Stata)
The support and resource availability is important when selecting a tool.
- R’s Rich Ecosystem:
- Vibrant Community: The R community is active, with numerous forums, conferences, and user groups.
- Extensive Documentation: From CRAN to R-bloggers, resources abound.
- Open-Source Advantage: R’s open-source nature encourages collaboration and development.
- Stata’s Specialized Support:
- Dedicated Forums: Stata’s forums and user groups are more focused on specific domains.
- Quality Documentation: Stata’s official documentation and support are highly regarded, especially in academic circles.
Case Studies and Expert Opinions
Case Studies: R and Stata in Action
Both R and Stata have their strengths, and this can be illustrated through specific case studies. Below, you’ll find real-world examples that showcase the use of these tools in different scenarios:
- R in Health Research:
- Problem: A prominent health organization sought to analyze the impact of lifestyle choices on chronic diseases.
- Solution: Using R’s advanced statistical libraries, they conducted comprehensive analysis, predictive modeling, and data visualization.
- Outcome: The results led to targeted interventions and public awareness campaigns, directly influencing healthcare policies.
- Stata in Economic Analysis:
- Problem: An international bank needed to conduct economic forecasting and risk assessment for various countries.
- Solution: With Stata’s powerful time-series analysis capabilities, they were able to model economic trends and uncertainties.
- Outcome: The insights guided investment strategies and informed government policies, demonstrating Stata’s value in the financial sector.
- R in Retail Analytics:
- Problem: A leading retailer wanted to optimize its supply chain and predict customer preferences.
- Solution: Utilizing R’s machine learning packages, they were able to build predictive models for demand forecasting and inventory management.
- Outcome: The retailer achieved higher efficiency, reduced costs, and enhanced customer satisfaction.
- Stata in Educational Research:
- Problem: An educational institute aimed to understand the effectiveness of different teaching methodologies.
- Solution: Stata’s user-friendly interface and specialized statistical tests enabled detailed analysis of academic performance.
- Outcome: The research informed curriculum development, demonstrating Stata’s utility in educational research.
Expert Opinions: Voices from the Field
It’s essential to hear from those who have hands-on experience with these tools. Here are insights from experts across different domains:
- Data Scientist (R Enthusiast): “R’s thriving community and vast package ecosystem have allowed us to innovate and adapt quickly. Its open-source nature facilitates collaboration.”
- Economist (Stata User): “Stata’s targeted functionalities have proven invaluable in our work. Its consistency and performance in economic modeling are unmatched.”
- Bioinformatician (R Specialist): “R’s flexibility and integration capabilities enable us to work across platforms and disciplines. It’s at the core of our data analysis workflow.”
- Policy Analyst (Stata Advocate): “We rely on Stata for robust analysis in social sciences. Its specialized support and tutorials have been instrumental in our research.”
Choosing the Right Tool: A Guided Approach
Given the varied applications and user testimonials, how do organizations and individuals choose between R and Stata?
- Understand the Specific Needs: Assessing the project requirements, industry alignment, and specialized tasks can guide the selection.
- Consider the Learning Curve: R’s coding-oriented approach may suit some, while Stata’s user-friendly GUI might appeal to others.
- Evaluate Community and Support: Exploring the availability of community support, tutorials, and documentation is vital.
- Reflect on Budget Constraints: While R is open-source, Stata comes with licensing costs. The financial aspect must be considered.
Conclusion: Looking Ahead
In the battle between R and Stata, there’s no definitive winner. Both these software packages offer a broad spectrum of capabilities that cater to various needs in the world of data analysis. This article has explored their similarities, differences, strengths, and real-world applications.
Summary: Key Takeaways
- R’s Strengths:
- Versatile and open-source, suitable for various industries.
- A strong community with an extensive array of packages.
- Ideal for advanced statistical modeling and machine learning.
- Stata’s Strengths:
- User-friendly, particularly for those new to programming.
- Specialized in social sciences, economics, and policy analysis.
- Consistent, well-supported, with excellent documentation.
- Common Ground:
- Both tools are reputable, with solid history and support.
- Cater to professionals and scholars in diverse fields.
- Allow customization and extensions according to needs.
Future Trends and Developments
- R: Continual growth in the community, further integration with other languages, and expansion into emerging fields like artificial intelligence.
- Stata: Enhanced user interface, collaboration with other tools, and expanding its suite of specialized functionalities for niche areas.
Final Thoughts
Choosing between R and Stata is a matter of understanding the specific requirements of your project, your budget constraints, and your comfort with coding versus a more GUI-oriented approach.
- If innovation, versatility, and coding appeal to you, R may be your choice.
- If you seek a more structured, user-friendly interface with robust support, Stata could be your go-to solution.
Investing time in both, exploring community forums, and considering trial versions can provide a hands-on perspective. Either way, staying updated with the latest trends and continually improving your skills in data analysis will set you on the path to success.
Thank you for joining us on this deep dive into R and Stata. We hope this comprehensive guide has provided you with the insights needed to make an informed decision. For more analysis, reviews, and expert opinions, continue to follow Statssy.com. Feel free to reach out with questions, comments, or to share your experiences with these powerful tools. Happy analyzing!