
What is the Difference between Mean vs Median A No-Brainer Guide on Median vs Mean

Hey, there peeps! Welcome to Statssy!
Ever found yourself scratching your head over terms like “mean” and “median”? You’re not alone! Whether you’re crunching numbers for a school project, analyzing your favourite YouTuber’s stats, or just trying to make sense of the world, knowing the difference between mean and median can be a game-changer.
So, what’s the big deal about mean vs median? Well, both are ways to find the “centre” of a set of numbers, but they do it in totally different styles. Think of it like choosing between Instagram and TikTok—both are social media platforms, but each has its own vibe, right?
In this no-brainer guide, we’re gonna break down the ultimate showdown between mean and median. We’ll cover what they are when to use them, and why one might be a better fit for your data than the other. Plus, we’ll throw in some real-world examples and interactive tools to keep things spicy!
So, buckle up, because we’re about to take you on a wild ride through the fascinating world of mean and median!
What is Median vs Mean? Guide to Central Tendency
Hey fam, welcome to the party! Before we discuss this epic showdown between median vs mean, let’s get some basics out of the way. Ever wondered what people mean when they talk about the “average” score of a game or the “middle” value of a list of numbers? Well, that’s where the concepts of mean and median come into play.
What’s the Buzz About Mean and Median?
In simple terms, both mean and median are measures of central tendency. That’s just a fancy way of saying they help us find the “centre” of a dataset. But don’t get it twisted; while they might seem similar, the mean and median are as different as Snapchat and Twitter.
Why Should You Care?
Understanding the difference between mean vs median is more than just a math thing. It’s about making sense of data in a way that’s relevant to you. Whether you’re looking at your grades, comparing smartphone prices, or even analyzing the likes on your latest TikTok video, knowing what is median vs mean can help you make better decisions.
What’s Coming Up?
In this guide, we’ll explore:
- What is mean vs median in the simplest terms
- When to use mean and when to go for median
- Real-world examples that even your grandma would understand
- And a bunch of cool interactive tools and quizzes to test your newfound knowledge!
So, are you ready to become the ultimate data wizard? Let’s get this party started!
Mean vs Median 101: Basic Definitions and Simple Examples
Alright, fam, it’s time to get down to the nitty-gritty! We’re gonna break down what mean and median are, and trust us, it’s gonna be as easy as scrolling through your Insta feed.
What is Mean? The Average Joe of Numbers Explained
So, let’s kick things off with the “mean,” often called the “average.” You’ve probably heard people say stuff like, “The average score was 80,” right? Well, that’s the mean they’re talking about!
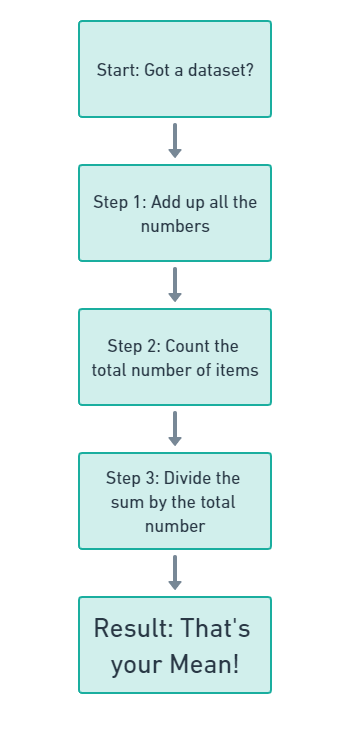
How to Calculate the Mean
To find the mean, you add up all the numbers in a dataset and then divide by the total number of items. Simple, right?
Let’s say you’ve got test scores of 70, 80, and 90. Add ’em up (70 + 80 + 90 = 240), and then divide by 3 (the number of tests). So, the mean score would be 80.
So to make things clear see the diagram below.
What is the Median? The Middle Child of Numbers Explained
Next up is the “median,” the unsung hero that often gets overshadowed by its more popular sibling, the mean.
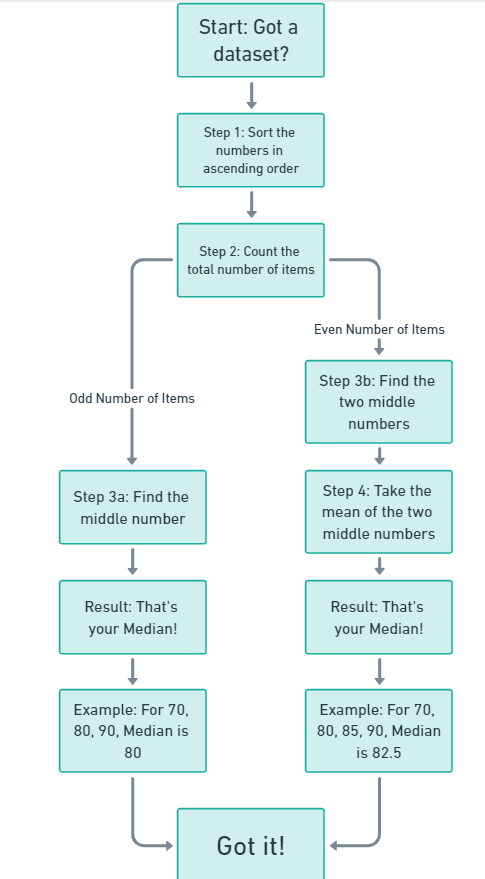
How to Find the Median
To find the median, you arrange all the numbers in your dataset from smallest to largest and pick the one smack dab in the middle. If there’s an even number of items, you take the mean of the two middle numbers.
Example: If you have test scores of 70, 80, and 90, the median is also 80 (it’s the middle score). But if you have scores of 70, 80, 85, and 90, the median would be 82.5 which is basically the mean of 80 and 85.
The median is all about finding that middle value in a distribution of numbers. It’s not the average, but it’s a type of “central” value, just like the mean. So, when people ask, “Is median average?” or “Is median the average?” you can confidently say, “Nah, they’re different!”
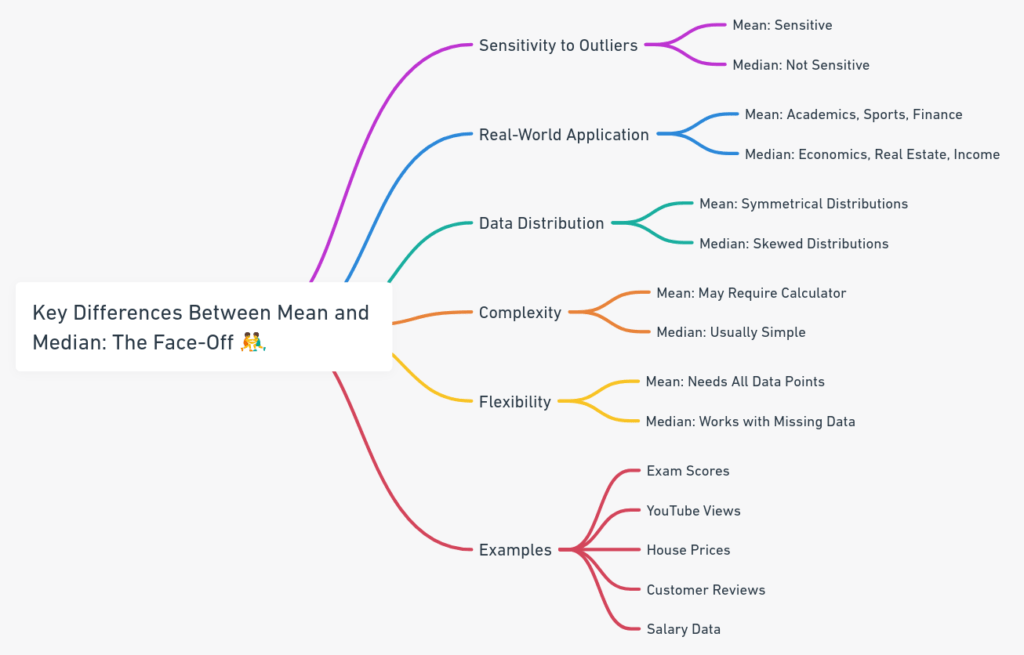
Key Differences Between Mean vs Median: The Face-Off
You’ve probably heard these terms thrown around, but what’s the real difference between median and mean? Let’s break it down in a way that’s as easy to understand as your favorite TikTok dance.
| Criteria | Mean | Median |
|---|---|---|
| Sensitivity to Outliers | The mean is like that friend who overreacts to everything. If there’s an unusually high or low number in your data (we call these “outliers”), the mean will be dramatically affected. | The median is chill and doesn’t get swayed by outliers. It stays focused on the middle value, no matter what. |
| Real-World Application | You’ll see the mean used in school grades, sports stats, and stock market averages. | The median is the star in things like housing prices, salary reports, and age demographics. |
| Data Distribution | The mean loves it when things are balanced and symmetrical. | The median is your go-to for skewed data, especially when outliers are throwing things off balance. |
| Complexity | You might need a calculator or an app if the numbers get complicated. | Most of the time, you can find the median just by looking at the sorted list. |
| Flexibility | The mean needs every single data point to give you an accurate result. | The median is more laid-back; it can still work even if some data is missing or estimated. |
Examples
- Exam Scores: Let’s say you’re in a class where everyone scored between 70 and 80 on a test, but one genius scored a 100. That 100 is what we call an “outlier”—it’s way higher than the rest. If you calculate the mean, that one high score will make it look like the class did better overall than it actually did. The median, however, would still be in the 70-80 range, giving a more accurate picture of how the class performed.
- YouTube Views: Imagine you’re a YouTuber and most of your videos get around 500-1000 views. But then, BOOM! One video goes viral and hits a million views. That million is an outlier and would make your mean views skyrocket. The median, however, would still be around 500-1000, keeping it real.
- House Prices: Picture a neighborhood where most houses cost around $300,000, but there are a couple of mansions worth $2 million. Those mansions are outliers and would make the mean house price way higher than what most houses are actually worth. The median would still be around $300,000, giving a more realistic view of the market.
- Customer Reviews: You’ve got an online store, and most of your reviews are 4 or 5 stars. But then a couple of angry customers give you 1-star reviews. Those low ratings are outliers and could drag down your mean rating. The median, however, would still show that most customers are happy.
- Salary Data: Let’s say you work at a company where most people earn around $50,000 a year, but the CEO earns $1 million. That CEO’s salary is an outlier and would make the mean salary at the company look much higher than what most people are actually earning. The median salary would still be around $50,000, offering a more down-to-earth view.
Factors to Consider: Choosing Between Median vs Mean
Alright, peeps, we’ve talked about what mean and median are, and how they’re different. But how do you know which one to use? Don’t worry, I gotchu! Here’s a breakdown of the factors you should consider when choosing between median and mean.
Data Distribution
- Mean: If your data is as balanced as a yoga instructor, the mean is your best bet. It works great when the data is evenly spread out.
- Median: If your data is more skewed than a cat video going viral, go with the median. It’s perfect for when you have outliers that could mess up your average.
Presence of Outliers
- Mean: If your data is clean and outlier-free (like a freshly washed car ), the mean will give you a solid average.
- Median: If you’ve got some wild numbers in there (like that one friend who always goes overboard at parties ), the median will keep things in check.
Purpose of Analysis
- Mean: If you’re looking to find an “average” that represents the entire dataset, the mean is your guy.
- Median: If you’re more interested in the “typical” value that most data points hover around, the median is your girl.
Types of Data
- Mean: Works best with interval and ratio data, where the difference between numbers actually means something.
- Median: Great for ordinal data, where the order matters but the difference between values doesn’t.
Real-World Context
- Mean: If you’re doing something academic or scientific, the mean is often the go-to.
- Median: If you’re looking at things like salaries, home prices, or ages, the median usually gives a more realistic picture.
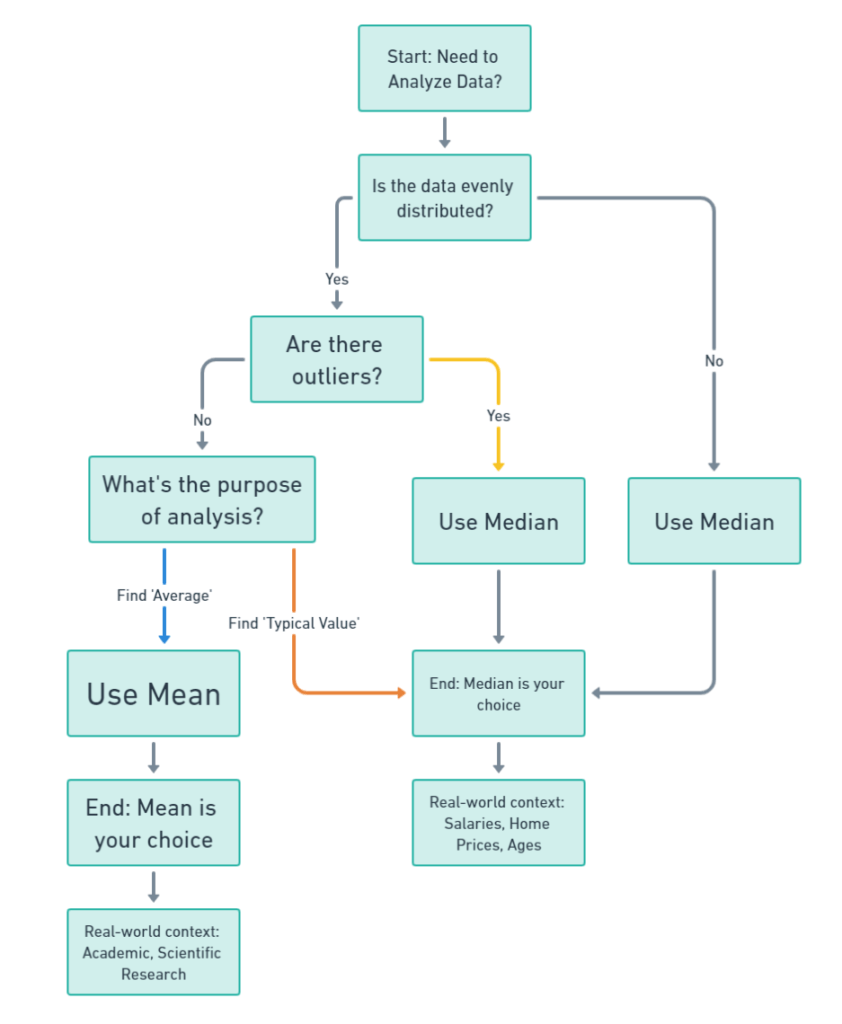
How to use this?
Start at the top where it says, “Need to Analyze Data?”—that’s your starting point. First, ask yourself if your data is evenly distributed. If it is, you’ll move down to the next question: “Are there outliers?” Outliers are those extreme values that don’t quite fit in with the rest. If you’ve got outliers, the chart guides you to use the median. If not, you’ll need to consider the purpose of your analysis. Are you looking for an “average” value that sums up your entire dataset? Go with the mean. Or are you more interested in a “typical” value that most of your data points are close to? In that case, median is your go-to.
If your data isn’t evenly distributed to begin with, the chart directly guides you to use the median. Simple as that!
At the end of each path, you’ll find the real-world contexts where mean or median is commonly used. For example, mean is often used in academic or scientific research, while median is more common for things like salaries and home prices.
So, the next time you’re scratching your head, wondering whether to use mean or median, just follow this flowchart. It’s like having a GPS for your data!
When to Use Mean: Team Mean for Symmetrical Distributions and No Outliers
Hey fam, let’s talk about Team Mean! If you’re dealing with data that’s as balanced as a seesaw, or if there’s zero drama in your numbers (read: no outliers), then mean is your MVP.
Symmetrical Distributions: When to Use Mean in Balanced Datasets
Okay, so you’ve got a dataset that’s as symmetrical as a butterfly’s wings. In other words, the numbers on the left and right sides of the middle value are pretty much the same. This is where the mean shines!
It gives you an “average” that truly represents the entire dataset. So, if you’re looking at something like test scores that are evenly distributed, the mean is your best friend.
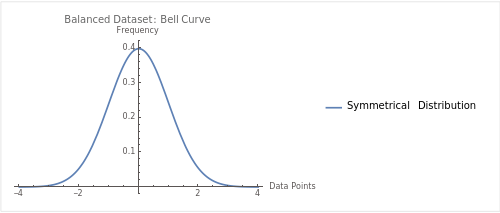
When it comes to symmetrical distributions, knowing when to use mean is key. It’s all about choosing between mean vs median when to use each in a balanced dataset.
No Drama Here : Using Mean When There Are No Outliers
No drama, no problem! If your dataset doesn’t have any outliers (those are the super high or super low numbers that don’t really fit in), then the mean is a reliable choice. It won’t get skewed by extreme values, so you get a solid, trustworthy average.
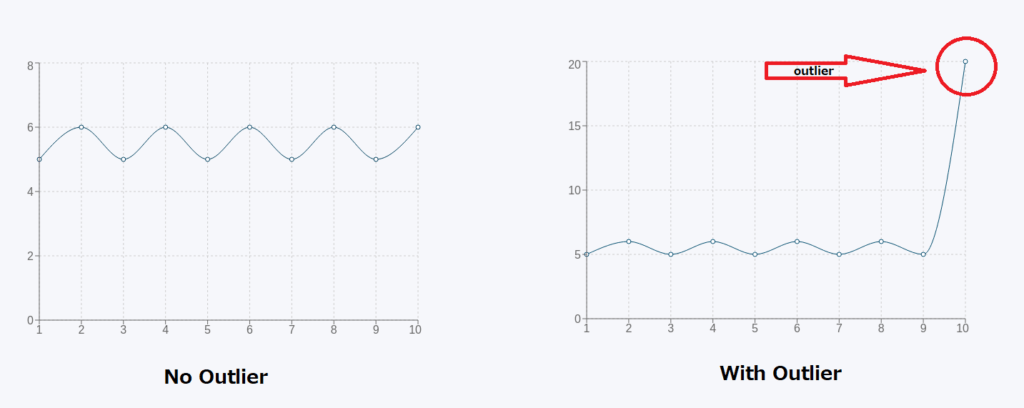
When there’s no drama in your data, knowing when to use mean is a no-brainer. It’s all about deciding when to use mean or median based on the absence of outliers.
Real-World Case: Average Salary by College Major—Why Use Mean Over Median
Let’s get real for a sec. Say you’re trying to figure out which college major pays the most. You might see articles talking about the “average salary” for different majors. In this case, “average” usually means the mean. Why? Because it takes into account all salaries, high and low, giving you a comprehensive view of what you could potentially earn.
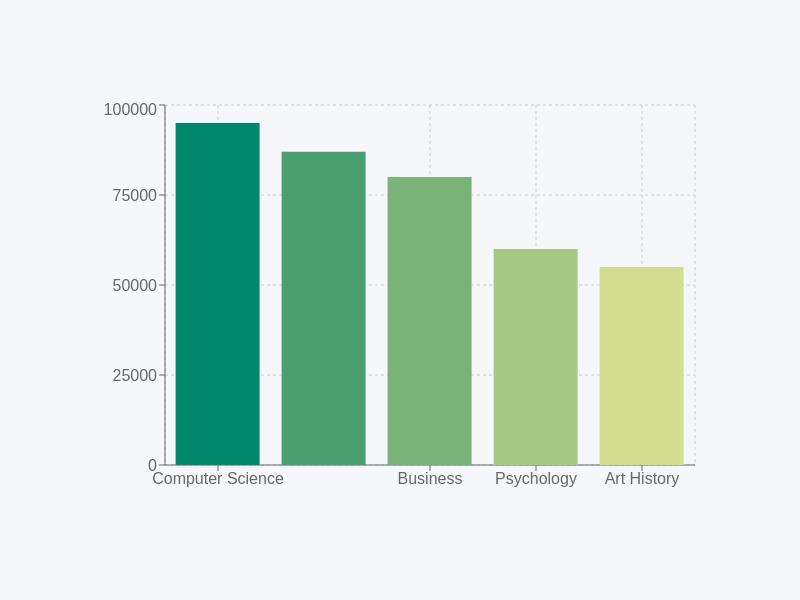
When it comes to real-world cases like average salary by college major, it’s important to understand the difference between average vs median. In this context, average versus median can make a big difference in how you interpret the data.
Further Reading
If you’re keen on diving deeper into the world of business intelligence and data science, there’s a wealth of information waiting for you in my other articles. For a hands-on guide to understanding the intricacies of simple linear regression, don’t miss this Excel tutorial on interpreting slope and intercept. To grasp how correlation impacts business decisions, you’ll find this article on the practical significance of the correlation coefficient in business particularly enlightening.
For those who prefer manual calculations, this step-by-step guide on how to calculate simple linear regression and residuals by hand is a must-read. If R is more your speed, this easy-to-follow guide to simple linear regression in R has got you covered. Python enthusiasts can learn how to create and interpret histograms, how to craft boxplots, and even how to kick off your first data analysis project.
Feel free to bookmark these resources as your go-to guides for becoming a pro in data analytics.