
I will help you create dashboard in R Shiny
- 0
- (0)
Project Details
Why Hire Me?
📱Click to Connect on Whatsapp to Discuss Your Project
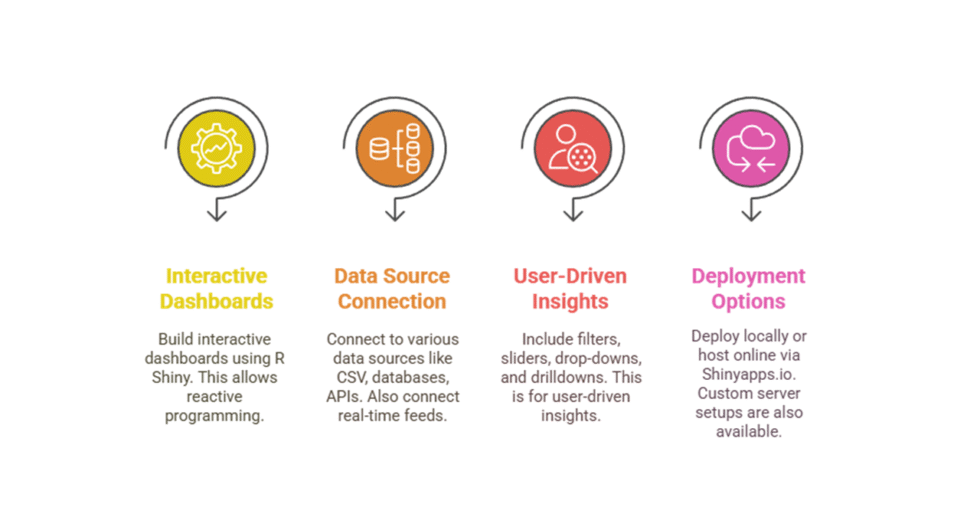
As an experienced data analyst, I specialize in building dynamic, user-centric dashboards using R Shiny, tailored to suit your business or research needs. My dashboards not only visualize data effectively but also enable users to explore, manipulate, and gain insights interactively—enhancing both usability and decision-making.
What I Offer:
-
7+ years of experience in data analytics and dashboard development
-
Fully customized dashboards using R Shiny
-
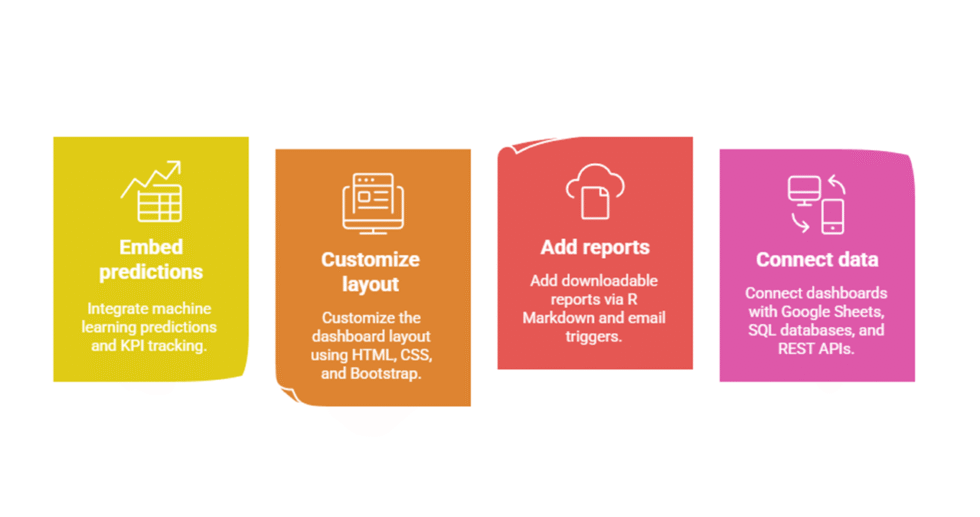
Integration with HTML, CSS, JavaScript for advanced UI/UX
-
Clean, modular code designed for long-term scalability
-
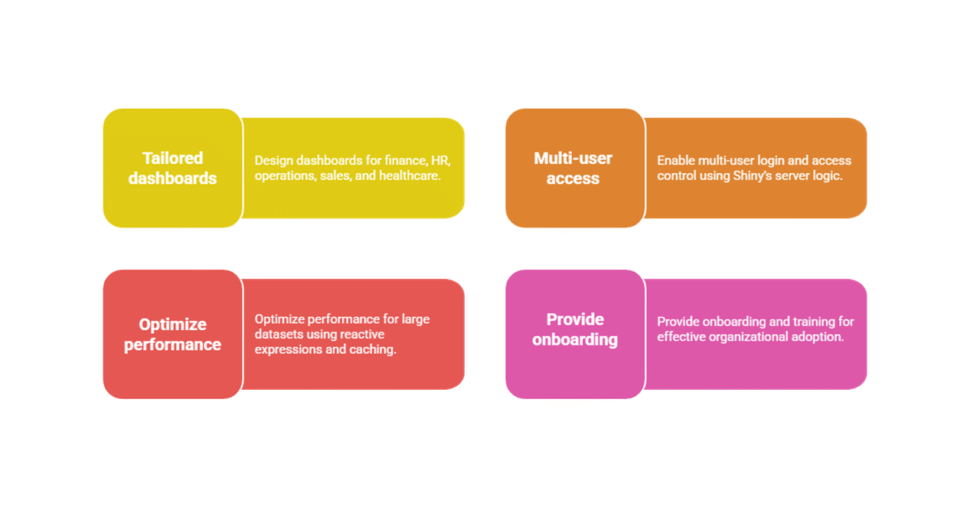
Industry-specific dashboarding (e.g., marketing, operations, healthcare)
What I Need to Start Your Project
To ensure your dashboard is functional, impactful, and aligns with your objectives, please provide the following:
1) Project Objectives
-
Description of the business problem or research goal
-
Key metrics or outcomes the dashboard should focus on
-
End-user persona: Who will use this dashboard and how?
2) Dataset Information
-
Format and source of the dataset (CSV, SQL, Excel, etc.)
-
Sample of the dataset with definitions for each column
-
Clarification on whether data cleaning is needed before use
3) Dashboard Features
-
Required interactive elements: dropdowns, sliders, date filters, etc.
-
Desired outputs: charts, tables, KPIs, predictive results
-
Preferences for layout: single-page, multi-tab, or mobile-friendly
4) Visual and Functional Preferences
-
Color themes or branding guidelines (if any)
-
Specific libraries or widgets you’d like used (e.g.,
plotly,DT,leaflet) -
Requirement for exporting visualizations or data
5) Backend Integration (Optional)
-
Need for live data connections (e.g., SQL database, API)
-
Frequency of data refreshes (real-time, daily, weekly)
-
Authentication or user access control requirements
6) Timeline and Delivery
-
Expected deadline for final delivery
-
Key milestone dates for reviews or progress updates
-
Number of revisions expected
7) Communication Setup
-
Preferred channel (Zoom, WhatsApp, Email)
-
Frequency of check-ins or reports
-
Need for walkthrough sessions or user training
8) Hosting and Deployment Preferences
-
Where do you want the dashboard to be hosted? (local, Shinyapps.io, RStudio Connect, etc.)
-
Need for assistance in deployment or post-deployment maintenance
9) Team or Stakeholder Input
-
Are there collaborators or stakeholders whose feedback must be considered?
-
Do you need handover documentation for internal teams?
10) Post-Project Support
-
Will you require ongoing maintenance or updates?
-
Would you like brief training on how to modify the dashboard later?
Portfolio
Dynamic R Shiny Dashboard for Real-Time Retail Sales Monitoring in U.S. Chain Stores
Built an interactive R Shiny dashboard for a multi-location U.S. retail chain to track sales, returns, and performance metrics in real-time. The solution streamlined reporting, improved category-wise decision-making, and reduced reporting time by over 60%.
Interactive R Shiny Dashboard for Monitoring Key Hospital Performance Metrics in the U.S. Healthcare Sector
Developed a dynamic R Shiny dashboard for a U.S. multi-specialty hospital group to track real-time operational, patient care, and compliance metrics. The dashboard replaced fragmented Excel-based workflows and enabled data-driven management at department and executive levels.
R Shiny Dashboard for E-Commerce Analytics: Real-Time Sales, Campaign Tracking & Inventory Insights
Built a real-time R Shiny dashboard for a mid-sized U.S. e-commerce brand selling lifestyle products. The dashboard enabled cross-functional visibility across sales, marketing campaigns, product inventory, and customer engagement, replacing multiple siloed tools.
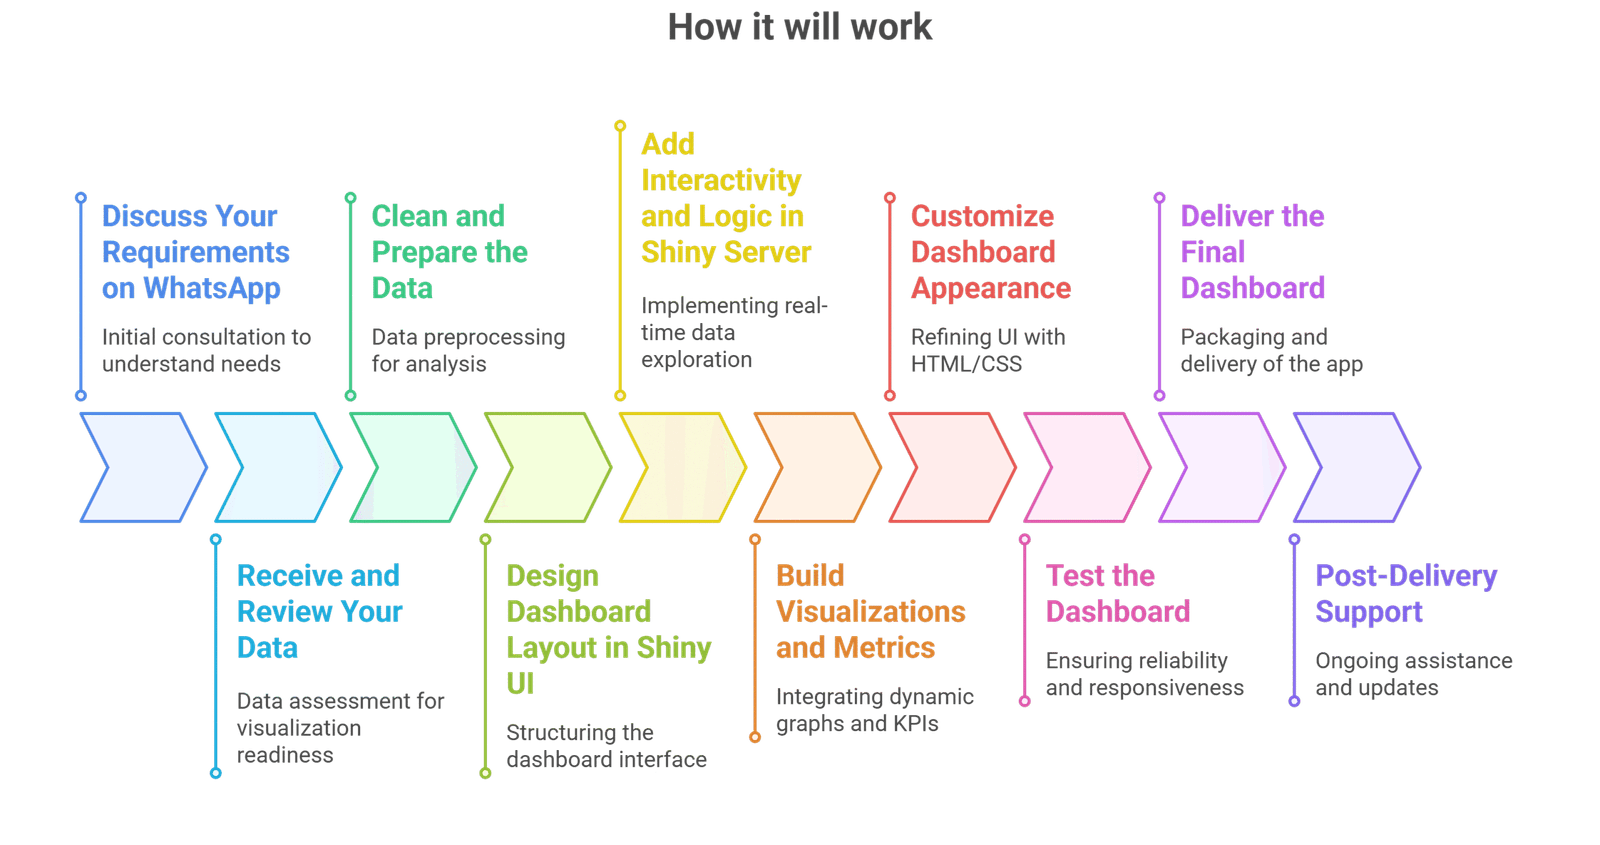
Process
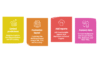
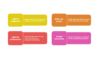
R Shiny Mini Dashboard
Starts at $55
Build a single-page dashboard with limited interactivity
-
 5
Days Delivery
5
Days Delivery
-
 1
Revision
1
Revision
R Shiny Functional Board
Starts at $95
Create multi-tab interactive dashboard
-
8
Days Delivery
-
3
Revisions
R Shiny Full Business Tool
Starts at $299
Complete end-to-end solution with reporting features
-
12
Days Delivery
-
Unlimited
Revisions


