
I can help you conduct data mining and reporting using Excel
- 3.9
- (5)
Project Details
Why Hire Me?
📱Click to Connect on Whatsapp to Discuss Your Project
I help you unlock insights from raw data using just Excel—no expensive tools, no steep learning curve. Whether you're managing sales data, survey responses, or financial records, I convert spreadsheets into intelligence. My dashboards and reports not only visualize data but tell a story you can act on.
Why I’m the Right Expert:
-
7+ years of experience in Excel analytics, reporting, and automation
-
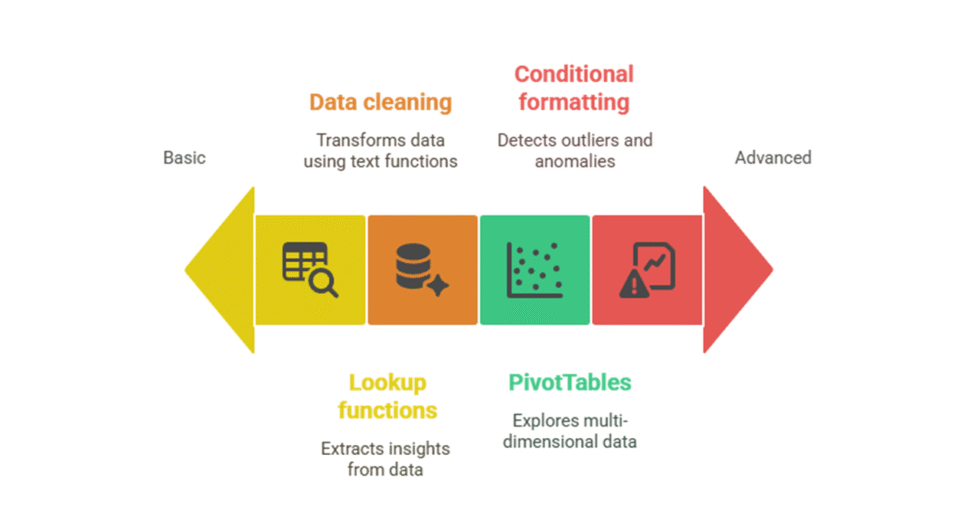
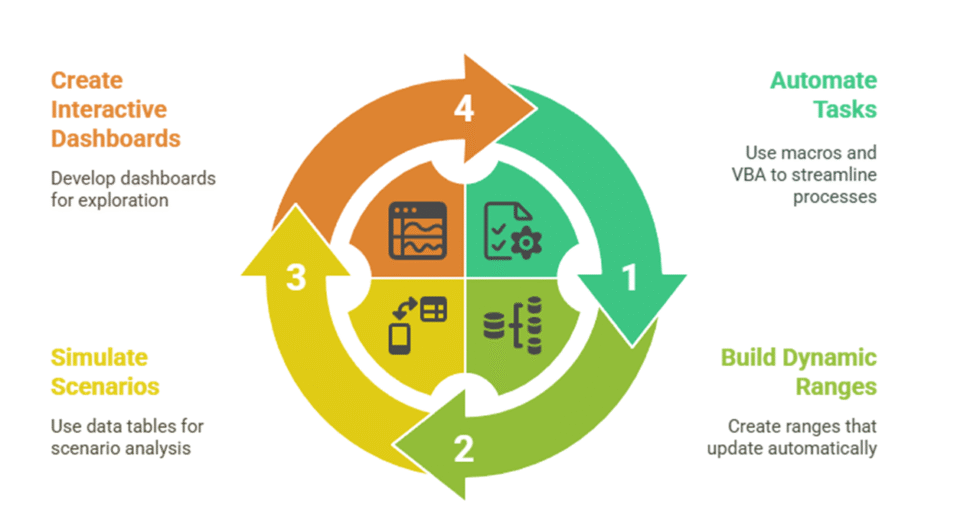
Strong grasp of advanced Excel features: Power Query, PivotTables, slicers, VBA
-
Experience across domains like marketing, finance, supply chain, and HR
-
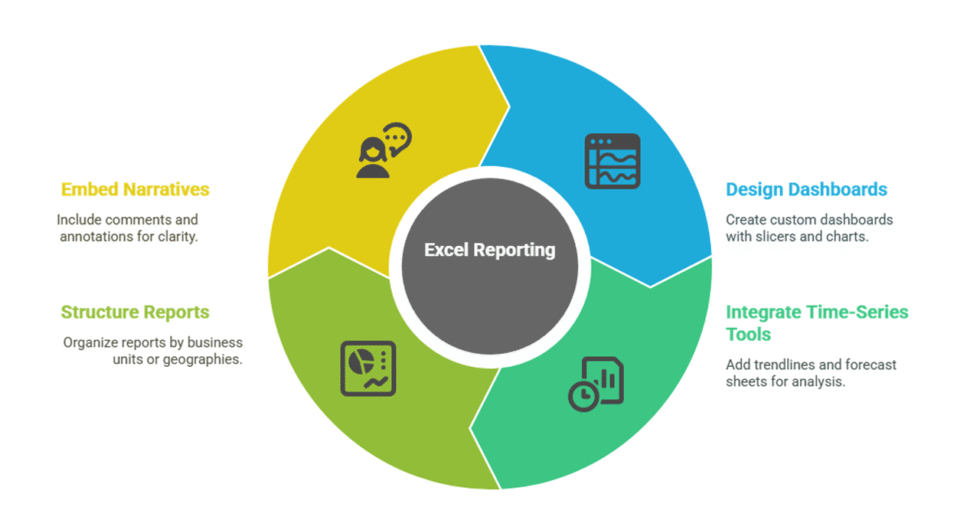
Custom-tailored reporting formats designed for managers, analysts, and stakeholders
-
Proven ability to handle large Excel files and make data easy to explore
What I Need to Start Your Project
To deliver high-quality, useful outputs, please provide the following:
1) Project Overview & Goals
-
Purpose of the analysis (e.g., trend discovery, performance tracking, KPI insights)
-
Final deliverable expected (dashboard, PDF report, Excel output, etc.)
2) Dataset Details
-
Format (Excel, CSV, Google Sheets) and size
-
Nature of data (e.g., sales, operations, HR, survey)
-
Variables to focus on, including column names and types
3) Analysis Focus Areas
-
Type of data mining you need (e.g., segmentation, anomaly detection, trends)
-
Metrics or KPIs you want calculated or visualized
-
Any patterns or hypotheses you’d like to test
4) Excel Features to Use
-
Indicate if you want use of specific tools: Power Query, PivotTables, slicers, VBA automation
-
Any formatting or design guidelines for the dashboard or report
5) Reporting Needs
-
Type of visuals preferred (bar chart, trend line, pie chart, etc.)
-
Layout expectations: single page, printable format, executive dashboard, etc.
-
Export options: Excel, PDF, printable summary
6) Timeline & Delivery Schedule
-
Total deadline and review milestones
-
Whether you need early previews or a phased delivery
7) Post-Delivery Support
-
Whether you need help updating the dashboard later
-
Option for walkthrough/training session to understand the model/report
-
Need for a user guide or documentation
8) Communication Preferences
-
Frequency of updates (e.g., bi-weekly progress reports)
-
Preferred tools (Google Meet, Zoom, email, WhatsApp)
Portfolio
Complaint Pattern Analysis and Escalation Dashboard for FMCG Support
Built an Excel-based dashboard to track and escalate recurring customer complaints for a packaged food brand. Combined severity indexing, trend mining, and regional mapping to reduce resolution time and improve product accountability.
Customer Segmentation Dashboard with RFM in Excel
Build an RFM-based customer segmentation model in Excel with dynamic dashboards for targeted marketing campaigns and improved retention.
Product Clustering Model in Excel for Inventory and Sales Optimization
Use Excel to perform unsupervised clustering on retail products and create an interactive dashboard for sales, inventory, and return pattern analysis.
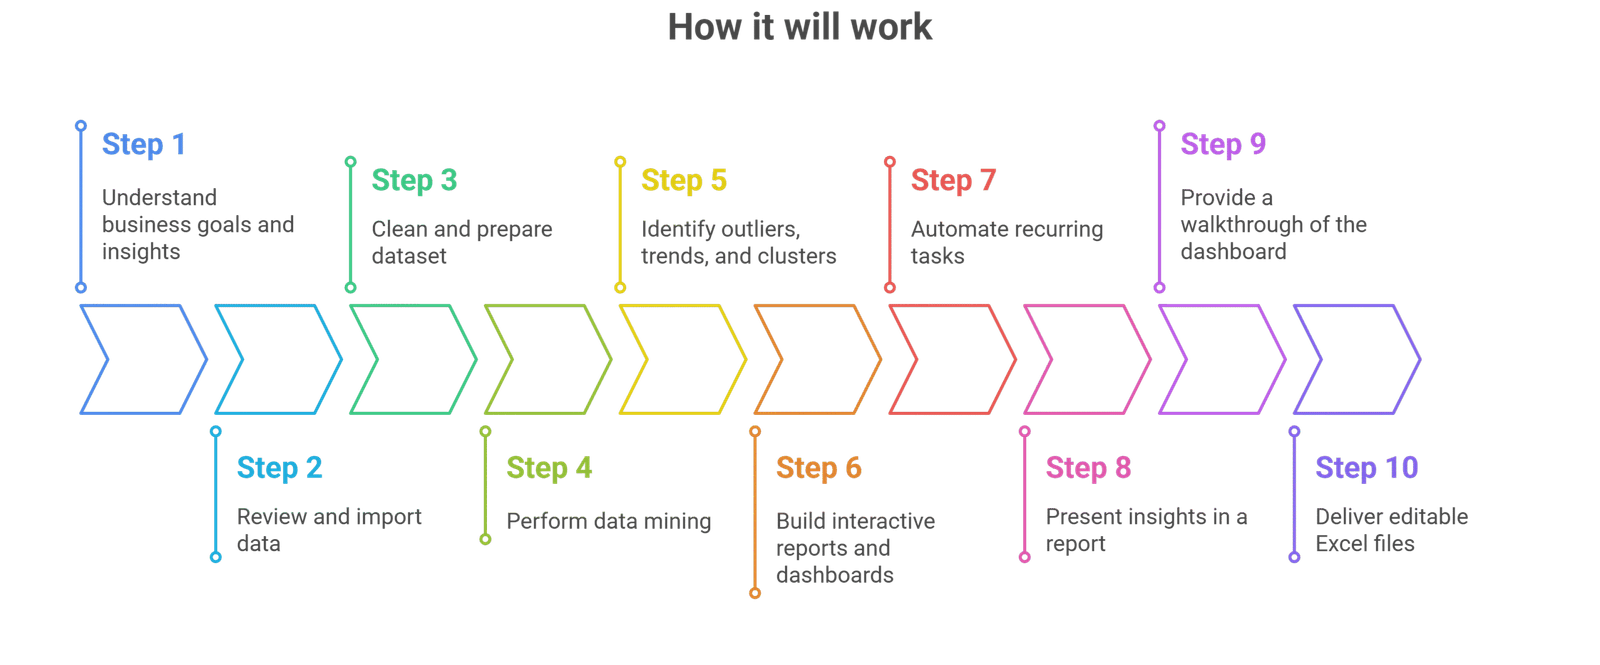
Process
Customer Reviews
5 reviews for this Gig ★★★★☆ 3.9
Great value for money. Found issues in our customer churn that we hadn’t noticed before. Would’ve liked more communication in between milestones though.
Data work was okay but I felt the charts could have looked better visually. The analysis part was quite strong and detailed.
Wasn't sure Excel could handle so much data, but he made it work. Insights were sharp and the dashboards really helped us with our client reporting.
Solid job overall. The final Excel report was clear and easy to use, though it took a bit longer than I expected. Worth the wait though.
Good with numbers and patterns. Helped us clean up a messy sales report and find useful trends, although a few formula errors had to be corrected later.
Quick Insights
Starts at $55
Light data scan & summary
-
 3
Days Delivery
3
Days Delivery
-
 1
Revision
1
Revision
Business Intelligence
Starts at $65
Full data mining & reporting
-
5
Days Delivery
-
2
Revisions
Excel Analytics Suite
Starts at $150
Advanced mining + automation
-
8
Days Delivery
-
Unlimited
Revisions


