
I can help you conduct data analysis and reporting using R
- 4.3
- (5)
Project Details
Why Hire Me?
📱Click to Connect on Whatsapp to Discuss Your Project
With over 7 years of experience in applied statistics and analytics, I specialize in using R and RStudio to conduct high-quality data analysis and deliver clear, detailed reports. Whether you are working on an academic dissertation, business project, or statistical research, I offer complete support from start to finish.
Key Strengths:
-
Deep knowledge of R packages like
ggplot2,dplyr,tidyr,lm,car,forecast, andcaret -
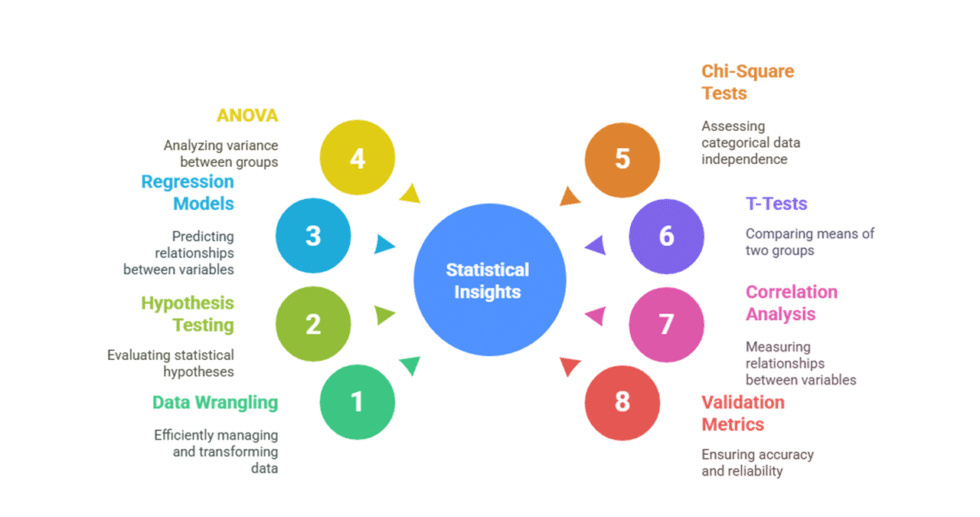
Skilled in exploratory data analysis, hypothesis testing, regression, and visualization
-
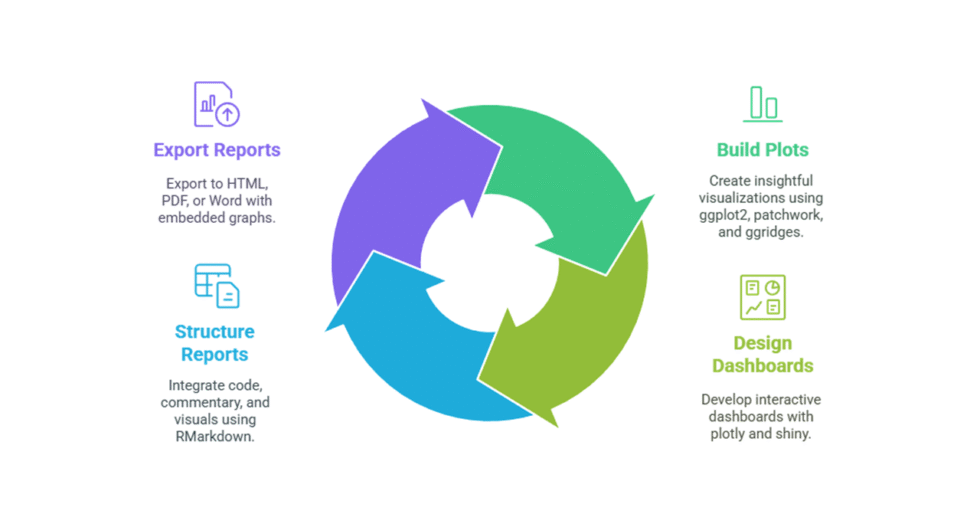
Fluent in RMarkdown reporting, making your output reproducible and professional
-
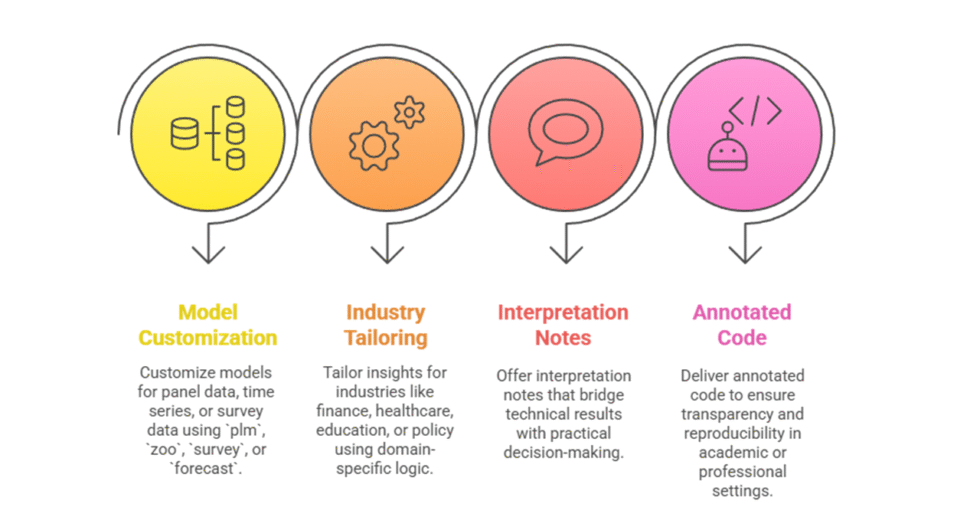
Experienced across multiple domains: healthcare, economics, marketing, education, and more
-
Committed to confidentiality, accuracy, and adherence to project-specific requirements
What I Need to Start Your Work
To ensure your project runs smoothly and meets your expectations, please provide the following:
1) Project Description and Goals
-
Brief overview of your project
-
Specific research questions, hypotheses, or outcomes you want to explore
2) Data Information
-
Dataset(s) in
.csv,.xlsx,.rds, or.savformats -
Description of variables and dataset size
-
Any prior cleaning steps taken or data issues to address
3) R Tools and Methods (if known)
-
Preferred R packages or methods (e.g., linear regression, time series, ANOVA)
-
If you have existing R code or scripts, please include them
4) Reporting Expectations
-
Report format (RMarkdown, PDF, Word) and word count if required
-
Structure (e.g., introduction, methods, results, interpretation)
-
Target audience (technical vs non-technical)
5) Compliance and Ethics
-
Any IRB approval, GDPR, or data anonymization requirements
-
Data confidentiality expectations
6) Timelines and Milestones
-
Final submission date
-
Intermediate milestones for drafts or feedback
7) Communication Preferences
-
Preferred communication platform (email, WhatsApp, Zoom)
-
Frequency of updates
8) Additional Requests
-
Specific formatting (APA, MLA, etc.)
-
Any additional files or references for background context
Portfolio
Analyzing Consumer Spending Shifts During Inflation Using R for a U.S. Retail Chain
Used R to analyze how inflation influenced consumer purchase patterns across product categories. The insights informed dynamic discounting strategies and restocking priorities.
Churn Risk Profiling Using Behavioral Data in R for a U.S. Subscription-Based App
Conducted statistical profiling and segmentation in R to identify patterns linked to customer churn. Results helped the client optimize retention triggers and notification policies.
Analyzing Graduation Outcomes by Financial Aid Type Using R for a U.S. Public University
Used R to analyze graduation outcomes across different student financial aid types. The report helped university administrators design more equitable funding allocation models.
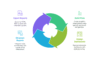
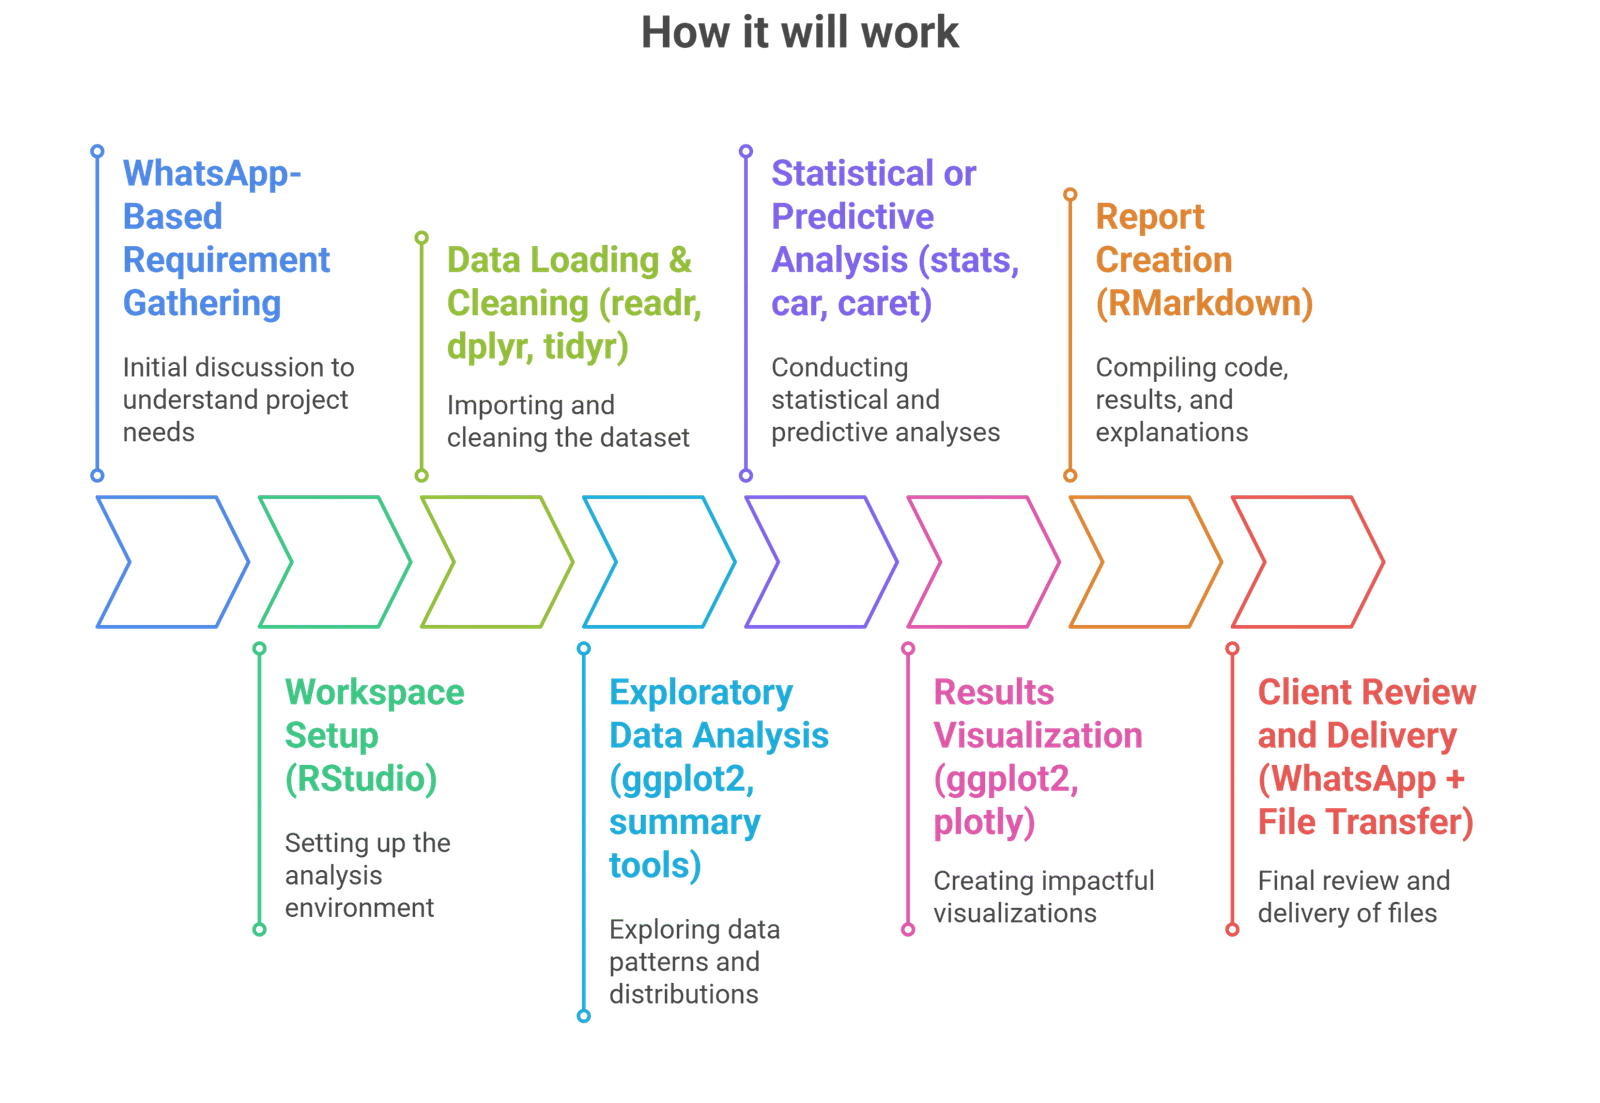
Process
Customer Reviews
5 reviews for this Gig ★★★★☆ 4.3
I’m not great at R and this saved me. he even helped fix some of my code and explained what was wrong. really helpful and patient.
the cleaning and analysis part was perfect. just wish the delivery was a bit faster. still the report was very solid and usable for my client deck.
Used ggplot2 so well. visuals were sharp and made it easy for my professor to understand my work. appreciate the effort on formatting.
Good with stats but some charts could have been more detailed. overall helped me finish my report on time and gave me summary points too.
I needed help with regression and time series analysis for my thesis and he explained everything in such a simple way. report was really clean too.
Starter Report
Starts at $55
Simple R output, basic insights
-
 4
Days Delivery
4
Days Delivery
-
 1
Revision
1
Revision
Visual Insights
Starts at $95
Full analysis with graphs in R Markdown
-
8
Days Delivery
-
3
Revisions
Model Builder
Starts at $250
Advanced models and tailored report
-
15
Days Delivery
-
Unlimited
Revisions


