
Levels of Measurement in Statistics: The Complete Guide
Levels of measurement in statistics decide, before you run a single test, what your data is even allowed to tell you. I have spent twelve years reviewing dissertations and research projects, and I can tell you the single most common reason a supervisor sends a chapter back is not bad writing. It is a mismatch between the level of measurement and the test used on it.
Most textbook explanations stop at definitions and a table. That works for an exam, not for a live methodology chapter. New to this topic? Levels of measurement explained for beginners is exactly what the first half of this guide covers.
Already run statistics before? Skip ahead to the section on choosing the right test. Either way, I will walk through the four types of data and their measurement levels, and where analysts get confused. Then you will see how to choose level of measurement for your own variable, before you touch SPSS or R.
What Are Levels of Measurement in Statistics (And Why I Check This Before Any Analysis)
Levels of measurement, also called scales of measurement, describe how much mathematical structure a variable actually has. A variable can be a simple label, an ordered rank, an evenly spaced number, or a true measurable quantity. The level decides which statistics you can honestly calculate and which statistical tests are valid.
I check this before anything else on every project that comes to me. Skip this step and everything downstream, from the descriptive statistics to the final significance test, is built on a wrong assumption.
The Four Levels, Explained Like a Hierarchy
There are four levels of measurement in statistics: nominal, ordinal, interval and ratio. Each level keeps everything the level below it can do and adds one new ability.
- Nominal categorises data with no order.
- Ordinal categorises and ranks data, though the gaps between ranks are not equal.
- Interval categorises, ranks, and has equal gaps between values.
- Ratio does everything interval does, and adds a true zero point.
Nominal and ordinal data belong to the categorical toolkit used in qualitative research methods. Interval and ratio data feed directly into the parametric tests used in quantitative research methods. This split matters later when you choose which family of test to run.
Where This Framework Came From
This is the part almost no article bothers to mention, and I think that is a mistake for anyone writing a methodology chapter. The four-level framework was proposed by Harvard psychologist S. S. Stevens in his 1946 paper published in Science. He was trying to settle a long-running argument about whether human sensation could even be measured at all.
Most online explainers present Stevens’ rule, that your scale of measurement directly dictates which statistical test you are allowed to run, as settled fact. It is not that simple.
Methodologists have directly challenged this exact claim, arguing that the underlying distribution of your data matters just as much as the label you put on the variable. I still teach Stevens’ framework first, because it is the fastest way to avoid an obvious error. But if a reviewer pushes back on a borderline case, citing this debate honestly is safer than pretending the rule is beyond question.
Eighty years later, this is still the framework taught in every research methods course. In 2026, most survey platforms and statistics software will auto-detect a variable’s likely measurement level the moment you import a dataset. That is convenience, not correctness. The software regularly mislabels ordinal Likert data as continuous “scale” data, which is exactly why knowing these four levels yourself, rather than trusting the auto-classification, still matters as much now as it did in 1946.
Nominal Data: The Starting Point
What Is Nominal Data in Statistics
Nominal data is the most basic level of measurement. It sorts observations into categories that have no natural order.
Examples: gender, blood group, hair colour, brand of phone used, marital status, type of fruit. You can count how many times each category appears, but you cannot say one category is “more” or “less” than another.
What You Can and Cannot Do Statistically
With nominal data, you can calculate frequency counts, percentages, and the mode. That is the ceiling. You cannot calculate a mean or a standard deviation, because there is no numeric distance between “male” and “female” or between “red” and “blue.”
For hypothesis testing, chi-square tests, Fisher’s exact test for small samples, and McNemar’s test for paired categorical data are the standard tools. If two nominal variables are being compared, chi-square is almost always your starting point.
Common Mistake Analysts Make With Nominal Data
I still see students code categories as 1, 2, 3 in SPSS and then run a mean on that column. A mean of “1 = urban, 2 = semi-urban, 3 = rural” is meaningless. The numbers are labels, not quantities, and averaging them produces a number with zero interpretation. If your reviewer catches this, it is an easy rejection to avoid.
Ordinal Data: Adding Order
What Is Ordinal Data With Examples
Ordinal data adds rank to categorisation. The categories have a clear order, but the distance between them is not guaranteed to be equal.
Examples: customer satisfaction ratings (very dissatisfied to very satisfied), education level, movie star ratings, cancer stage (I to IV), income bracket (low, middle, high). You know satisfied is better than dissatisfied, but you cannot prove the gap between “neutral” and “satisfied” equals the gap between “satisfied” and “very satisfied.” This comes up constantly in survey research, where nearly every question ends up measured on some version of an ordinal scale.
Is a Likert Scale Ordinal or Interval?
This is the single most argued-over question I get from dissertation clients, and most articles online dodge it. Strictly, a single Likert item is ordinal data. The psychological distance between “agree” and “strongly agree” is not proven to equal the distance between “disagree” and “neutral.”
In practice, when you sum or average multiple Likert items into a composite scale score, many researchers and journals treat that composite as interval-like and run parametric tests on it. This is a judgement call, not a rule, and this decision belongs in questionnaire design, before a single response is collected, not after. State which approach you took and why in your methodology chapter.
Statistical Tests for Ordinal Data
For ordinal data, use the median and percentiles for description, not the mean. For hypothesis testing, Mann-Whitney U compares two independent ordinal groups, Wilcoxon signed-rank compares two paired ordinal groups, Kruskal-Wallis compares three or more independent groups, and Friedman’s test compares three or more paired groups. For correlation between two ordinal variables, use Spearman’s rank correlation, not Pearson’s.
Interval Data: Adding Equal Spacing
What Is Interval Data With Examples
Interval data has equal, meaningful gaps between values, so addition and subtraction make sense. The classic example is temperature in Celsius or Fahrenheit. IQ scores are another common example used in psychology research.
Why Interval Data Still Has No True Zero
This is where most explainer articles get sloppy. Zero degrees Celsius does not mean “no temperature.” It is an arbitrary point on the scale, not an absence of the thing being measured.
Because there is no true zero, you cannot say 40 degrees is “twice as hot” as 20 degrees. That statement is mathematically invalid, even though it sounds reasonable.
Ratio Data: The Gold Standard
What Is Ratio Data With Examples
Ratio data has everything interval data has, plus a true zero point that represents a genuine absence of the quantity. Examples: height, weight, age, income, reaction time, number of children.
Because zero really means zero, all mathematical operations are valid, including multiplication and division. You can correctly say someone earning eighty thousand rupees earns twice as much as someone earning forty thousand.
Difference Between Interval and Ratio Data
| Feature | Interval | Ratio |
|---|---|---|
| Order | Yes | Yes |
| Equal spacing | Yes | Yes |
| True zero | No | Yes |
| Ratios are meaningful | No | Yes |
| Example | Temperature (Celsius) | Weight |
Nominal vs Ordinal vs Interval vs Ratio: Full Comparison Table
Here are all four scales of measurement in statistics with examples, laid out so you can match your own variable in seconds. If you just need levels of measurement with examples in one place, this table is it.
| Level | Order | Equal Intervals | True Zero | Example | Common Test | Common Mistake |
|---|---|---|---|---|---|---|
| Nominal | No | No | No | Blood group | Chi-square | Averaging category codes |
| Ordinal | Yes | No | No | Satisfaction rating | Mann-Whitney U | Treating rank gaps as equal |
| Interval | Yes | Yes | No | Temperature (C) | t-test, ANOVA | Claiming ratios (“twice as hot”) |
| Ratio | Yes | Yes | Yes | Income | Pearson correlation, regression | Ignoring skew before running parametric tests |
Before running any parametric test on interval or ratio data, always check the normality assumption first. If you are comparing three or more groups with ANOVA and the result is significant, choosing the right post-hoc test is a second measurement-level-dependent decision most students overlook.
How Levels of Measurement Affect Which Statistical Test You Can Run
Your level of measurement is one of the first filters that decides your entire analysis plan, alongside your research design and sample size. Get the level wrong at the start, and every test that follows it is wrong too, even if the maths and the software output look perfectly fine.
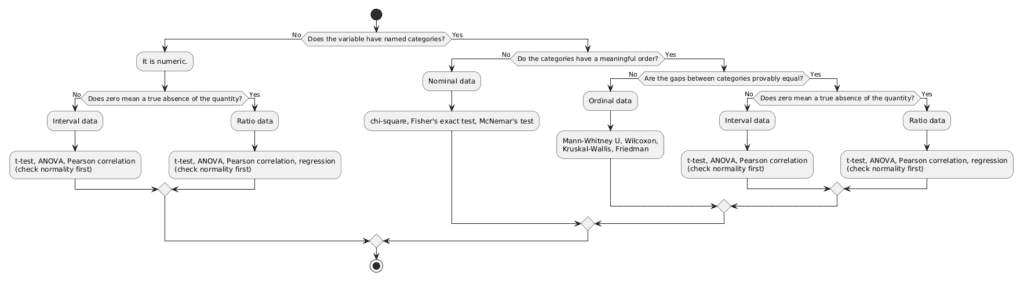
A Quick Decision Tree You Can Actually Use
Parametric vs Non-Parametric: The Real Deciding Factor
Parametric tests such as the t-test, ANOVA, and Pearson correlation need interval or ratio data, plus a roughly normal distribution. Non-parametric tests such as chi-square, Mann-Whitney U, and Spearman correlation are built for nominal or ordinal data, or for interval and ratio data that badly fails the normality check. Choosing between the two is not about which test sounds more advanced. It is about what your data can actually support.
A pattern I see often: a dissertation on employee engagement measured using a five-point Likert scale, analysed with an independent-samples t-test comparing two departments, only for a supervisor to flag it at the review stage. Recoding the analysis using Mann-Whitney U, since the raw scale items were ordinal, typically strengthens the argument rather than weakens it, because the non-parametric test matches the true shape of the data more closely.
How to Determine the Level of Measurement of Your Own Data
Knowing how to choose level of measurement for a new variable, before you collect a single data point, is what separates smooth analysis from panic-editing your methodology chapter later. Use this checklist before you touch any statistical software.
- Write down what the variable actually represents. A label, a rank, a measurement, or a count. This is the operationalization of variables step that most methodology chapters skip over in one line, then pay for later.
- Ask if the categories have a meaningful order. If no, it is nominal.
- If ordered, ask if the gaps between categories are provably equal. If not, it is ordinal.
- If the gaps are equal, ask if zero means a true absence of the quantity. If no, it is interval.
- If zero means true absence, it is ratio.
- Match your descriptive statistics to the level. Mode for nominal, median for ordinal, mean for interval and ratio.
- Match your inferential test to the level, and re-check normality for interval and ratio data. If you are working in SPSS, a guided walkthrough of the exact menu steps saves a lot of trial and error at this stage.
Your data collection methods should be decided only after you know the intended level of measurement for each variable, not the other way around. Doing this at the planning stage, before data collection even starts, saves you from redesigning your entire analysis chapter later.
When you write this up, state the level of measurement for each key variable explicitly in your methodology chapter, name the test you chose, and give one sentence justifying why that test fits that level. This is standard practice in APA-style reporting, and it is usually the exact sentence a reviewer is scanning for.
Why Levels of Measurement Matter in Research Methodology
Choosing the wrong level of measurement does not just produce a technically incorrect test. It can quietly change your conclusion.
A pattern I see often: ratio-level data, such as daily medication dosage, gets bucketed into “low, medium, high” categories purely out of habit copied from a published paper. Re-running the analysis on the original ratio-level dosage data instead of the collapsed categories regularly turns a relationship that looked statistically insignificant into one that is clearly significant. That is the real cost of getting this wrong: not a red mark from a reviewer, but a finding that either disappears or appears where it should not, simply because the data was forced into the wrong level.
FAQ
Is age interval or ratio?
Age is ratio data. It has a true zero point, meaning zero represents the complete absence of age, and all mathematical operations including multiplication and division are valid on it.
Is gender nominal or ordinal?
Gender is nominal data. It is a categorical variable with no inherent order or ranking, so you cannot perform mathematical operations on it.
Is a Likert scale ordinal or interval?
A single Likert item is technically ordinal data, since the psychological distance between response options is not proven to be equal. A composite score built from multiple Likert items is often treated as interval-like in practice, but this should be justified in your methodology, not assumed.
Can you calculate a mean for ordinal data?
Strictly, no, because ordinal categories do not have equal gaps between them. In practice, many researchers report a mean for composite Likert scales alongside the median, but this is a convention you should defend, not a statistical rule.
What happens if you use the wrong level of measurement?
You either run a test your data cannot support, producing results that are technically invalid, or you throw away information by treating higher-level data as a lower level, which can hide a real relationship in your findings.
Can ordinal data ever be treated as interval data?
Only when there is strong prior evidence that the categories are approximately equally spaced, such as a well-validated psychometric scale. Even then, state this assumption clearly rather than treating it as automatic.
How do I report level of measurement in my dissertation methodology chapter?
Name each key variable, state its level of measurement in one line, and follow that immediately with the statistical test you chose and why it fits that level. Reviewers are specifically scanning for this three-part statement, and its absence is one of the most common reasons a methodology chapter gets sent back for revision.
If you are stuck deciding the level of measurement for your own dissertation data, or need someone to check your test choice before submission, get one-on-one help through our statistical consulting service.
Author: Siddharth Gupta, 12+ years in statistical consulting and dissertation guidance | LinkedIn