
Becoming a Data Analyst After B. Com: A Comprehensive Roadmap in 2025

Yes, a B.Com graduate can become a Data Analyst! Your background in Accounting, Statistics, and Economics gives you a 30% head start in understanding business data. You just need to bridge the technical gap with SQL, Excel, and Power BI.
Hey there, B. Com grads! Feeling a bit lost after graduation? Wondering what’s next? How about stepping into the dynamic world of data analytics? Trust us, it’s not as daunting as it sounds, and your B. Com background has already given you a head start!
So, what’s the game plan? We’ve got you covered:
- Find Your Passion: First things first, ask yourself if data analytics excites you. If numbers and patterns get your heart racing, you’re in the right place.
- Skill Up: You’ll need some technical know-how. We’re talking Excel, Statistics, SQL, and maybe even a bit of Python or R. Plus, you’ll want to get familiar with data visualization tools like Tableau and Power BI.
- Become a Data Whiz: Master techniques like statistical analysis, predictive modelling, and even machine learning. Sounds cool, right?
- Get Your Hands Dirty: The best way to learn is by doing. Participate in small projects, enter data analysis competitions, or even freelance. The experience is priceless.
- Show and Tell: Create a portfolio to showcase your projects. It’s your personal billboard to the world.
- Network Like a Pro: Connect with industry experts, attend webinars, and join online forums. You never know, your next mentor could be just a click away.
- Never Stop Learning: The data analytics field is always evolving. Keep up with the latest trends to stay ahead of the game.
And guess what? Your B. Com degree has already laid a strong foundation for you to build upon. To make things even easier, we’ve linked to some awesome courses and projects by Statssy that can help you hit the ground running.
So, are you ready to pivot from B. Com to data analytics and open doors to a world of opportunities? Let’s do this!
Want to learn Data Analytics?
Connect on Whatsapp
What Does a Data Analyst Actually Do?
Before we jump into the nitty-gritty, let’s get a clear picture of what a Data Analyst does. Imagine being a detective but for businesses. You’ll sift through mountains of data to find golden nuggets of information that can help a company make smarter decisions. You’re not just dealing with numbers; you’re telling a story that could influence the company’s next big move.
How Your B. Com Degree Fits In
You might think you’re starting from scratch, but you’ve actually been doing “Data Analytics Lite” for three years already. Your degree has given you the business context that computer science students often lack.
Here is how your favorite (and maybe not-so-favorite) subjects translate into high-paying data skills:
1. Financial & Cost Accounting
Think about those hours you spent learning how money flows through a business—that is exactly what high-level Financial Analytics is all about. Instead of just balancing ledgers, you’ll be using that same logic to find patterns in massive datasets. For instance, if you’re working for a manufacturing firm, you can use your cost-accounting brain to spot a 5% waste in production that saves the company millions.
2. Business Math & Stats
This is your secret weapon. You already understand the “why” behind the mean, median, and variance, which are the fundamental building blocks of data science. In the professional world, you might use these concepts to help a brand decide if a new website design is actually working by running an A/B test to prove—with hard numbers—which version wins.
3. Economics
Economics taught you the “big picture” of how people and markets behave. In the data world, we call this Consumer Behavior Analysis. Imagine working for a retail giant like Flipkart; you can use the supply-and-demand indicators you already know to forecast which products will trend during the next holiday season.
4. Operations Management
This subject trained you to see a business as one interconnected machine where every sub-system matters. Data analysts use this specific “systems thinking” to find and fix bottlenecks. If you land a role at a logistics company like Blue Dart, your background helps you optimize supply chain processes to make deliveries faster and cheaper.
5. Business Law & Tax
While these might have felt like “theory” subjects, they are critical in an era where companies are terrified of data breaches and compliance errors. Your legal and tax foundation makes you a prime candidate for specialized roles like Data Governance or Tax Analytics, where you ensure a company’s data practices stay on the right side of global privacy laws.
Here’s a table that summarizes the key points for quick reference:
| B. Com Subject Area | Relevance in Data Analytics | Real-world Scenarios | Job Role | Types of Companies | Example |
|---|---|---|---|---|---|
| Financial & Cost Accounting | Analyze Financial Data | Manufacturing, Financial Services | Financial Analyst | Investment Banks, Accounting Firms | ICICI Bank, KPMG |
| Business Math & Stats | Apply Statistical Models | Sales Forecasting, A/B Testing | Statistician/Data Scientist | Tech Companies, Pharmaceuticals | Infosys, Dr. Reddy’s Laboratories |
| Company & Business Law | Navigate Legal Landscape | Data Privacy, Data Breach Handling | Data Privacy Lawyer/Privacy Attorney | Law Firms, Tech Companies | Trilegal, Wipro |
| Tax Know-How | Plan for Tax Expenses | Tax Consulting, Corporate Tax Planning | Tax Analyst | Accounting Firms, Corporations | Deloitte, Reliance Industries |
| Computer Savvy | Use Software Tools | Data Analysis Tools, CRMs | Data Engineer | Tech Companies, E-commerce | Flipkart, TCS |
| Economics & More Stats | Interpret Market Trends | Real Estate, Retail Business | Market Research Analyst | Marketing Agencies, Retailers | Nielsen, Future Group |
| Operations Management | Optimize Processes | Logistics, Healthcare | Supply Chain Analyst | Logistics Companies, Healthcare Providers | Blue Dart, Apollo Hospitals |
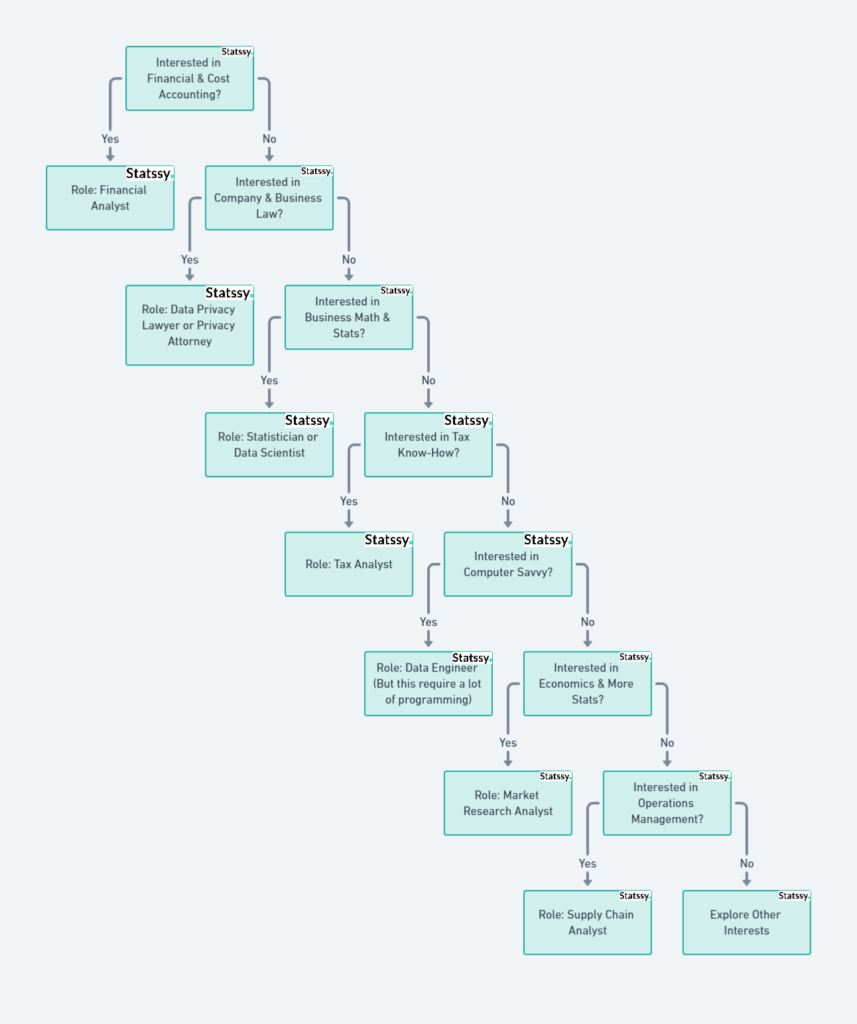
To put things into perspective, let me share a Career Path Flowchart which will help you make better decisions.
Up next, we’ll guide you through the essential steps to transition from your B. Com degree to a fulfilling data analyst role. Stay tuned!
Your Roadmap to Data Analyst
Alright, you’ve got that B. Com degree in your pocket, and you’re eyeing a career in data analytics. So, what’s next? Let’s break it down step-by-step.
Find Your Data Niche
Data analytics is a vast field. Do you see yourself crunching numbers for a financial firm, or perhaps diving into consumer behavior for a retail giant? Your B. Com subjects like Sales Management and Financial Studies can help you pinpoint what really excites you.
Building Your Analytics Toolbox
Transitioning into data doesn’t mean you need to become a computer scientist overnight. It’s more about picking up the right tools to translate raw numbers into business strategy.
SQL: Your Direct Line to Data
Think of SQL (Structured Query Language) as the “language” of databases. In a B.Com role, you might have looked at static reports; with SQL, you can actually go into a company’s database and pull exactly what you need—like retrieving specific sales records or creating a summary of real-time transactions. It’s the tool that lets you organize and manipulate data before you even start analyzing it.
Python or R: The Swiss Army Knife
These are the programming languages that do the heavy lifting. While they might look intimidating at first, they are incredibly logical. You’ll use them to clean up messy data, run those complex statistical models we talked about, and even create interactive charts that move and change. Python is generally the favorite for business automation, while R is a powerhouse for deep statistical research.
Microsoft Excel: The Foundation
You likely already know Excel, but as a Data Analyst, you’ll go far beyond simple spreadsheets. You’ll be using it for advanced sorting, creating pivot tables to summarize thousands of rows of data, and applying formulas to calculate Key Performance Indicators (KPIs) in seconds. It remains the most user-friendly way to get your first insights out of a dataset.
Data Visualization & Reporting
All the analysis in the world doesn’t matter if you can’t explain it to your boss. This is where tools like Tableau or Power BI come in. You’ll turn rows of data into visual stories—using heat maps to find high-performing sales regions or time-series graphs to track growth over a year. Finally, you’ll wrap it all into a structured report or a PowerPoint deck that highlights exactly what the business needs to do next.
Become a Data Maestro
You’ll need to master various data analysis techniques, from regression analysis to time-series forecasting. Your B. Com subject, Business Mathematics and Statistics, gives you a head start here.
Get That Certification
Statssy offers a Certified Data Analyst course that can make your resume shine brighter than a diamond.
Roll Up Your Sleeves
Theory is great, but practice makes perfect. Your B. Com dissertation can serve as a launchpad for small projects. Also, consider entering online data analysis competitions. Statssy has a treasure trove of datasets you can play around with.
Show and Tell
Create a portfolio that showcases your projects. This way, employers can see your problem-solving skills in action.
Network Like a Pro
Attend industry events, webinars, and don’t underestimate the power of LinkedIn. You never know when an opportunity might knock.
Never Stop Learning : Data Analyst After B. Com
The data analytics landscape is ever-changing. Keep your skills fresh and stay updated with industry trends. Remember, learning was a big part of your B. Com journey, and it doesn’t stop here.
Final Thoughts
Transitioning from a B. Com to a data analyst isn’t just possible; it’s a journey filled with opportunities for growth and specialization. Your B. Com degree has laid a strong foundation, and with a bit of focus and effort, you can build a fulfilling career in data analytics.
So, what are you waiting for? Kickstart your data analytics journey with Statssy today!