
What is Spearman’s rank correlation coefficient and how to calculate it by hand and calculator
Introduction
Spearman’s Rank Correlation Coefficient is used to understand the relationship between two sets of data. This guide will help you understand what it is, why it’s important, and how to calculate it by hand through examples.
Understanding Spearman’s Rank Correlation Coefficient
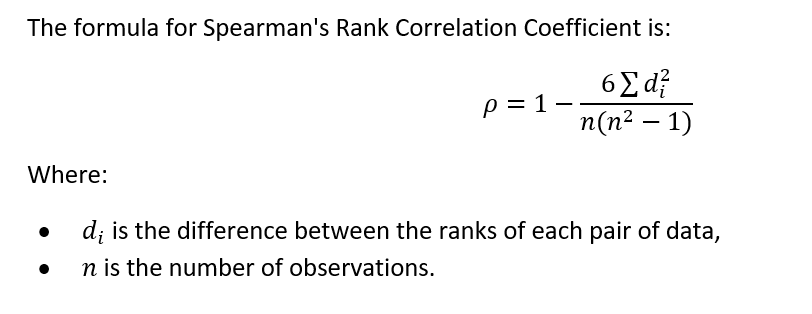
The Spearman’s Rank Correlation Coefficient, often symbolized as ρ (rho) or as rs.
It is a non-parametric measure of rank correlation.
In simpler terms, it assesses how well the relationship between two variables can be described.
Unlike the Pearson correlation coefficient, which requires the two datasets to be normally distributed, Spearman’s coefficient applies to any set of ordinal variables. This makes it a more versatile tool in many real-world applications.
Calculating Spearman’s Rank Correlation Coefficient
Calculating the Spearman’s Rank Correlation Coefficient involves five steps:
- Rank each set of data.
- Calculate the difference between the ranks of each pair of data.
- Sum up these squared differences.
- Insert these values into the Spearman’s Rank Correlation Coefficient formula.
- Interpret the result
Let us see it through example
Example 1: Let’s say we have data for 10 Instagram users with the number of posts they made and number of followers they have:
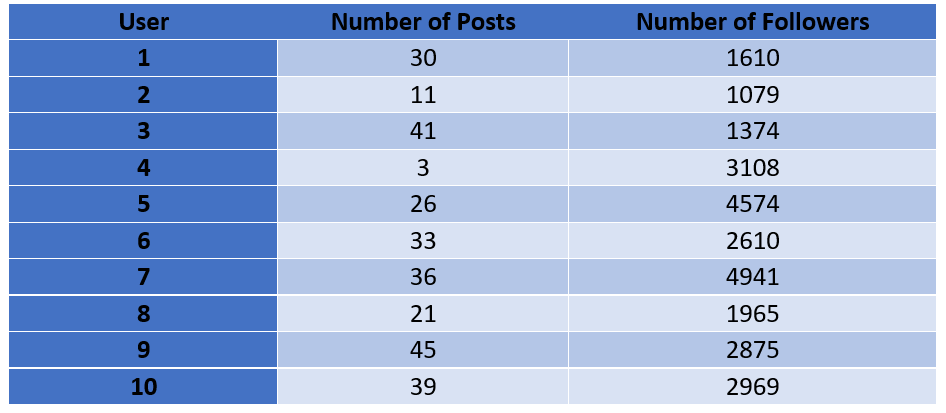
Let us say our aim is to find out if users make more posts when they have more followers or not. This is a common example from the field of marketing analytics in data science domain.
Let us solve it step by step:
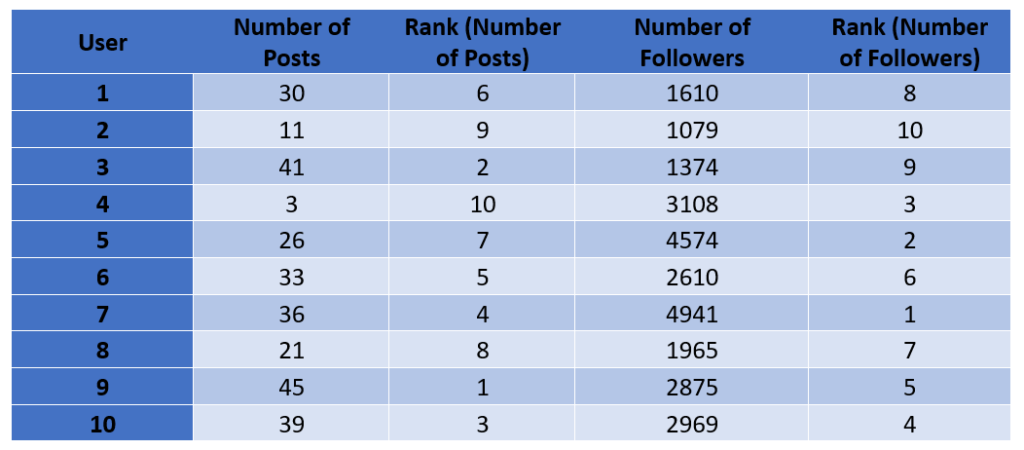
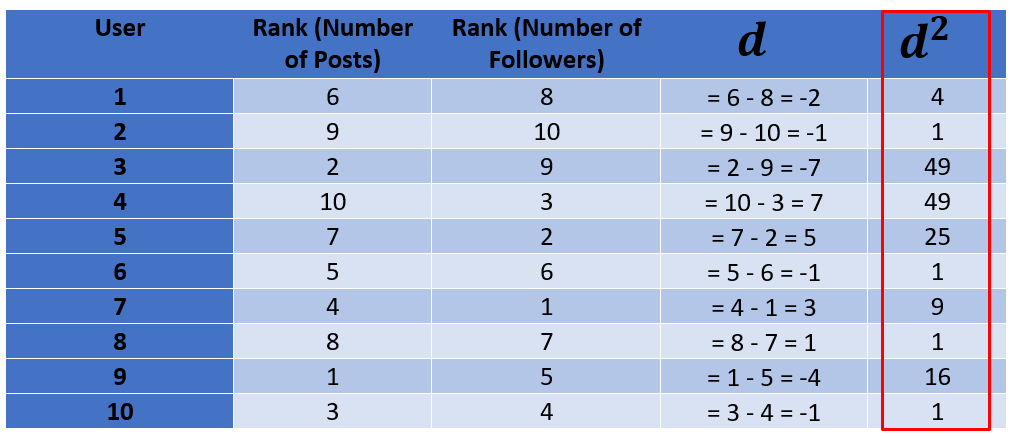
Step 1: Rank each set of data
In this step we will rank both sets of data in decreasing order. This means the largest value will have rank 1 and smallest value will have last rank.
Step 2: Calculate the difference between the ranks of each pair of data and square them
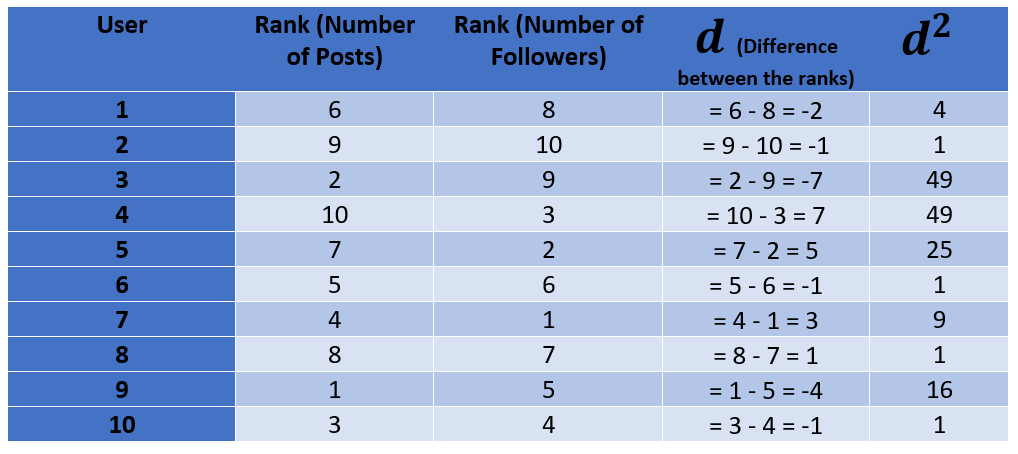
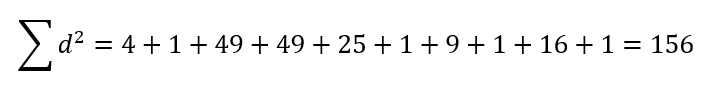
Step 3: Sum up these squared differences
Now we will add all the squared differences which is the last column
Step 4: Insert these values into the Spearman’s Rank Correlation Coefficient formula
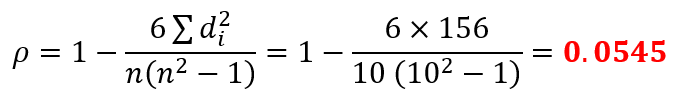
Step 5: Interpret the result
So, the correlation coefficient we found is 0.0545, now this value is positive which means there is a positive relationship.
But the value is very small and close to zero which means it is a weak relationship.
So in terms of marketing analytics, we can say that there is a weak positive correlation between number of posts and number of followers on Instagram. This means an Instagram account which have high followership do not necessarily posts more than the one which have low follower count.
Spearman vs. Pearson: Which One Should You Use?
One of the biggest reasons users leave a page about Spearman is that they are actually trying to figure out if they should have used Pearson instead. Adding this table near the top of your post will keep users on the page longer.
| Feature | Pearson Correlation (r) | Spearman’s Rank (ρ) |
| Data Type | Continuous (Interval or Ratio) | Ordinal (Ranked) or Continuous |
| Relationship | Linear (Straight line) | Monotonic (Moving in one direction) |
| Outliers | Highly Sensitive | Robust (Resistant to outliers) |
| Distribution | Assumes Normal Distribution | No Distribution Assumptions |
| Calculation | Based on raw data values | Based on the rank of the values |
| Best Used For | Height vs. Weight, Test Scores | Competition Ranks, Skewed Salary Data |
Now that you have the formula, see it in action. In marketing, we use this to rank influencers by engagement versus actual sales. Explore our guide on Spearman Correlation in Marketing Analytics