
I can help you develop compelling dashboard in Power BI
- 0
- (0)
Project Details
Why Hire Me?
📱Click to Connect on Whatsapp to Discuss Your Project
I bring over seven years of hands-on experience in dashboard development, business intelligence, and data visualization. My focus is to deliver tailored Power BI dashboards that combine visual appeal with analytical depth, empowering your team to make fast, informed decisions.
Why Clients Choose My Service:
-
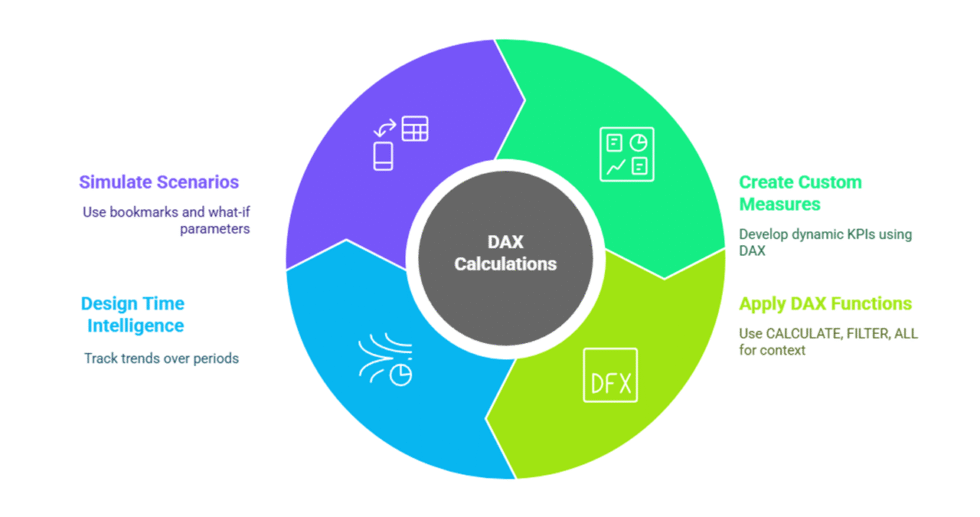
Strong command over Power BI’s full capabilities, including DAX, Power Query, and data modeling
-
Proven ability to work with complex datasets from multiple sectors
-
I create dashboards that are visually clear, interactive, and aligned with your KPIs
-
I offer end-to-end support, from dashboard architecture to team onboarding
-
My dashboards prioritize usability, security, and strategic insight
What I Need to Start Your Work
To build a Power BI dashboard that is aligned with your goals, I will need the following:
1) Project Brief and Dashboard Goals
-
Clear description of the business problem or decision the dashboard will support
-
List of KPIs or metrics that the dashboard should focus on
2) Data Integration and Source Details
-
All data sources: file types (Excel, CSV), databases (SQL, cloud services), APIs
-
Access instructions and credentials (if applicable)
-
Information on data structure and known issues with the dataset
3) Dashboard Design and Visualization Aspects
-
Your design preferences: minimal, corporate, colorful, dark/light mode
-
Required visualizations: e.g., bar chart, donut, time series, slicers, maps
-
Description of how users will interact with the dashboard
4) Analytical Depth and Reporting Features
-
Insights expected (e.g., variance analysis, trend breakdowns)
-
Real-time or scheduled data refresh needs
-
Reporting needs like executive summaries or downloadable reports
5) User Accessibility and Collaboration
-
Number and roles of intended users
-
Permissions for editing, viewing, and sharing
-
Any collaboration features needed, such as Teams or SharePoint integration
6) Compliance with Data Standards
-
Data protection or privacy policies (e.g., GDPR, HIPAA) to follow
-
Confidentiality agreements or anonymization rules if needed
7) Development Timeline and Milestones
-
Final delivery date and key milestones
-
Number of drafts or design review rounds planned
8) Communication and Feedback Protocol
-
Preferred contact method: Email, WhatsApp, Slack, Zoom
-
How often you expect status updates or demos
-
Turnaround expectations for your feedback
9) Additional Customizations and Requirements
-
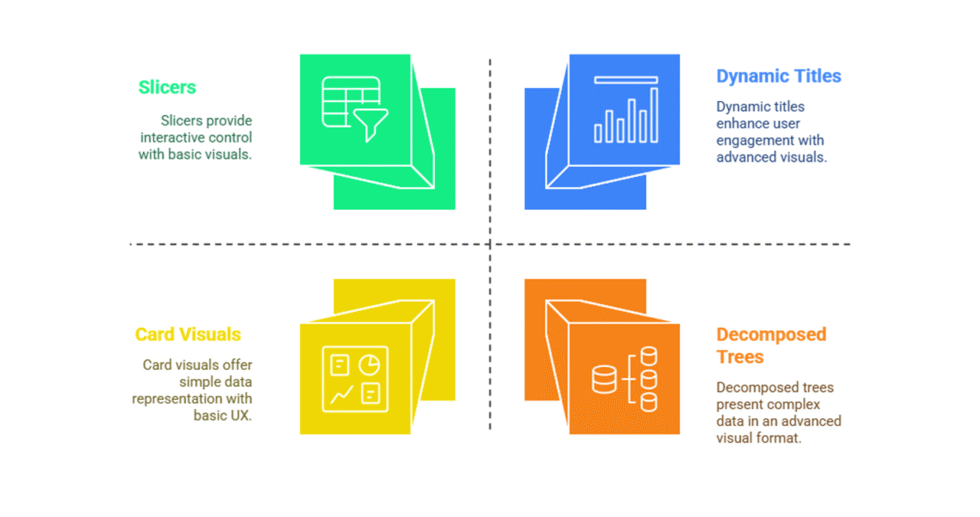
Advanced Power BI features (e.g., bookmarks, drill-through, tooltip pages)
-
Export options (PDF, Excel)
-
Deployment preferences: Power BI Service, embedded reports, etc.
Portfolio
Building a Power BI Dashboard to Track Regional Sales Performance for a US Retail Chain
This project used Power BI to visualize sales, targets, and profitability across US regions. Interactive filters and drill-throughs enabled managers to monitor KPI performance in real time.
Designing a CFO Dashboard in Power BI: Financial Overview, Cash Flow, and Variance Analysis
A dynamic CFO dashboard was developed in Power BI to track P&L, budget variances, and cash flow trends across business units. Custom visuals and dynamic KPI cards supported decision-making.
Power BI Workforce Dashboard: HR Metrics for Retention, Productivity, and Headcount Analysis
This dashboard project visualized employee turnover, hiring trends, and departmental productivity using HRIS data in Power BI. Drill-downs and filters allowed detailed analysis by role and location.
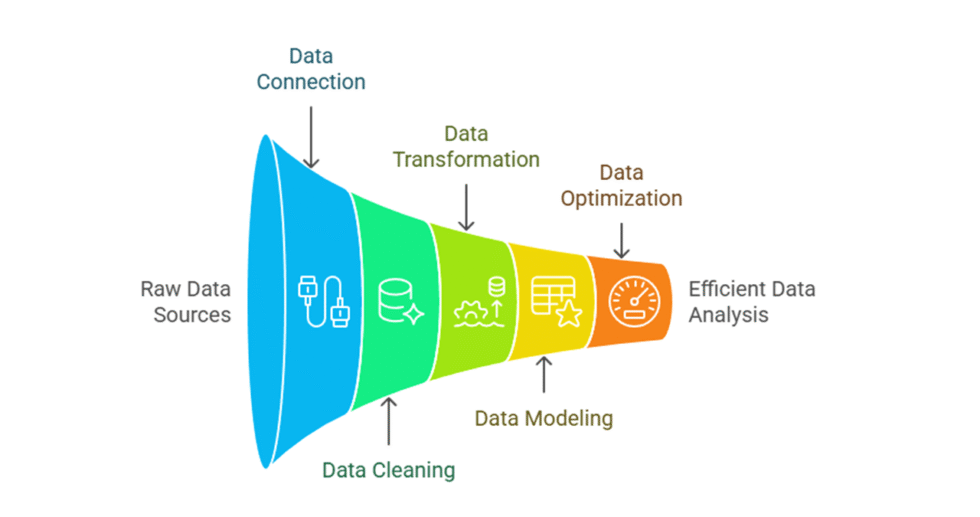
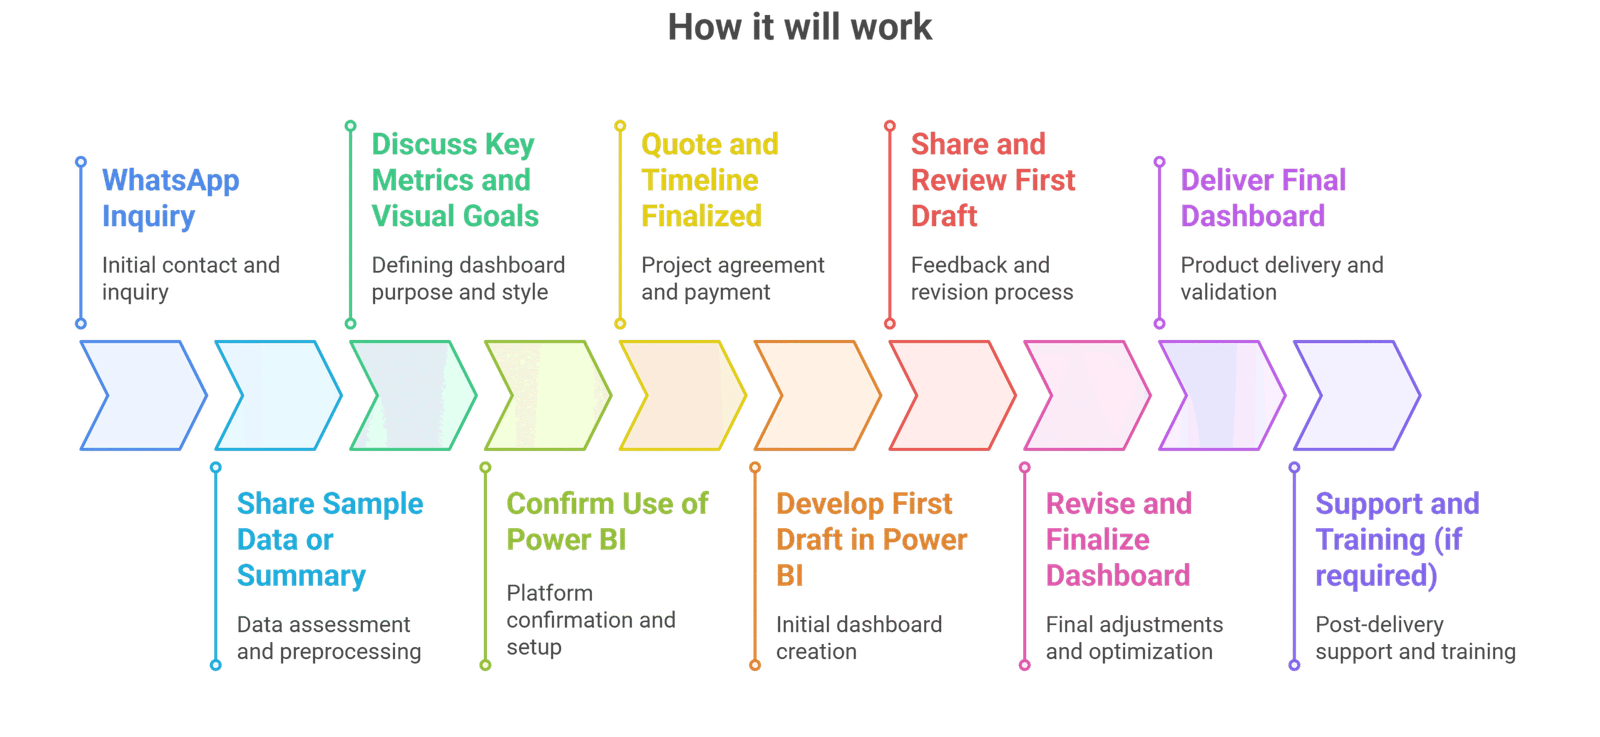
Process
Essential Dashboard
Starts at $55
Visualize key metrics with basic charts and layout
-
 3
Days Delivery
3
Days Delivery
-
 1
Revision
1
Revision
Interactive BI Panel
Starts at $95
Interactive dashboard with slicers and custom visuals
-
5
Days Delivery
-
3
Revisions
Advanced Power BI Suite
Starts at $250
Full-featured dashboard with complex logic & automation
-
12
Days Delivery
-
Unlimited
Revisions


