
I can help you build interactive dashboard in excel
- 0
- (0)

Project Details
Why Hire Me?
📱Click to Connect on Whatsapp to Discuss Your Project
I create intuitive and professional Excel dashboards that bring clarity to your business data. Whether you need to track KPIs, monitor project timelines, or generate automated reports, I translate raw data into a visual interface that executives and teams can use with ease.
Why I'm a Reliable Expert:
-
7+ years of hands-on experience in Excel dashboard creation
-
Strong grasp of business metrics, automation, and reporting workflows
-
Expertise in Excel features: PivotTables, slicers, VBA, charts, dynamic formulas
-
Able to integrate multiple data sources for unified views
-
Tailored designs for diverse domains: sales, finance, HR, operations, logistics
What I Need to Start Your Project
To develop a functional and insightful dashboard that aligns with your business goals, I will require the following:
1) Dashboard Goals and KPIs
-
What business problem are we solving?
-
List of key metrics and indicators you want to visualize
-
Frequency of dashboard use (daily, weekly, monthly)
2) Data Sources
-
Excel files, SQL extracts, CRM exports, or web-based data
-
Whether data updates are manual or automated
-
Sample or dummy data (if live data is not ready)
3) Excel Features Required
-
Whether you want filters (slicers), charts, heatmaps, drop-downs, macros
-
Whether automation via VBA or Power Query is required
-
Specific requests like dynamic date ranges or interactive user forms
4) User Experience Preferences
-
Who will use the dashboard (executives, analysts, team members)?
-
Do you prefer a single-screen view or multiple tabs?
-
Required color schemes, fonts, or branding
5) Reporting Needs
-
Do you want automated reports (e.g., weekly exports)?
-
Will the dashboard be shared? Should there be print/PDF options?
-
Should alerts be included (e.g., conditional formats for KPIs outside target)?
6) Access and Confidentiality
-
Number of users accessing the file
-
Required protection or password settings
-
Whether data is sensitive and needs anonymization during development
7) Review and Iteration Process
-
How many review cycles or feedback rounds are preferred?
-
Preferred collaboration format (email, video call, document comments)
-
Timeline for project completion and milestone reviews
Portfolio
Excel Sales Funnel Dashboard for B2B Pipeline Tracking and Forecasting
An interactive Excel dashboard for B2B companies to track lead stages, monitor sales funnel conversion, and forecast quarterly revenue with real-time updates and visual analysis.
Excel HR Dashboard for Performance, Attendance, and Attrition Analysis
An advanced Excel HR dashboard integrating performance, attendance, training, and attrition to help mid-sized firms identify employee trends, risks, and retention drivers.
Retail Sales Excel Dashboard with Region-Wise Filters
Built an interactive Excel dashboard for retail sales analysis across regions and categories. Track KPIs like gross sales, returns, and YoY growth using PivotTables and slicers.
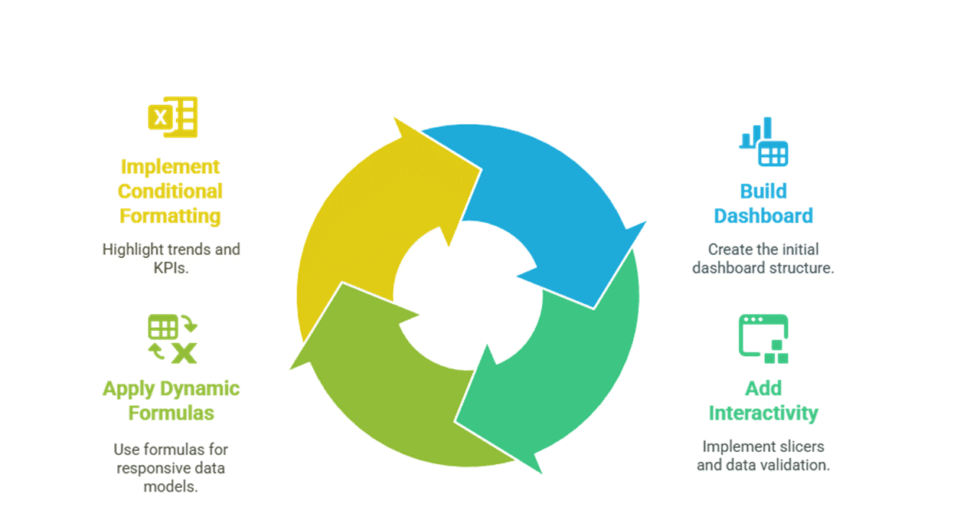
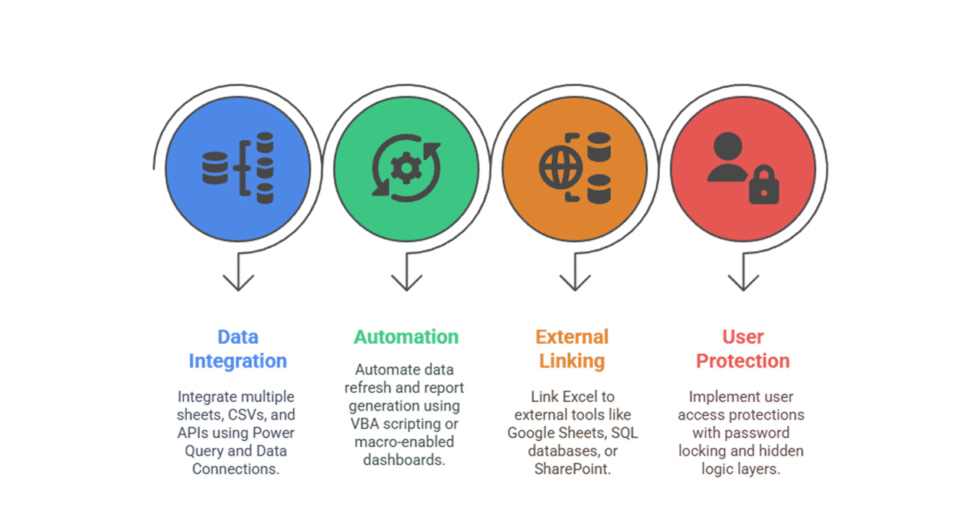
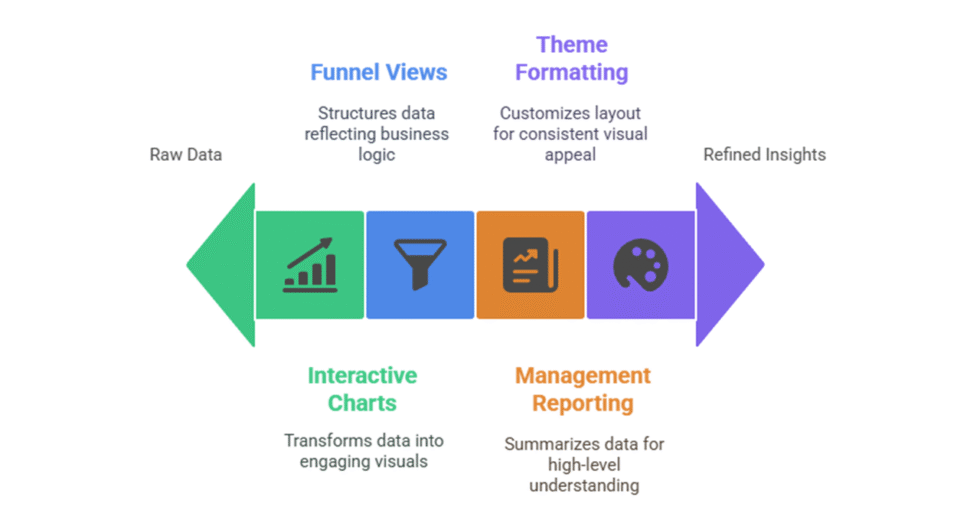
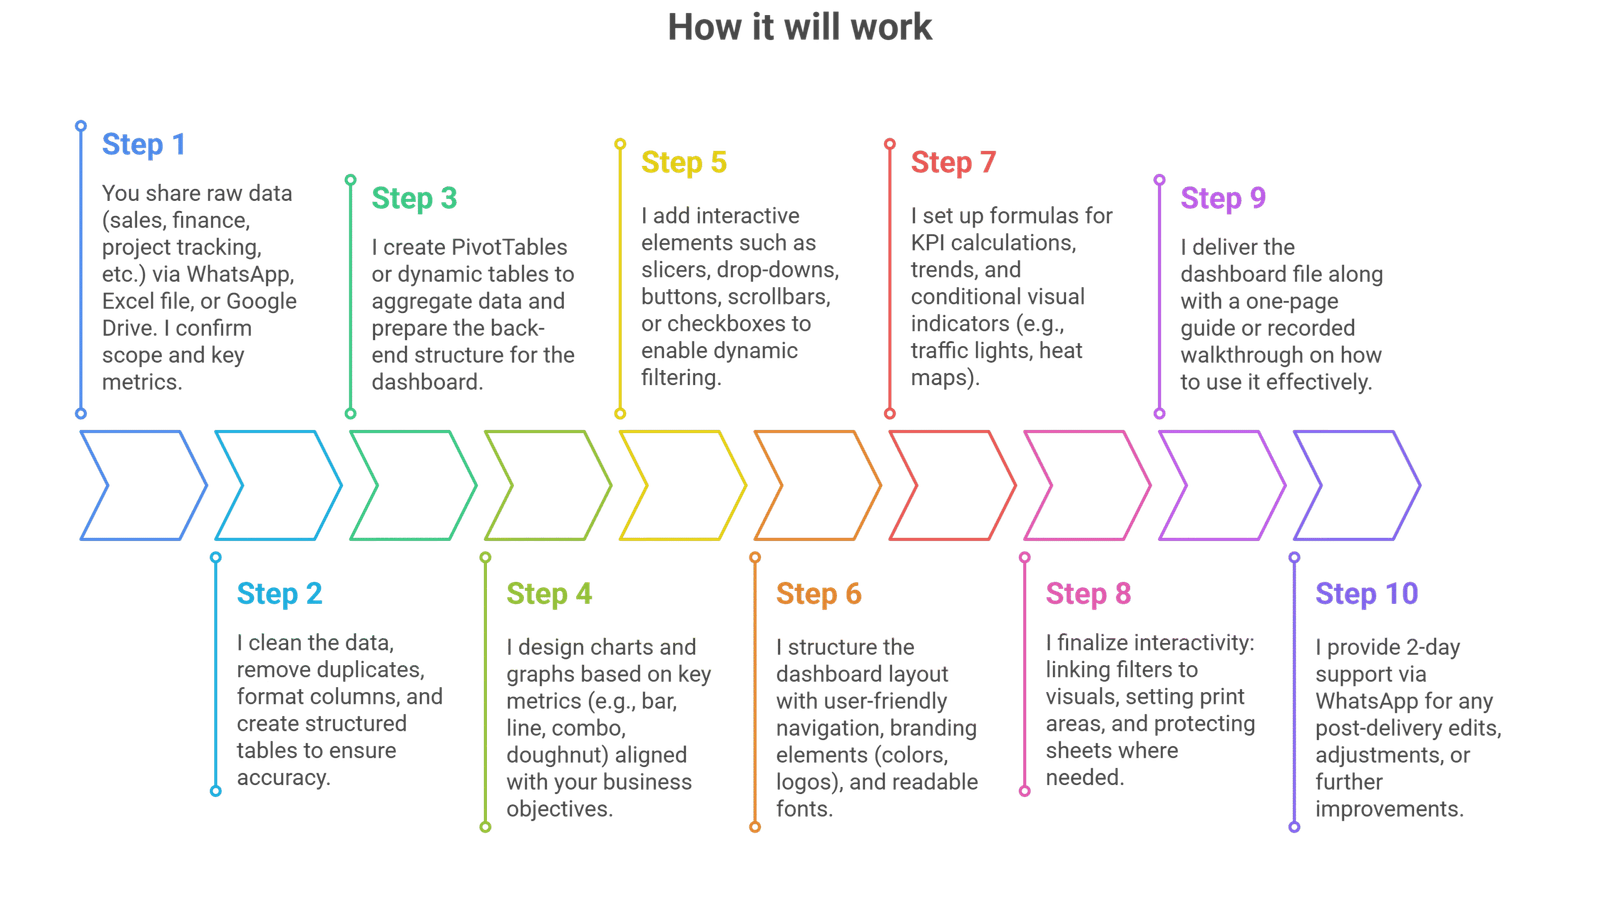
Process
Starter Dashboard
Starts at $55
Simple interactive report setup
-
 5
Days Delivery
5
Days Delivery
-
 1
Revision
1
Revision
Business Dashboard
Starts at $95
Full-feature dynamic solution
-
10
Days Delivery
-
2
Revisions
Pro Analytics Suite
Starts at $250
Advanced Excel dashboard system
-
15
Days Delivery
-
Unlimited
Revisions


