
I can help you conduct statistical analysis and reporting using Excel
- 4.3
- (5)
Project Details
Why Hire Me?
📱Click to Connect on Whatsapp to Discuss Your Project
With over 7 years of experience in data analysis using Excel, I offer a practical and efficient approach to extracting insights from your data.
-
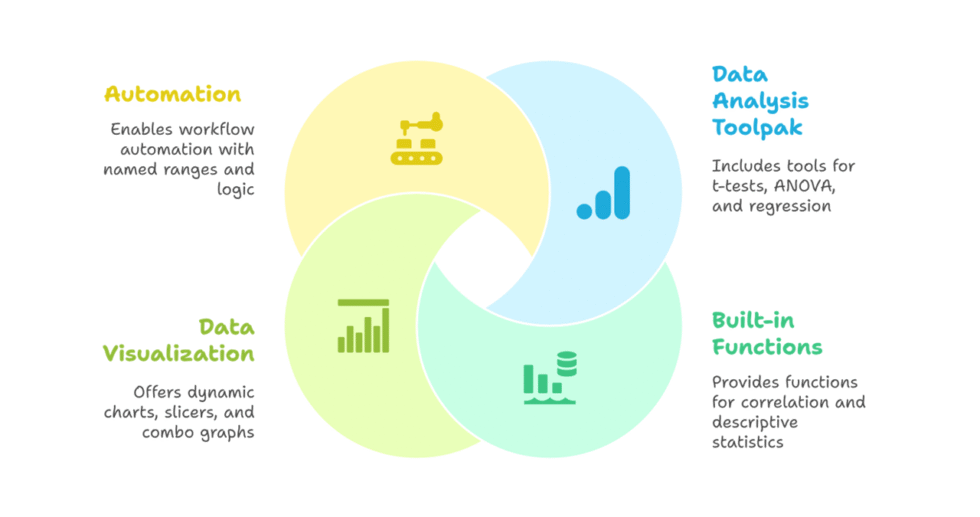
Skilled in using Excel functions, formulas, and statistical tools for reliable analysis
-
Experienced in hypothesis testing, trend analysis, and linear regression within Excel
-
Proficient in creating PivotTables, dynamic charts, and summary dashboards
-
Capable of producing well-structured reports suitable for business or academic audiences
-
Strong focus on clear visualization and accurate presentation of results
What I Need to Start Your Work
-
Project Overview
-
Summary of your analysis goals, questions, or hypotheses
-
Context of the project (academic assignment, business report, etc.)
-
-
Data and Data Description
-
Dataset(s) in
.xlsx,.csv, or.xlsformat -
Variable types (numeric, categorical) and any prior data cleaning or transformations done
-
-
Analysis Requirements
-
Techniques to be used (e.g., descriptive stats, regression, trend analysis)
-
Any required Excel tools (e.g., Data Analysis Toolpak, PivotTables, Solver)
-
-
Reporting Preferences
-
Output format (Excel workbook, PDF summary, or embedded report)
-
Visualization needs (specific charts, conditional formatting, etc.)
-
Any formatting or template requirements for professional or academic submission
-
-
Communication & Timeline
-
Preferred communication method (email, call, video)
-
Deadlines, delivery milestones, or feedback intervals
-
Portfolio
Consumer Satisfaction Analysis Using Excel for an FMCG Brand
Explore how an FMCG company used Excel to analyze customer satisfaction and purchase behavior through descriptive statistics and t-tests. A practical case study in Excel-based data analysis and report generation.
Employee Performance Forecasting Using Regression in Excel
See how an IT company used Excel to evaluate the relationship between training hours and employee performance through correlation and regression analysis. A practical case study in HR analytics using Excel.
Sales Forecasting with Moving Averages and Trendlines in Excel
Discover how a retail chain used Excel-based moving averages and trendlines to forecast sales and improve inventory planning. A practical case study in predictive analytics for retail using Excel.
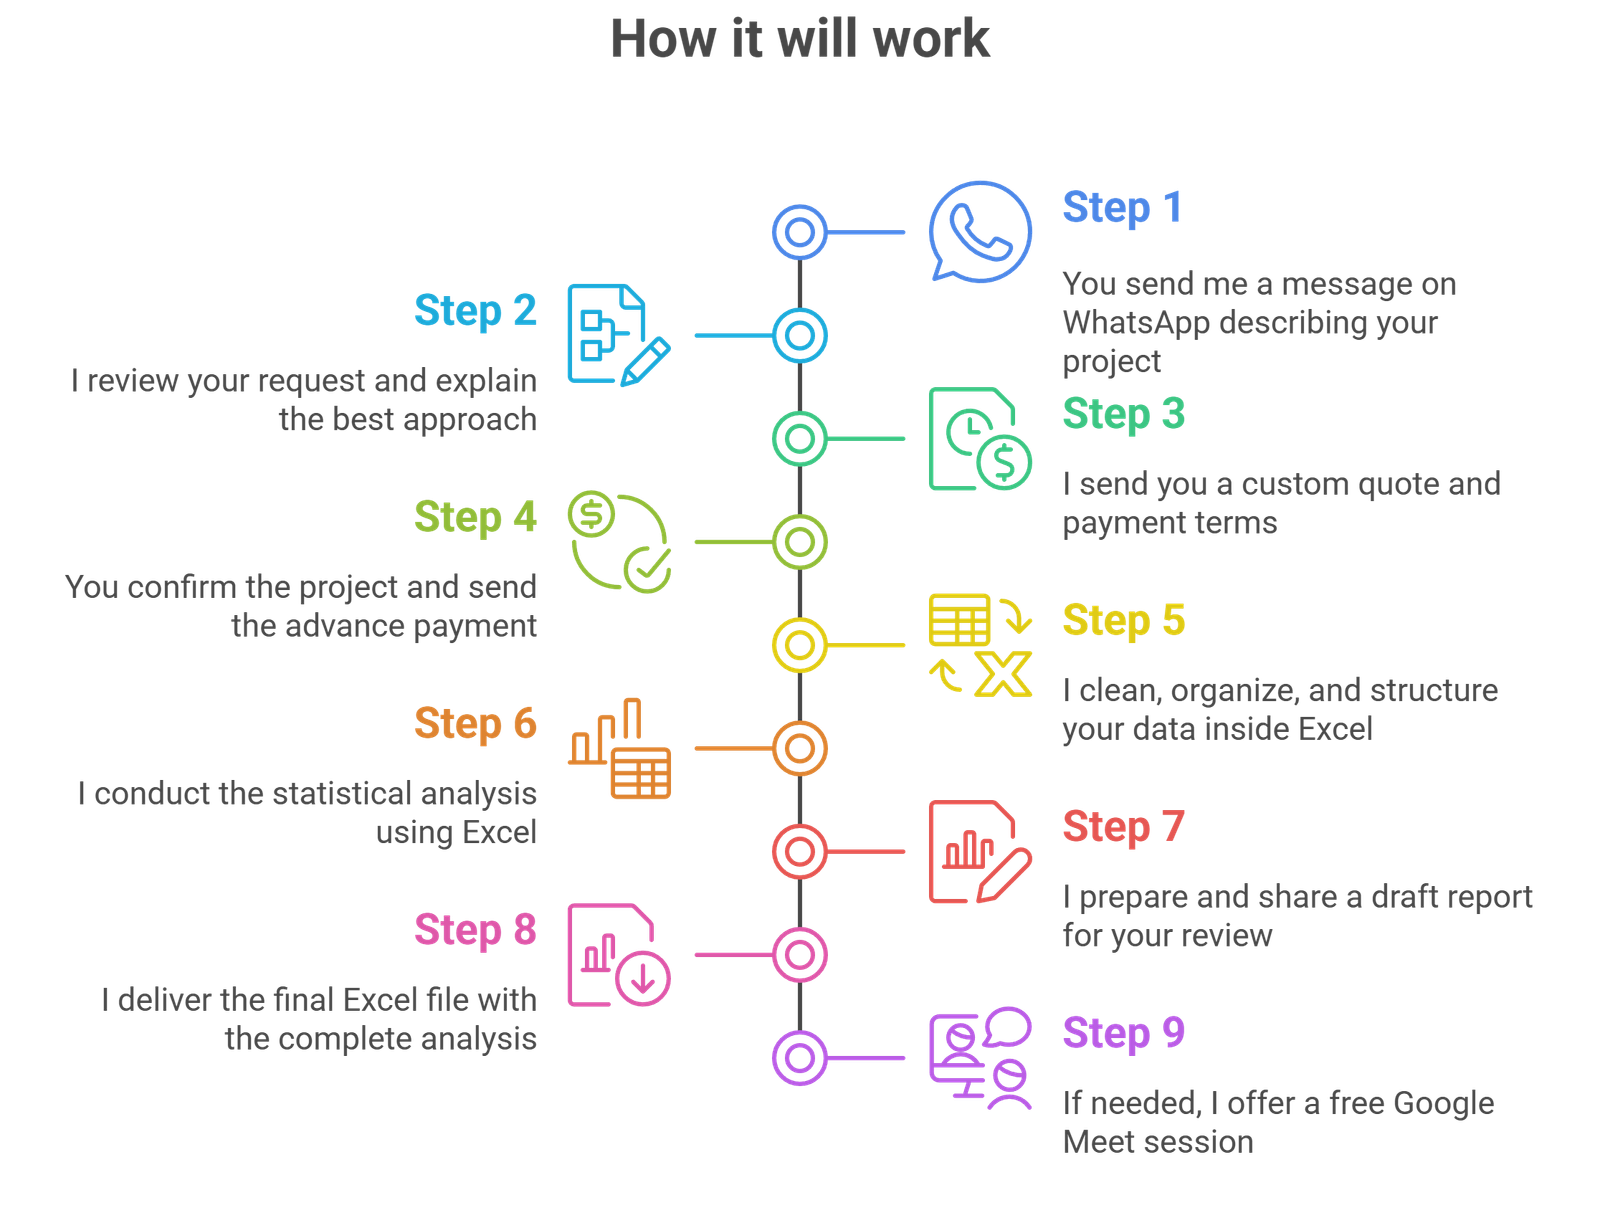
Process
Customer Reviews
5 reviews for this Gig ★★★★☆ 4.3
very patient, helped me fix errors in my pivot table and made a report i could actually submit without editing anything
i needed ANOVA and regression done in excel for my uni project and he got it done fast and accurate
he figured out the trends from my messy sales sheet and made charts that even my team could understand
honestly didn’t expect Excel could do so much with statistics but he made it work and explained every step clearly
great with formulas and helped build a dashboard that actually made sense for my manager's review
Excel Summary
Starts at $25
Descriptive stats and cleaning
-
 3
Days Delivery
3
Days Delivery
-
 1
Revision
1
Revision
Excel Analyst
Starts at $65
Statistical testing + reporting
-
5
Days Delivery
-
2
Revisions
Excel Predict
Starts at $120
Forecasting + visual dashboards
-
7
Days Delivery
-
3
Revisions


