
Conducting Statistical Analysis with R
We at Statssy believe in empowering businesses through data.
Here’s how we guide you in using R for comprehensive statistical analysis, ensuring you have the means to extract meaningful insights from your data.
Key Takeaways Table
| Key Points | Description |
|---|---|
| R for Statistics | Overview and importance of using R for statistical computation in data science |
| Getting Started | Basics of setting up and using R, including syntax and data structures |
| Descriptive Stats | How to summarize datasets using measures like mean, median, and standard deviation |
| Inferential Stats | Conducting hypothesis testing, confidence intervals, t-tests, ANOVA, and regression |
| Advanced Techniques | Expanding your analytical capabilities with multivariate analysis, nonparametric tests, and time series |
I. Introduction to Statistical Analysis with R
At Statssy, we use R to harness the power of data and bring it to the forefront of business decision-making. R’s flexible and comprehensive statistical capabilities make it an essential tool for anyone involved in data analytics. Let’s explore why and how R stands out as a prime choice for the analytical tasks you face every day.
- Business Relevance: Understanding data is key for strategic decisions.
- Flexibility of R: It is uniquely suited for varied statistical tasks.
Explore more about Different Types of Statistical Analysis Techniques.
II. Getting Started with R for Statistical Analysis
Embarking on your journey with R is a foundational step towards mastering statistics. We begin by acquainting you with the environment and the fundamental grammar of data manipulation that R uses, ensuring you’re well-equipped to tackle your data challenges.
- R Environment: All about installation, RStudio interface, and package management.
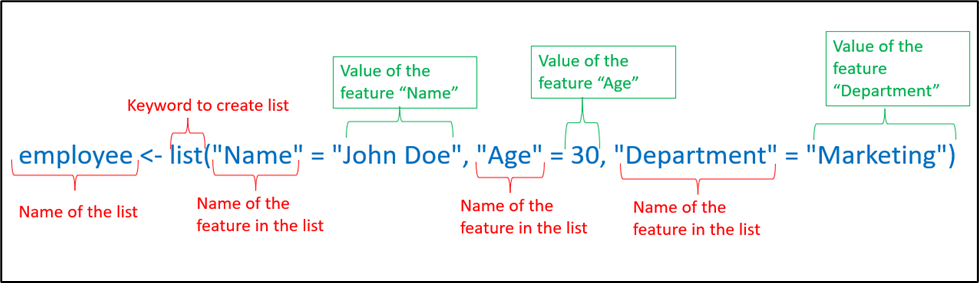
- Syntax and Data Structures: Delving into vectors, matrices, data frames, and lists.
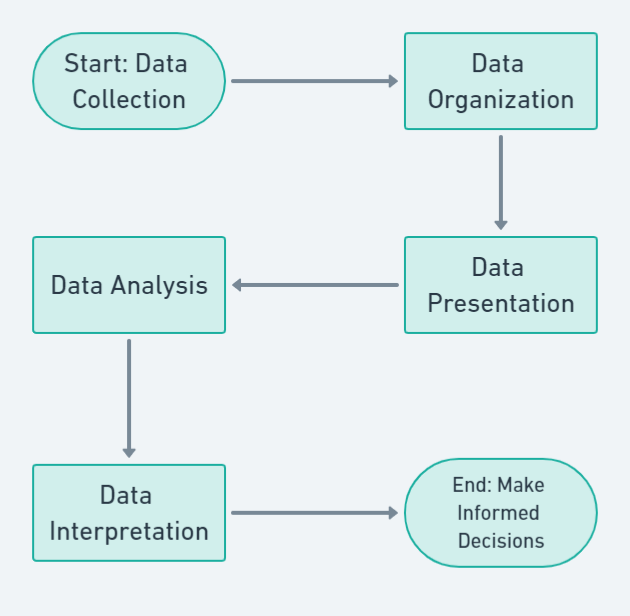
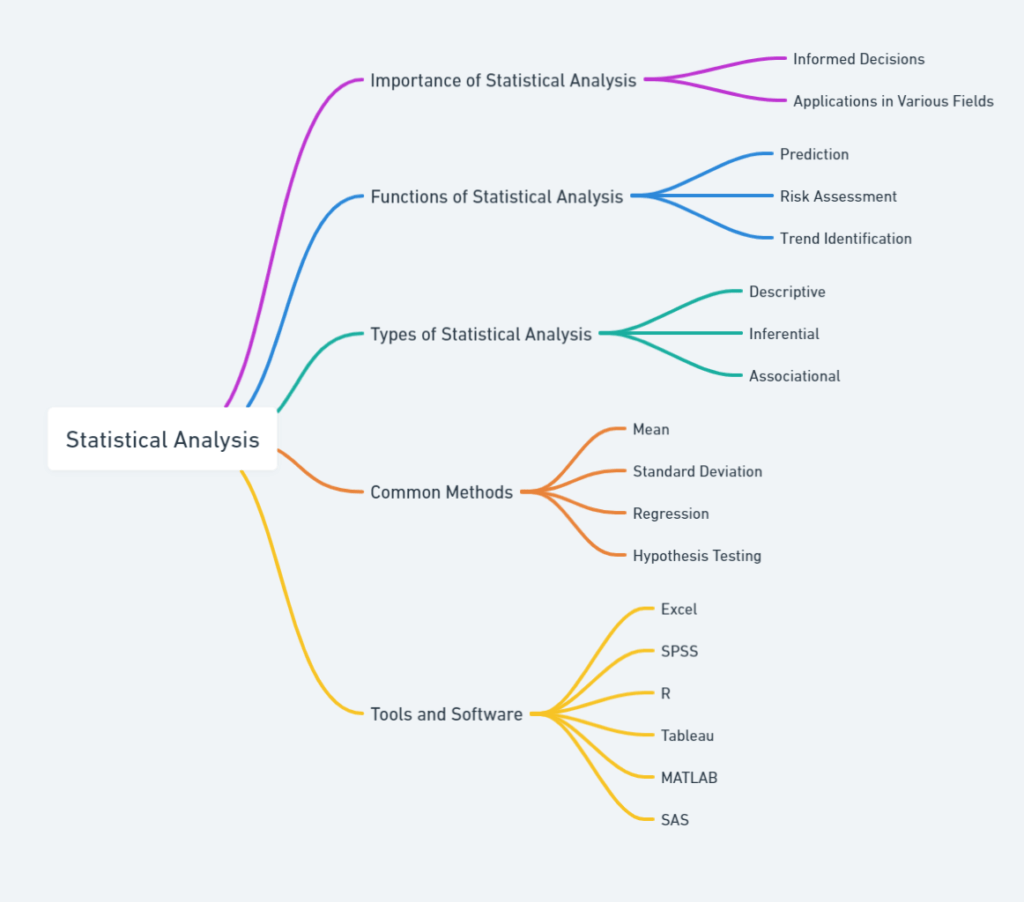
III. Descriptive Statistics with R
We anchor your understanding of data with descriptive statistics — summarizing key characteristics of datasets with measures of central tendency and variability. This is where data begins to weave stories essential for your business.
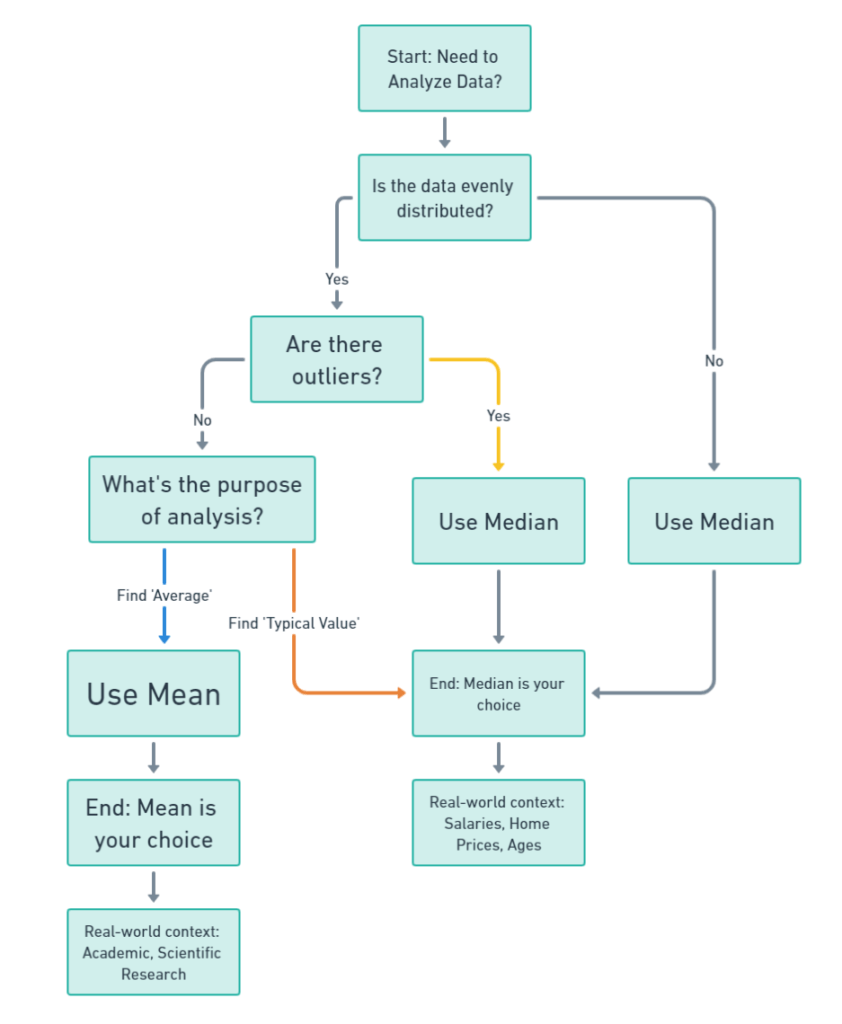
- Central Tendency: Mean, median, and mode to locate the data center.
- Variability: Range, variance, and standard deviation to grasp data spread.
IV. Inferential Statistics with R
From generalizing samples to populations to making predictions, we guide you through the inferential statistics landscape. You’ll learn to test hypotheses and build models that foresee and shape the future of your business.
- Hypothesis Testing: Understanding the cornerstone of inferential statistics.
- CI and Testing: Grasping confidence intervals and significance through t-tests and ANOVA.
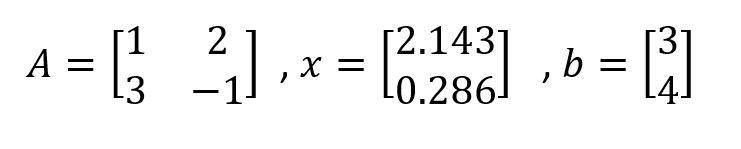
Delve into Linear Equation Using R Programming Solve.
V. Advanced Data Analysis Techniques in R
We steer you beyond the basics into the realm of advanced statistical analysis. Whether it’s predictive modelling or uncovering complex relationships between variables, R provides the tools needed for advanced assessments.
- Multivariate Analysis: Techniques for dealing with multiple variables.
- Time Series and Forecasting: Guidance in predicting future trends from past patterns.
Conclusion and Further Resources
End your journey through statistics with an overview and possibilities for continued learning with us. We, as your consultants, remain keen to help you navigate the fascinating world of statistics with R. Feel free to reach out and explore how our consultancy can bring data science to life for your business operations.