
How to Conduct Confirmatory Factor Analysis in AMOS and Interpret Model Fit
I am going to show you how to conduct confirmatory factor analysis in AMOS and interpret model fit the same way I walk my own dissertation clients through it. This guide covers CFA in AMOS for dissertation work exactly the way I run it with clients, based on 12 years of doing this with Master’s and PhD scholars across the UK and the US. So no theory dump here, just what actually works when you are sitting in front of the AMOS screen at 2 AM with a submission deadline.
A quick honesty note before we start. There are plenty of free YouTube tutorials on this topic, and some of them are genuinely good. What most of them skip is what to do when your fit indices come back poor, and how to defend your choices to an examiner. That is the gap this guide is written to close.
- CFA confirms a factor structure you already expect from theory; it does not discover structure like EFA does.
- Run it in AMOS by drawing latent variables, connecting them to their items, and checking Maximum Likelihood output.
- Good fit generally means CFI and TLI above 0.90, RMSEA and SRMR below 0.08.
- Poor fit should be fixed with theory-backed changes, never with data-driven changes alone.
- AMOS does not calculate AVE or Composite Reliability for you; you compute both by hand from the loadings it gives you.
What Is Confirmatory Factor Analysis (and Why Your Examiner Cares About It)
Confirmatory factor analysis (CFA) is a statistical technique used to test whether a set of observed survey items actually measures the underlying construct (latent variable) they are supposed to measure, based on a factor structure you have already decided in advance from theory or prior research.
That last part, “decided in advance,” is what separates CFA from EFA. If you already know your questionnaire has, say, three factors because a published scale told you so, you run CFA to confirm it. If you have no idea how many factors will emerge, you run EFA first.
AMOS, IBM’s structural equation modelling add-on for SPSS, is the tool most business and social science dissertations use to run this analysis, mainly because it draws the model visually instead of asking you to write code.
CFA vs EFA: When to Use Which
- Use EFA when there is no prior theory about the structure of your data.
- Use CFA when you are working with an established, previously validated scale.
- Use EFA first, then CFA on a separate sample, if you are adapting a scale to a new population or culture.
If your dissertation mixes scales you built yourself with scales borrowed from other papers, it helps to be clear on the difference between a validated scale and a custom instrument before you open AMOS, because the two are treated differently in your methodology chapter.
First-Order vs Second-Order CFA in AMOS
A first-order CFA has your latent factors connected directly to their observed items, nothing sits above them. A second-order CFA adds one more layer. A single higher-order latent factor sits above two or more first-order factors and explains why they correlate in the first place.
You need a second-order model when your theory says the first-order factors are all sub-dimensions of one broader construct, rather than separate constructs that just happen to correlate. In AMOS, this means drawing one more oval above your existing factors and connecting it to each first-order factor with a single-headed arrow. You then remove the direct correlations between those first-order factors, since the higher-order factor now explains that shared variance on its own.
Before You Open AMOS: What You Need Ready
A few things you must sort out before touching AMOS, otherwise you will waste hours re-running the model. One quick note on versions too: the menu paths below match recent AMOS releases (28 and 29). If you are on an older institutional licence, the same options exist, just occasionally under a slightly different menu label.
Minimum Sample Size for CFA
There is no single magic number, but the working rule most examiners accept is a minimum of 200 respondents, or 10 to 20 respondents per estimated parameter, whichever is higher. Hair and colleagues’ well known guidance on sample size in multivariate work points in the same direction: more latent factors and more items per factor push that minimum upward. I have seen dissertations rejected purely because the sample was too small for the model’s complexity, not because the analysis itself was wrong.
Data Checks Before Running CFA
- Check for missing values and decide on a handling method (listwise deletion, mean imputation, or multiple imputation).
- Check for outliers using Mahalanobis distance in AMOS itself.
- Check for multivariate normality, since Maximum Likelihood estimation (the default in AMOS) assumes it. Running a Shapiro-Wilk test for normality on your individual items before you get to AMOS saves you a lot of confusion later.
Step-by-Step: How to Conduct Confirmatory Factor Analysis in AMOS and Interpret Model Fit
Here is the sequence I follow with clients, every time.
- Import your SPSS data. File, then New, then Data Files, browse to your .sav file.
- Draw the measurement model. Use the ellipse tool for each latent variable, rectangles for each observed item, and connect each latent variable to its items with single-headed arrows.
- Add error terms. Every observed item needs an error circle attached. Most AMOS versions add this automatically with the “draw unique variable” tool.
- Name every variable. Double-click each rectangle and assign the exact SPSS variable name. Unnamed variables will not run.
- Correlate the latent factors. Draw double-headed arrows between each pair of latent variables, since a standard CFA assumes factors are correlated, not independent.
- Set your output options. View, then Analysis Properties, then Output, and tick Standardized estimates, Squared multiple correlations, and Modification indices.
- Run the analysis. Click the abacus icon (Calculate Estimates). An error here almost always means a naming mismatch or an unidentified model, not a software fault.
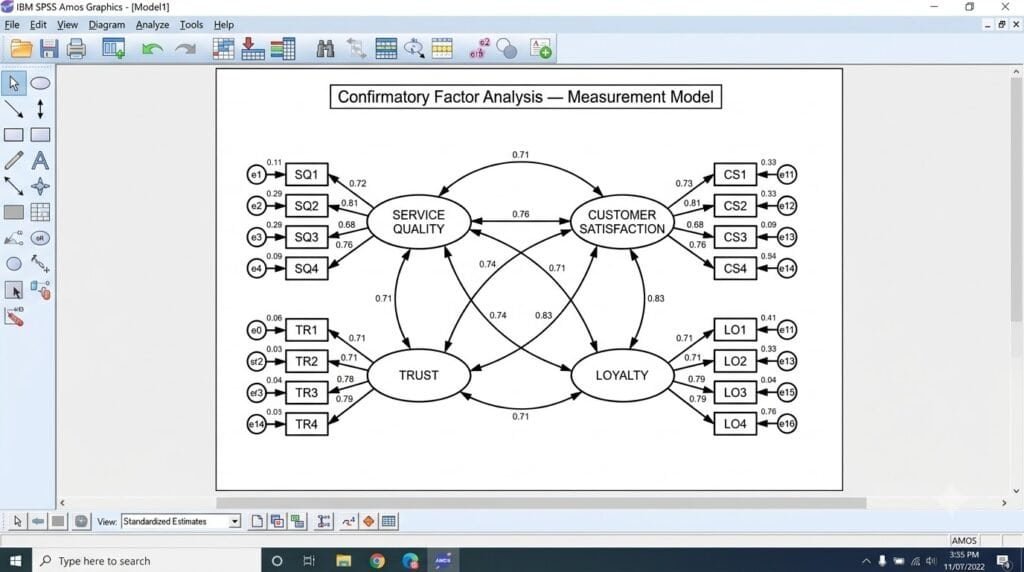
This is exactly where most of my dissertation clients get stuck when running CFA in AMOS, not because the theory is hard, but because of one mistyped variable name.
How to Interpret Model Fit Indices in AMOS
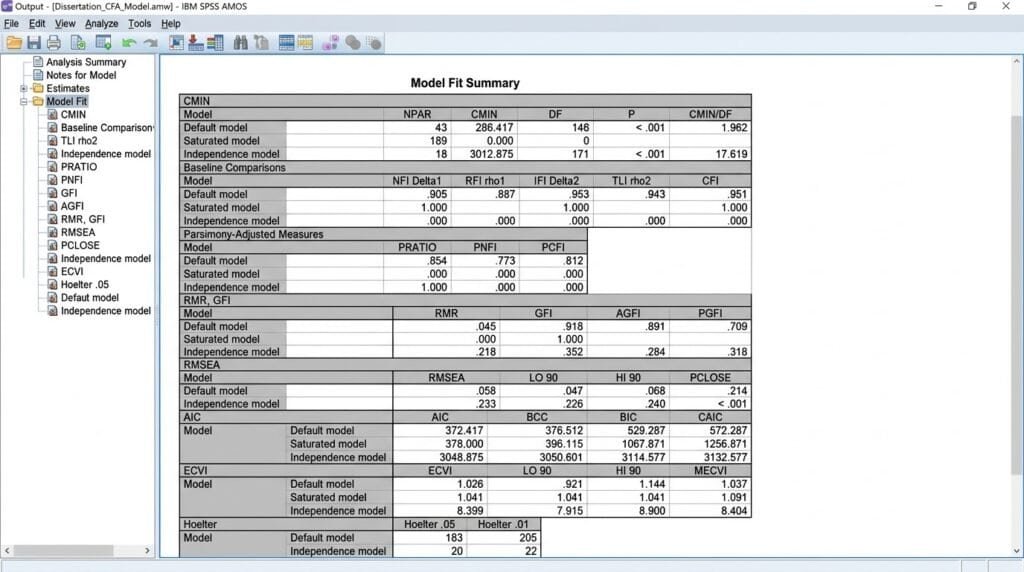
Getting your CFA model fit indices dissertation section right means reading each number in the right order, not just glancing at one column. Here is how to interpret CFA results in AMOS properly, index by index.
Absolute Fit Indices
- Chi-square (CMIN): Tests whether your model-implied covariance matches the data exactly. It almost always comes back significant in large samples, so do not panic over this one alone.
- CMIN/DF: Chi-square divided by degrees of freedom. Under 3 is good, under 5 is acceptable for larger models.
- GFI: Above 0.90 is acceptable, above 0.95 is good. AGFI, its complexity-adjusted version, follows the same logic but is reported less often these days.
- SRMR: Below 0.08 is acceptable, below 0.05 is excellent.
Incremental Fit Indices
- CFI: Compares your model against a baseline “no relationship” model. Above 0.90 is acceptable, above 0.95 is good.
- TLI (also called NNFI): Same logic as CFI, above 0.90 is acceptable.
Parsimony Fit Index
- RMSEA: Below 0.08 is acceptable, below 0.06 is good.
- PClose: This p-value should be non-significant (above 0.05); it tests whether RMSEA is truly below 0.05 in the population.
- Hoelter’s Critical N: AMOS also reports this one, a less discussed index estimating the largest sample size at which your model would still fail the chi-square test. Treat it as a supplementary check, not your main decision-maker.
Quick Reference: CFA Model Fit Indices Cutoff Table
| Index | Acceptable | Good |
|---|---|---|
| CMIN/DF | Below 5 | Below 3 |
| GFI | Above 0.90 | Above 0.95 |
| CFI | Above 0.90 | Above 0.95 |
| TLI | Above 0.90 | Above 0.95 |
| RMSEA | Below 0.08 | Below 0.06 |
| SRMR | Below 0.08 | Below 0.05 |
My honest opinion here, after reading a fair share of methodology chapters over the years. The 0.95 cutoffs for CFI and TLI come from Hu and Bentler’s often cited 1999 simulation study. Several researchers since then, Marsh, Hau and Wen among them, have pointed out that these cutoffs were built under specific conditions. They do not transfer neatly to every model type, so treat them as a strong guideline for your dissertation, not a line you defend to the death in your viva. Hooper, Coughlan and Mullen’s widely cited reporting guidelines echo Kline’s more practical stance here, recommending you report at minimum four indices: the model chi-square, RMSEA, CFI, and SRMR. That is a fair minimum to build your own reporting table around.
What to Do When Your CFA Model Fit Is Poor
This is the part almost nobody writes about properly, and it is exactly why students end up paying someone on Fiverr to “fix” a model without understanding what was actually fixed.
Reading Modification Indices Correctly
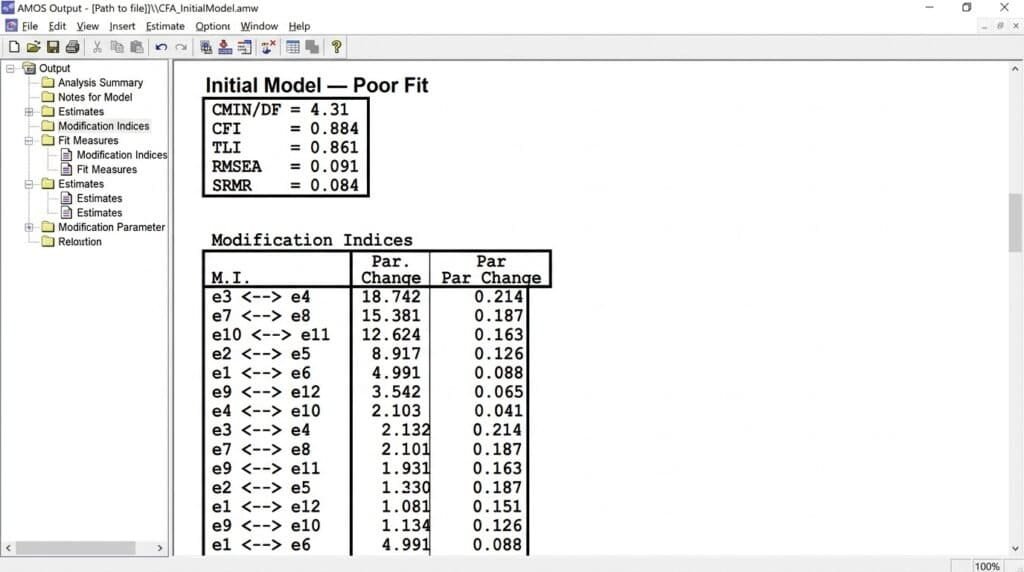
AMOS gives you a Modification Indices table showing how much your chi-square would drop if two error terms were allowed to correlate, or a cross-loading were added. A high number is a diagnostic clue, not permission to make the change.
Justify Changes With Theory, Not Just Numbers
Only correlate two error terms if there is a genuine, defensible reason, such as both items sharing very similar wording or both being reverse-coded from the same sub-scale. If you cannot explain the change to your supervisor in one sentence, do not add it. Examiners specifically look for changes made only to chase better numbers, and flag them as poor practice.
When to Drop an Item Instead
If one item consistently shows a low standardized loading (below 0.50) with no theoretical link to justify a correlated error, dropping that item is usually cleaner and more defensible than forcing the model to fit.
A real example from my practice: I once worked with a PhD researcher in the UK studying job satisfaction among nurses, using a five-item scale for one construct. One item had a loading of 0.31 with no sensible correlated-error justification. We dropped it, reran CFA on four items, and CFI moved from 0.89 to 0.94, RMSEA dropped from 0.09 to 0.06. That single decision saved weeks of fit-chasing.
Checking Convergent and Discriminant Validity After CFA
AMOS does not calculate AVE or Composite Reliability (CR) for you directly. You compute both by hand from the standardized loadings it gives you.
Calculating AVE and CR (Worked Example)
Suppose your construct has four items with standardized loadings of 0.70, 0.75, 0.68, and 0.72.
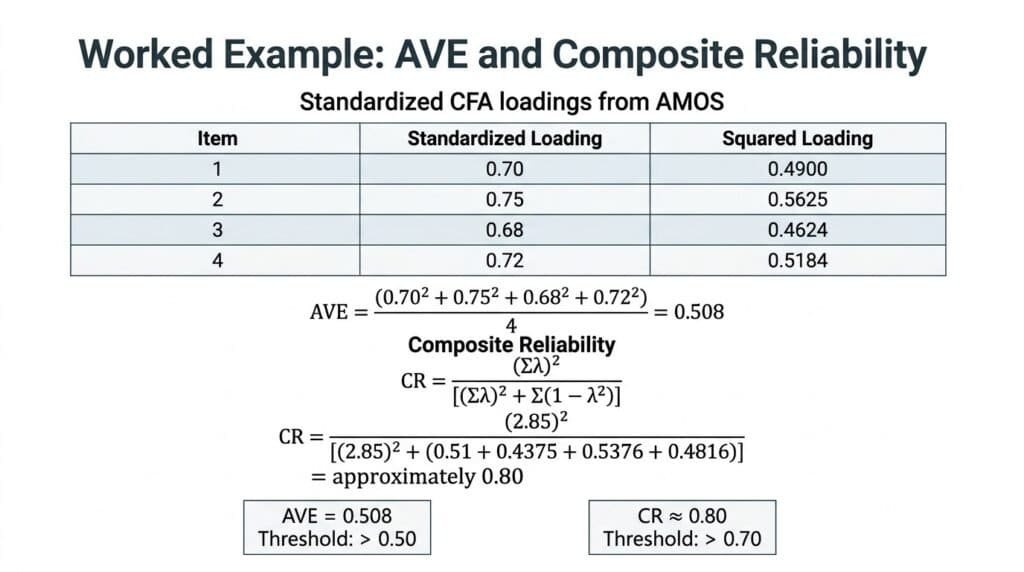
- AVE = average of the squared loadings = (0.49 + 0.5625 + 0.4624 + 0.5184) / 4 ≈ 0.508
- CR = (sum of loadings)² / [(sum of loadings)² + sum of (1 minus loading squared)]
AVE above 0.50 and CR above 0.70 together indicate acceptable convergent validity. If you are running Cronbach’s alpha alongside CR as a reliability check, the Cronbach’s alpha calculator speeds that part up.
Discriminant Validity: Fornell-Larcker Criterion
Take the square root of each construct’s AVE and compare it against that construct’s correlation with every other construct. If the square root of AVE is higher than every correlation, discriminant validity holds, using the criterion Fornell and Larcker proposed in their original 1981 paper.
One thing worth knowing before you lean on this fully: several methodologists have since shown that Fornell-Larcker can miss real discriminant validity problems that a newer method, the heterotrait-monotrait ratio (HTMT), catches more reliably. I still teach Fornell-Larcker first because AMOS output makes it easy to compute, but if your supervisor is SEM-heavy, ask whether they expect HTMT as a supplementary check.
How to Report CFA Results in Your Dissertation (APA 7 Style)
Include one table with standardized factor loadings, AVE, and CR for every construct, and one line reporting overall model fit: chi-square, degrees of freedom, CFI, TLI, RMSEA, and SRMR, each with its value. Follow that with two or three plain-language sentences confirming the model achieved acceptable fit and that convergent and discriminant validity were established, citing the same threshold sources you used.
If your constructs are measured with multi-item measures rather than single items, state this explicitly, since reviewers often ask why CFA was needed at all when a construct has only one indicator.
From CFA to Full SEM: What Comes Next
Once your measurement model passes, you convert the correlation arrows between latent variables into directional regression paths based on your hypotheses, and you are now running a structural model rather than a measurement model. Fit indices are read the same way, but you are now also interpreting path coefficients and significance levels for each hypothesised relationship, and this is usually the stage where mediation or moderation tests come in if your framework calls for them.
FAQ
What is a good CFI value in CFA?
A CFI above 0.90 is acceptable for a dissertation, above 0.95 is considered good under the commonly cited Hu and Bentler thresholds.
What is an acceptable RMSEA value for a dissertation model?
RMSEA below 0.08 is acceptable, below 0.06 is good. Above 0.10 usually signals a genuine model problem.
Can I modify my CFA model in AMOS to fix poor fit?
Yes, but only with a theoretical justification for each change. Modifying purely to chase better numbers, without a defensible reason, is flagged by most examiners as poor methodological practice.
What sample size do I need for CFA in AMOS?
A minimum of 200 respondents is the common working rule, though more complex models with more items need larger samples.
Does AMOS calculate AVE and Composite Reliability automatically?
No. AMOS gives you standardized loadings, and you calculate AVE and CR manually using those loadings, as shown in the worked example above.
What is the difference between EFA and CFA?
EFA discovers factor structure from the data with no prior theory. CFA tests a factor structure you already expect based on theory or an existing validated scale.
What should I do if my standardized factor loading is below 0.5?
A loading below 0.5 usually means that item is not contributing enough to its construct. If there is no theoretical reason to keep it or correlate its error term with another item, dropping it is generally the cleaner fix.
What is the difference between CFA and SEM?
CFA tests only the measurement model, whether your items load correctly onto their latent factors. SEM builds on a confirmed CFA by adding directional paths between the latent factors themselves to test your actual hypotheses.
If your CFA model fit indices in AMOS are still not cooperating after trying the steps above, or you are still unsure whether this is something to fix yourself or get outside help with, you can also book a one-on-one consulting session with me directly.
Written by Siddharth Gupta, dissertation statistics consultant with 12 years of experience guiding PhD and Master’s researchers through SPSS, AMOS, and SEM analysis.
LinkedIn Profile