
Stratified vs Cluster Sampling Sociology Survey, What Your Committee Actually Expects
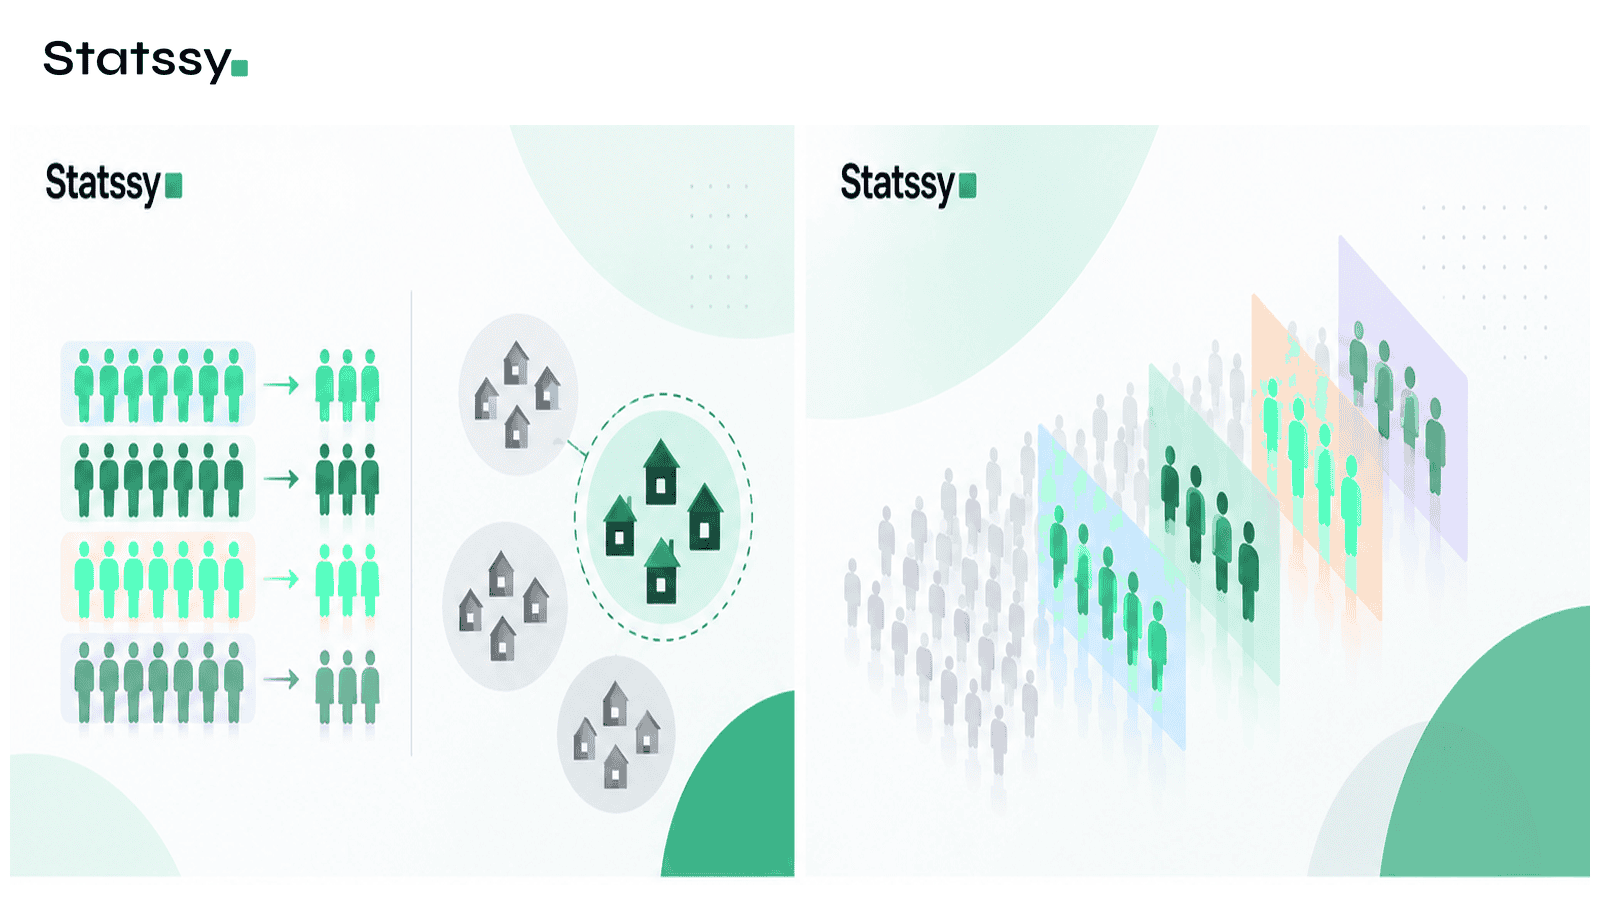
Stratified vs cluster sampling sociology research almost always comes down to one practical question. Are you trying to represent every subgroup in your population, or can you afford to measure a few whole groups instead? I have guided dissertation students through this exact decision for over twelve years. The mix up between these two methods is one of the most common, and most fixable, mistakes I see in methodology chapters.
This comparison covers both methods the way an actual sociology dissertation needs them covered, not the way a market research blog covers them. That means naming the correction most students skip, and showing you a real case where skipping it nearly cost someone their findings.
Where Most Online Guides Get This Comparison Wrong
I read through a dozen comparison pages before writing this one, and almost all of them stop at definitions. They tell you stratified sampling is more precise and cluster sampling is cheaper, then move on. That definition is accurate and incomplete. It skips the one detail that actually gets a dissertation chapter sent back for revision.
Both stratified and cluster sampling sit inside the probability sampling family, where every unit in the population has a known, non zero chance of selection. This is different from non probability methods like convenience sampling or quota sampling, where selection depends on who is easiest to reach. A reader working through stratified vs cluster sampling sociology methods has usually already picked a side in the probability versus non probability debate. The real choice left is between these two probability methods, stratified or cluster.
The gap I rarely see addressed is sampling bias that survives even inside a correctly designed probability sample. A cluster sample can still carry bias if your selected villages or schools differ systematically from the ones you did not select. That difference can exist for reasons entirely unrelated to random chance. Generic guides rarely mention that cluster sampling needs a bias check on the clusters themselves, separate from the respondents sitting inside them.
Stratified Sampling Survey Research in Sociology, What It Actually Means

Stratified sampling is a method where you split your population into subgroups, called strata. Each stratum is based on a characteristic like gender, age group, income band, or caste category. You then draw a random sample from inside each stratum, in proportion to its size in the population. This guarantees that small but important subgroups show up in your sample instead of getting drowned out by chance.
This is classic stratified sampling survey research territory, common in national social attitude surveys and policy perception studies. Sociology students use it constantly for questions on inequality and social attitudes, because these questions genuinely differ by demographic group. If you are studying attitudes toward a new labour law across income groups, a plain random sample might miss your lowest income bracket entirely.
How Strata Get Defined in Social Research
Strata are usually built from variables your committee already expects you to report anyway. Common examples are gender, age bracket, income band, caste category, or education level. The trait only works as a stratum if you have reliable population level data to set your proportions against. Without that data, you are not stratifying, you are just guessing at ratios.
A Real Sociology Example of Stratified Sampling
Say you are researching trust in local police across a city of 200,000 residents, and the city is 55 percent one ethnic group, 30 percent a second, and 15 percent a third. A stratified design pulls samples from each group in those same proportions. Your final 400 respondents will mirror the city’s actual composition, not whatever a lucky or unlucky draw happened to produce.
When Stratified Sampling Fits Your Dissertation
- Your research question depends on comparing subgroups against each other
- You have reliable data on the population proportions for each stratum
- Your committee or funding body expects population level generalisation
- You have the budget and sampling frame to reach every stratum directly
What Cluster Sampling Means in Sociology Survey Research
Cluster sampling works almost the opposite way. Instead of splitting the population by a trait, you split it by naturally occurring groups, called clusters, such as schools, neighbourhoods, workplaces, or villages. You randomly select a handful of these clusters and then survey everyone, or a random subset, inside each one.
Each selected village, school, or neighbourhood here is called a primary sampling unit, or PSU. This is the standard term large organisations like the US Census Bureau use for the first stage group drawn in a multistage design. This is the method fieldwork budgets actually push students toward. Visiting ten villages is far cheaper than individually locating 400 scattered households across a whole district.
A Real Sociology Example of Cluster Sampling
A student researching rural healthcare access does not have a list of every household in the district, so a simple random sample is not even possible. Instead, she randomly selects 8 villages out of 60, then surveys every household within those 8. This is cluster sampling, and it is the only realistic option given her sampling frame.
When Cluster Sampling Fits Your Dissertation
- No complete list of individuals exists, only a list of groups or locations
- Travel, time, or fieldworker cost rules out a scattered individual sample
- Your population is spread across a wide geographic area
- You can accept a slightly less precise estimate in exchange for feasibility
Stratified vs Cluster Sampling Sociology Comparison Table
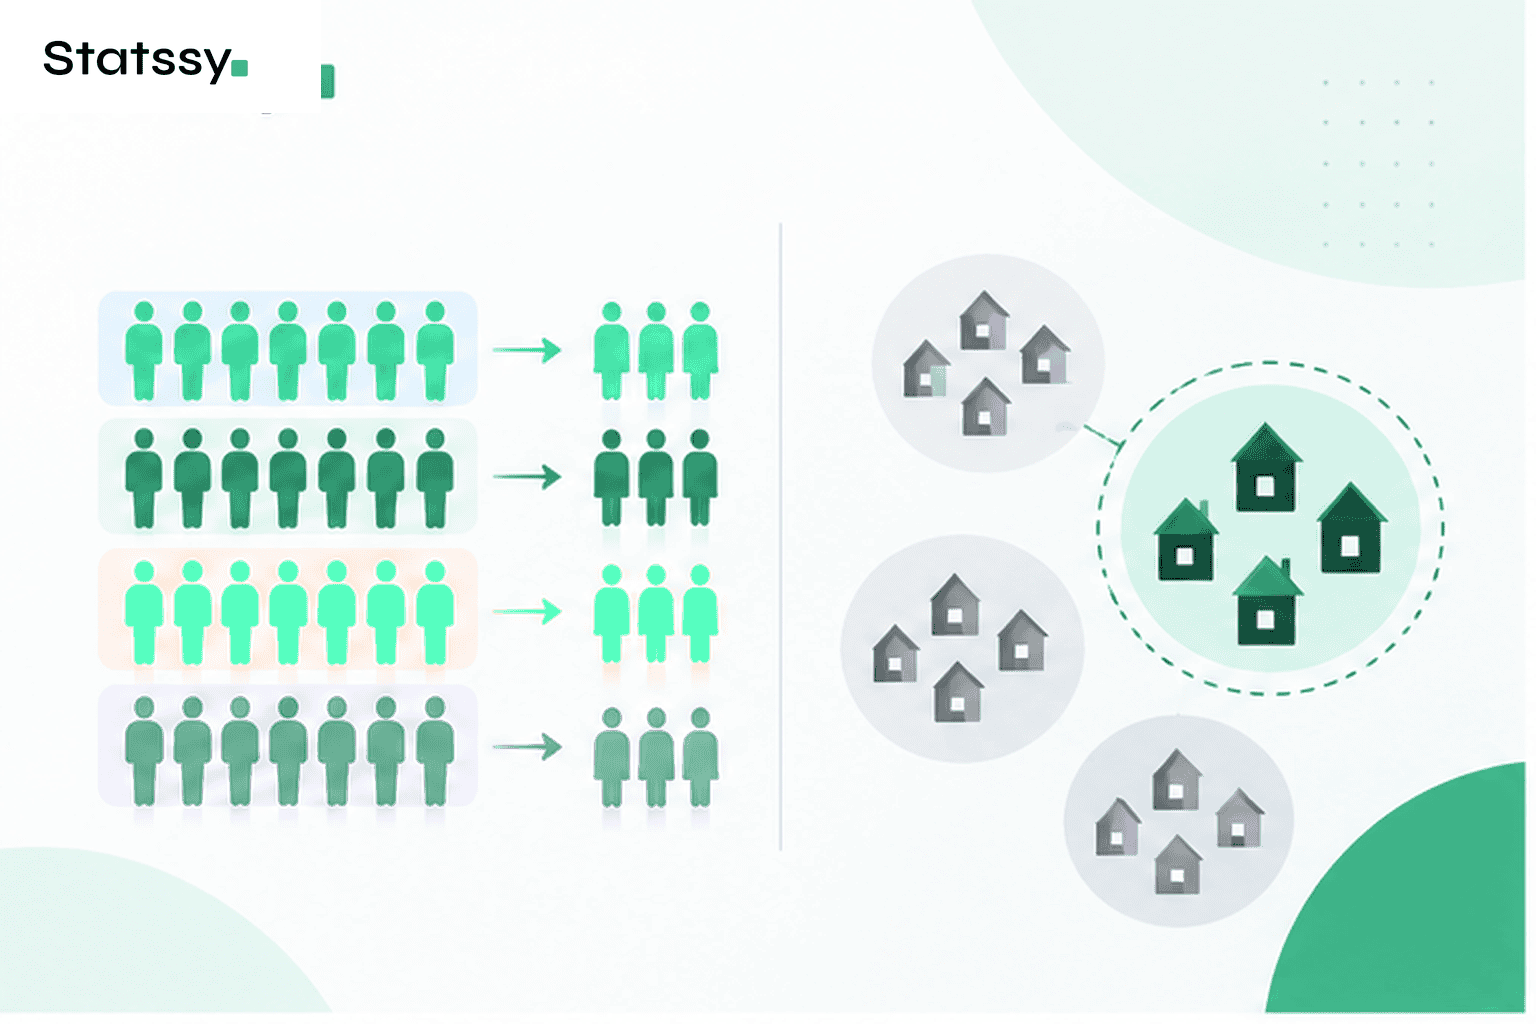
Once you line up stratified vs cluster sampling sociology factors side by side, the real tradeoff becomes obvious. It is never purely a question of which is better. It is a question of which one fits your sampling frame, your budget, and what your committee needs you to claim.
| Factor | Stratified Sampling | Cluster Sampling |
|---|---|---|
| Cost | Higher, requires reaching individuals across every stratum | Lower, fieldwork concentrated in a few locations |
| Time | Slower to plan and execute | Faster once clusters are chosen |
| Precision | Generally higher, smaller standard errors | Generally lower, standard errors inflated by clustering |
| Sampling frame needed | Full list of individuals with the stratifying trait | List of groups only, not individuals |
| What committees expect for population claims | Accepted at face value if proportions are correct | Expected to be corrected for design effect before any population claim is made |
If you remember one row from this table, remember the last one. Cluster sampling without a correction is the single biggest reason committees send methodology chapters back for revision.
Cluster Sampling SPSS Correction Most Students Skip
Here is the part almost every comparison article online leaves out completely. When you sample by cluster, people within the same cluster tend to answer more similarly to each other. That happens simply because they share a neighbourhood, school, or workplace culture. Standard statistical tests assume every respondent is an independent observation. Cluster sampling breaks that assumption.
Design Effect and Why It Matters
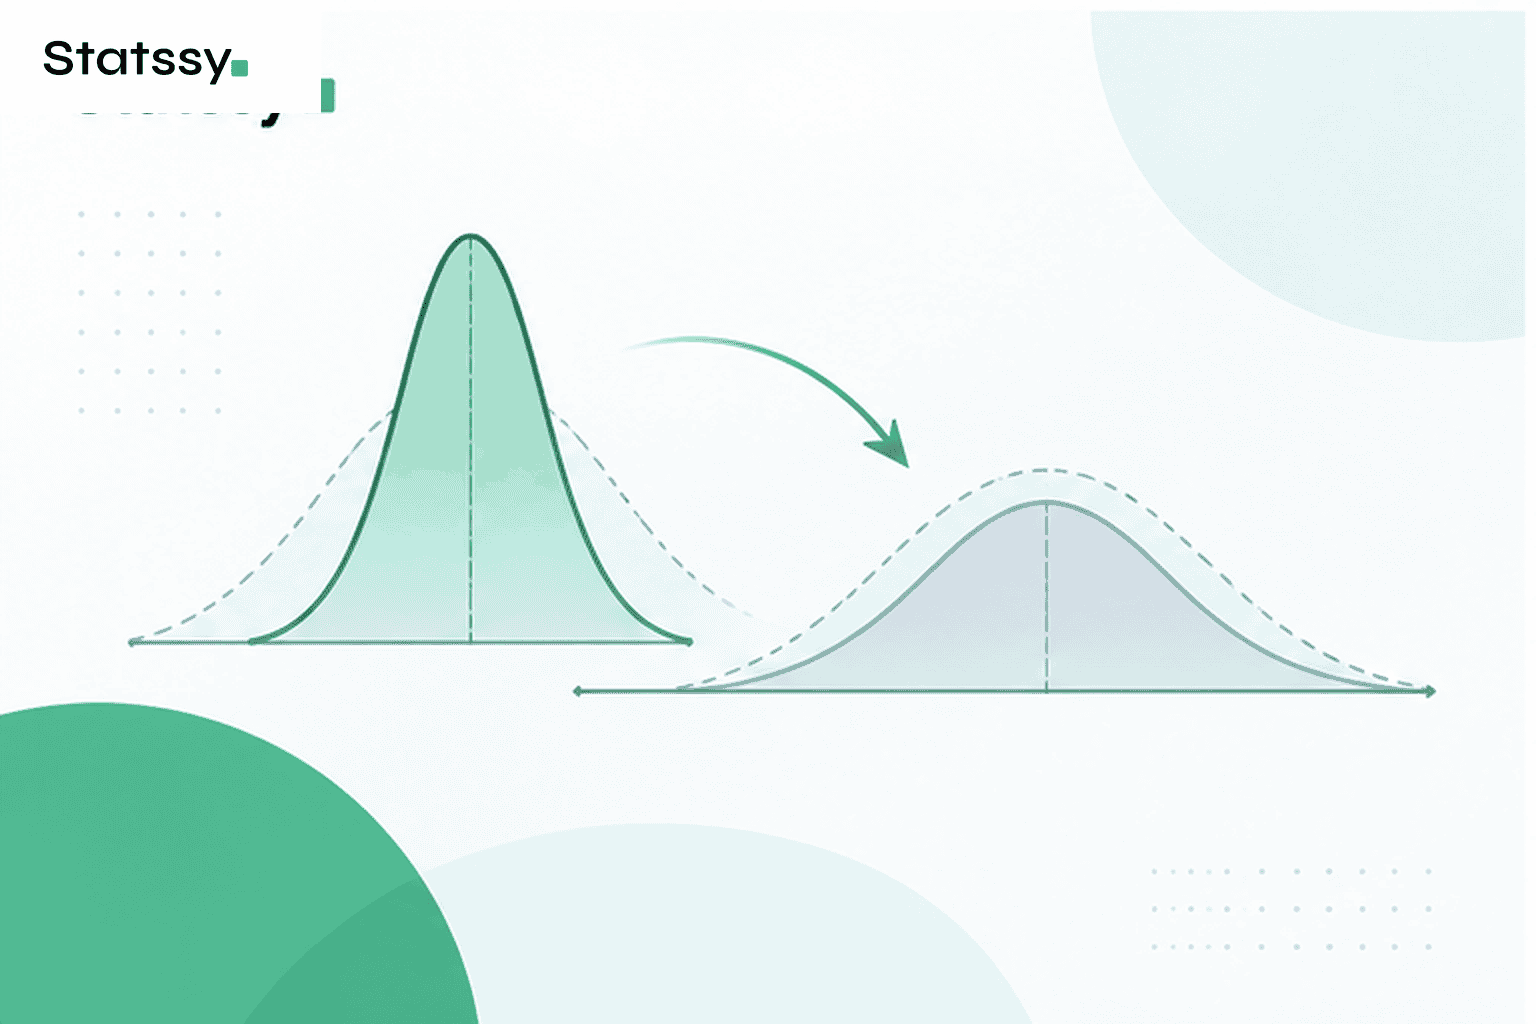
The design effect, often written as deff, tells you how much your variance estimate is inflated compared to a simple random sample of the same size. This is the Kish design effect formula, named after statistician Leslie Kish. It is exactly what a properly configured analysis plan recalculates once you specify your clusters. A deff of 1.5 means your effective sample behaves like it lost about a third of its statistical power. That loss happens even though you collected the full number of surveys.
Intraclass Correlation in Plain Terms
Intraclass correlation, also called ICC or roh, measures how similar people are within the same cluster compared to across clusters. A higher ICC means your clusters are more homogeneous. That pushes your design effect higher and makes your p values look falsely confident if left uncorrected.
SPSS Complex Samples, What It Actually Changes
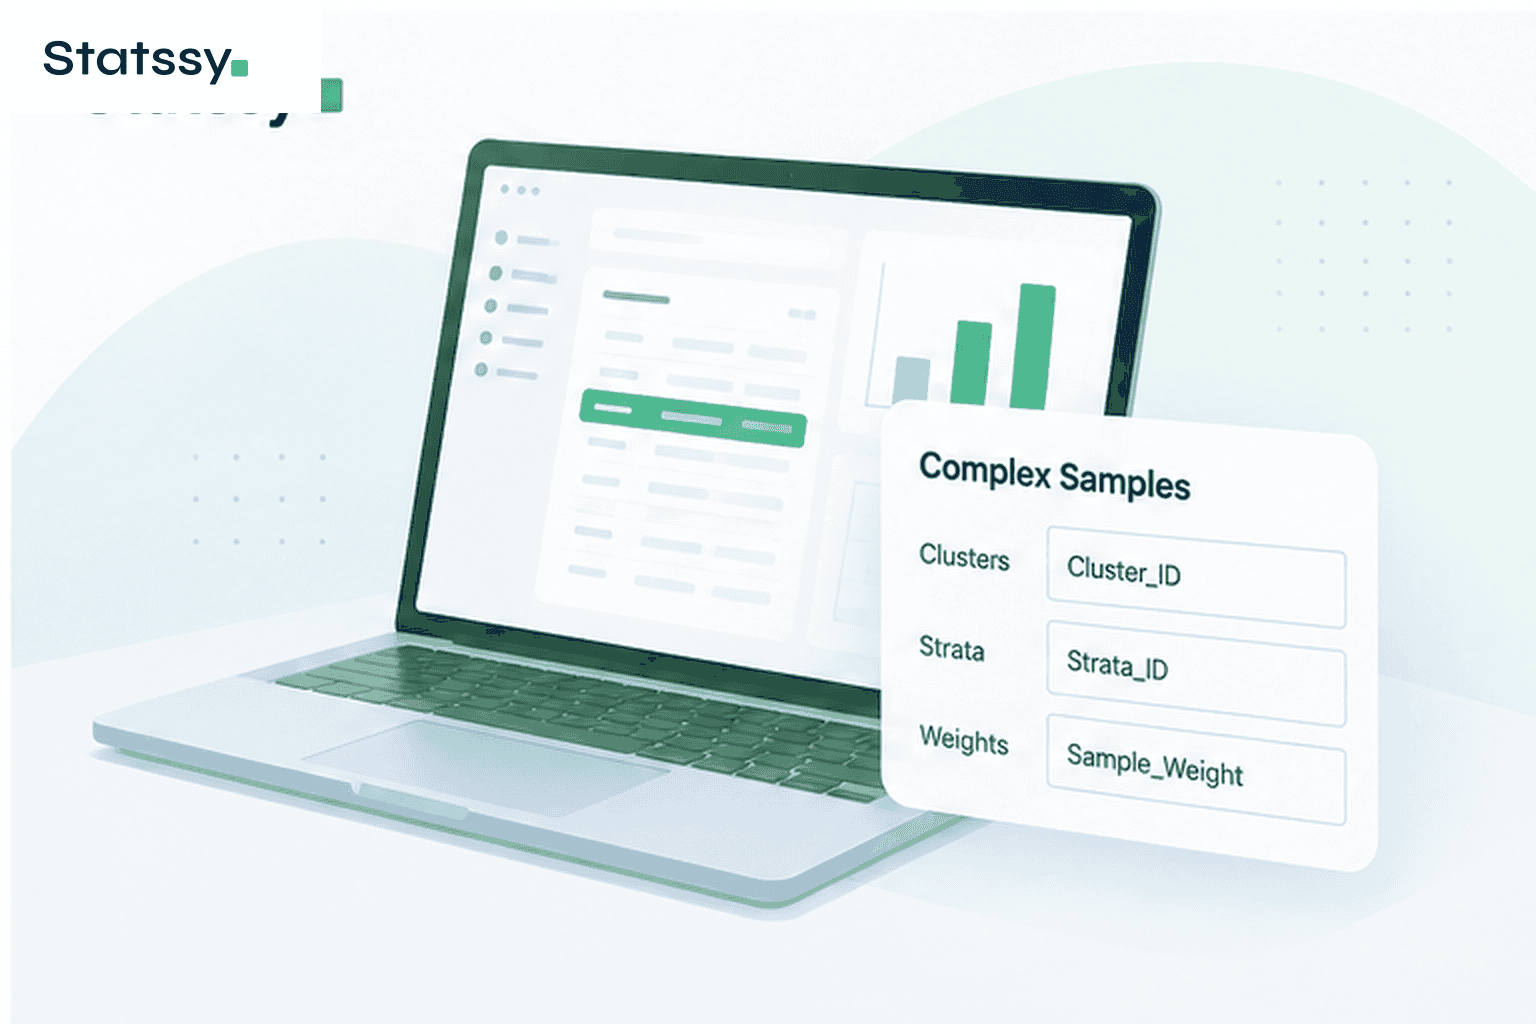
Yes, SPSS can analyse cluster sampling correctly, through a separate module called Complex Samples. Standard procedures like a regular t test or ANOVA assume simple random sampling and will not do this for you automatically. Complex Samples lets you specify your clusters and strata directly, then recalculates standard errors correctly around that structure. That recalculation step is exactly what most students skip entirely. Weighting is a related correction technique that often runs alongside the design effect adjustment, and Complex Samples handles both together.
Case Study, A Student Who Used Cluster Sampling Without Accounting for It
This case shows exactly where stratified vs cluster sampling sociology theory meets a real dissertation deadline. The details below are a composite drawn from patterns I have seen repeatedly across real student cases, with identifying specifics changed throughout. A sociology masters student I worked with was researching community cohesion after a local infrastructure project. She surveyed residents across 10 randomly selected neighbourhoods out of 60 in her city. That is textbook cluster sampling, and a reasonable choice given her budget.
Her problem showed up at the analysis stage, not the design stage. She ran her comparison between neighbourhoods using a standard independent samples t test in SPSS. She treated her 400 respondents as if they were 400 independent draws from the whole city. Her supervisor flagged the chapter, correctly pointing out that residents within the same neighbourhood are not independent of each other in any meaningful statistical sense.
We recalculated her numbers properly.
Her intraclass correlation came out at 0.18, which is moderate for neighbourhood level social attitude data. Her average cluster size was 40 respondents. That gave a design effect of 1 + (40 minus 1) times 0.18, which works out to roughly 8. Her effective sample size dropped from 400 to closer to 50 once the clustering was accounted for.
We reran the analysis using SPSS Complex Samples with her neighbourhoods set as the cluster variable. Two of her three originally significant findings lost significance once the corrected standard errors were applied. That sounds like bad news, but it saved her from presenting findings her committee would have picked apart during the viva. She rewrote her discussion section around the one finding that held up. She also added a clear limitations paragraph explaining the design effect, which her examiner specifically praised.
Five Steps to Correct a Clustered Sample in SPSS
- Identify your cluster variable, usually the village, school, or neighbourhood ID
- Calculate your intraclass correlation and average cluster size
- Calculate your design effect using the deff formula
- Set up a Complex Samples Plan in SPSS specifying your clusters
- Rerun your analysis through Complex Samples procedures rather than standard ones
How to Choose Between Stratified and Cluster Sampling for Your Survey
Ask yourself four questions before you commit to either method. Do you have a full list of individuals in your population, or only a list of groups? Is your research question about comparing demographic subgroups, or about a general population pattern? What is your realistic fieldwork budget and timeline, and what does your committee expect in terms of generalisability?
If you need subgroup comparisons and have individual level data available, stratified sampling is usually worth the extra cost. If your population is geographically scattered with no individual level sampling frame, cluster sampling is often your only workable option. Just make sure you build in the design effect correction from the start. This decision usually gets easier once your overall research design, cross sectional or longitudinal, is already settled. That choice often narrows down your realistic sampling frame.
You can also see a broader side by side comparison of every major sampling method if you want the full picture before committing. If convenience sampling is also on your shortlist, this piece covers whether convenience sampling can still hold up under committee scrutiny.
Sampling Method Sociology Dissertation Committees Expect, How to Justify Yours
Your methodology chapter should name the sampling method directly and explain why it fits your sampling frame and budget. It should also acknowledge the method’s known limitation instead of hiding it. For cluster sampling, that means stating your design effect and intraclass correlation explicitly, not just mentioning that clustering occurred.
Examiners do not expect a perfect sampling design. They expect you to show you understood the tradeoff you made and corrected for it properly. Before you lock in your sampling method, it also helps to confirm whether primary data collection or secondary data actually fits your question. That decision usually comes before the sampling frame question, not after it.
Our sample size calculator can help you work backward from your target design effect to the number of clusters or strata you actually need. For related design decisions earlier in the process, this case study vs survey research design breakdown is worth reading before you finalise your approach.
FAQ
Is cluster sampling less accurate than stratified sampling?
Generally yes, because cluster sampling inflates your standard errors through the design effect, while stratified sampling tends to reduce them. The actual accuracy gap depends on your intraclass correlation. A low ICC can make cluster sampling nearly as efficient as stratified sampling.
Can you combine stratified and cluster sampling in one survey
Yes, this is called a stratified cluster design or multistage sampling. You first divide the population into strata, then randomly select clusters within each stratum, which is common in large national social surveys run by groups like the ESRC’s National Centre for Research Methods.
Can you use cluster sampling in SPSS
Yes. Standard SPSS procedures treat your data as a simple random sample unless you tell it otherwise, so you need the Complex Samples module to set up your clusters correctly before running any test.
How many clusters do you need for valid cluster sampling
Most methodologists recommend a minimum of 20 to 30 clusters for stable variance estimates, though this depends heavily on your expected intraclass correlation and the precision you need.
What happens if you used cluster sampling but analysed it as simple random sampling
Your standard errors will be understated and your p values will look more significant than they really are. This is exactly the mistake covered in the case study above, and it is fixable at the analysis stage if caught before submission.
Does stratified sampling guarantee a representative sample
It guarantees proportional representation on the strata you chose, such as gender or income group, but it does not guarantee representation on characteristics you did not stratify by. Choosing the right stratifying variables matters as much as the method itself.
What is multistage sampling and how is it different from cluster sampling
Multistage sampling applies sampling more than once in sequence, for example selecting districts, then villages within those districts, then households within those villages. Cluster sampling is often just the first or second stage of a larger multistage design.
Still Not Sure Which Method Fits Your Dissertation
If your committee has already flagged your sampling section, or you are still unsure whether your design needs a correction before submission, it is worth getting a second opinion early rather than at the viva stage. This guide walks through the signs it is time to bring in a dissertation expert before your deadline forces the decision for you.
Written by Siddharth Gupta, dissertation and statistics consultant with over 12 years of research guidance experience. Connect on LinkedIn.