
Chi-Square vs Cramer’s V in Sociology – Which One Should You Report
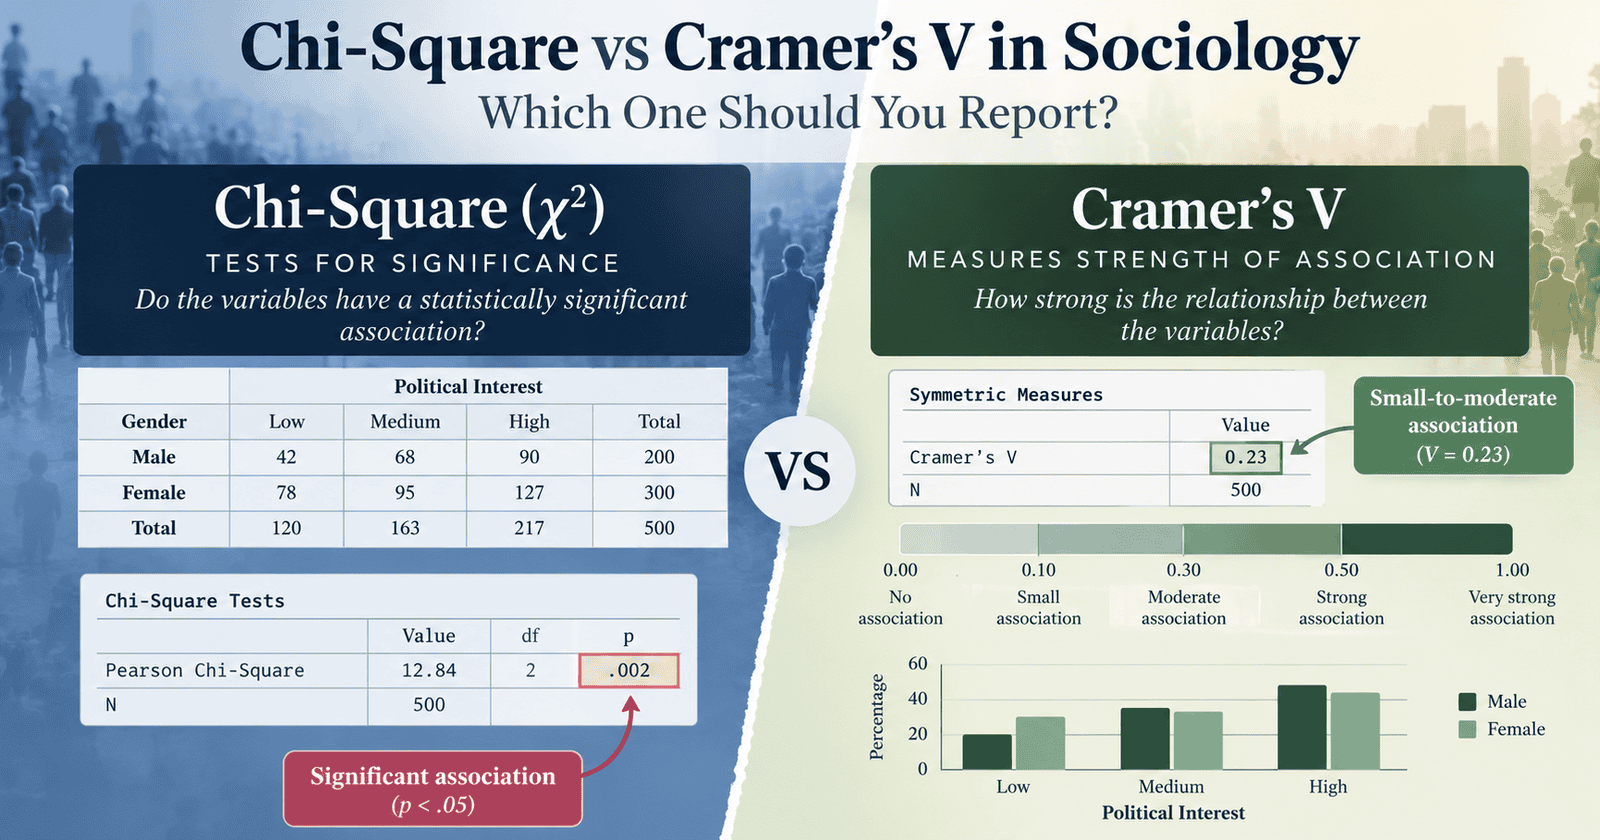
Chi-Square vs Cramer’s V in sociology is the most debatable topic I referee for dissertation students almost every month.
Here is the short version before we get into the rest. Chi-square tells you whether an association between two categorical variables exists at all. Cramer’s V tells you how strong that association actually is. Most sociology committees in the US and UK want both numbers sitting next to each other in your results section, not one or the other.
I am Siddharth, and I have run dissertation and thesis statistics support for twelve years now. Most of my work is with sociology, social policy, and public health students running SPSS crosstabs on survey data, and you can see more of it on LinkedIn. The question of whether to report chi-square or Cramer’s V comes up so often that I built this guide specifically to settle it. Here’s a real example of what happens when a student reports only one.
What Chi-Square Actually Tells You
Chi-square is a test of independence, the same starting definition you will find across research methods texts. It checks whether the pattern inside your contingency table is different enough from what pure chance would produce. Run a chi-square on gender and voting preference, for example, and a significant result tells you these two variables are probably not independent of each other.
That is all it tells you. Chi-square does not say whether the relationship is trivial or massive. A chi-square of 45.2 with a tiny p-value can come from a genuinely strong pattern, or from a large sample size inflating a weak one.
What Chi-Square Leaves Out
A significant chi-square feels like the finish line because SPSS prints a tidy p-value and asterisks next to it. But significant only answers does a relationship exist, not does this relationship matter. Like checking your data with a Shapiro-Wilk test before trusting a parametric result, reading one statistic in isolation here gets students into trouble.
What Cramer’s V Actually Tells You
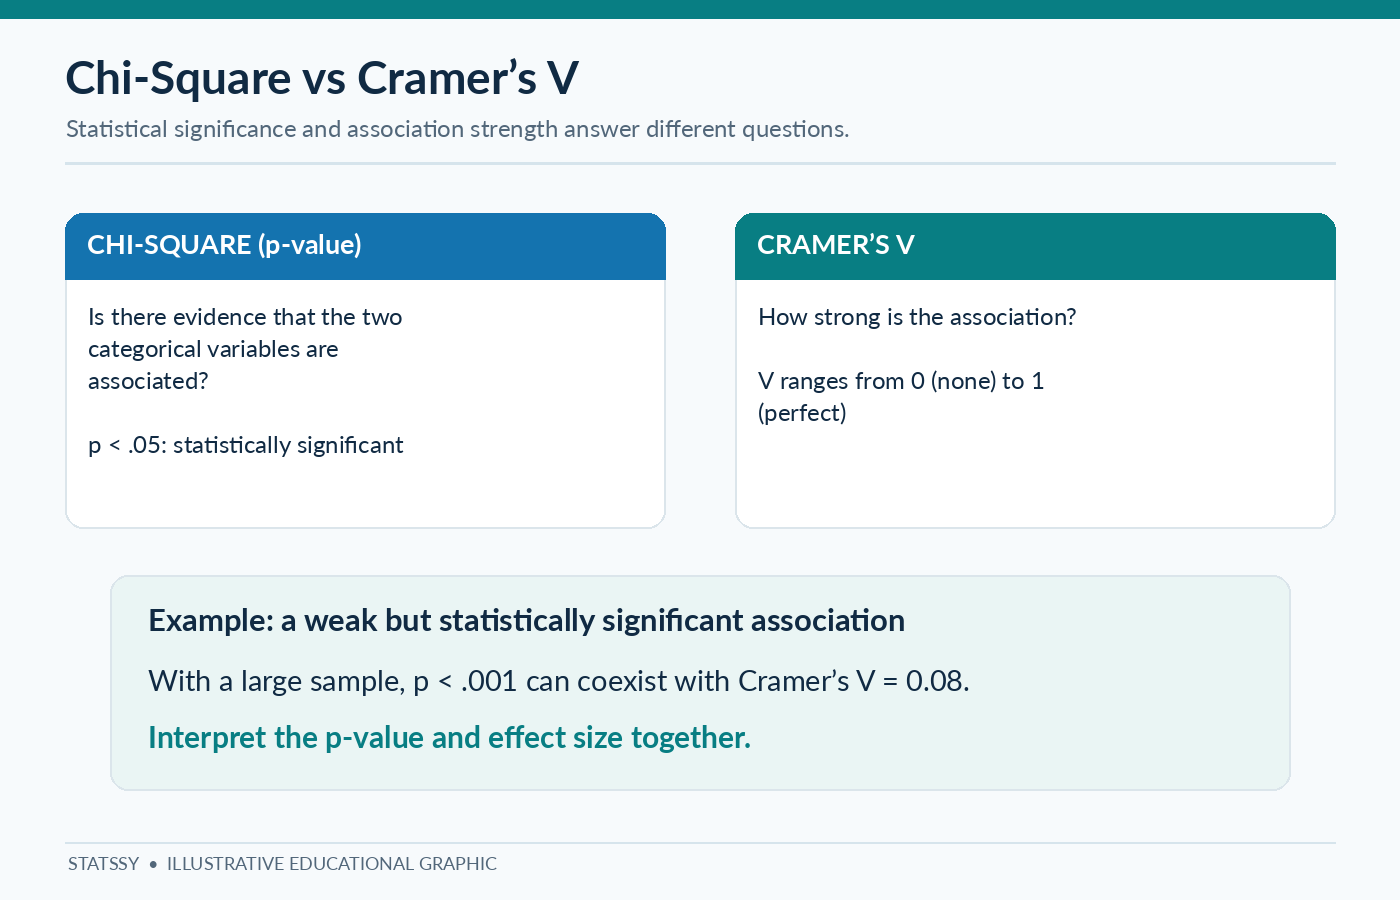
Cramer’s V is an effect size. Where chi-square answers whether an association exists, Cramer’s V answers how strong that association is, on a scale that runs from 0, no association, to 1, a perfect one.
In one line, chi-square tells you if an association exists and Cramer’s V tells you how strong it is. That single sentence is worth memorising, because it is exactly what most committees expect to read in your discussion section.
Why It Is Called an Effect Size
The statistic is named after Harald Cramér, the Swedish statistician who introduced it in 1946. Cramer’s V is calculated directly from the chi-square statistic, but it divides out the sample size and the table dimensions. This is the part competitor guides tend to skip over. A chi-square value on its own grows just by adding more participants, even if the real pattern in the data stays identical. If your variables were continuous instead of categorical, you would be having this same if-and-how-strong conversation over Pearson vs Spearman correlation instead.
A Real Case Study – Sent Back for Missing Effect Size
A student I worked with last year, call her Meera, ran a chi-square test on religiosity and attitudes toward same-sex marriage for her sociology dissertation. Her SPSS output showed chi-square = 38.60, df = 4, p < .001. She wrote one paragraph reporting the test as significant and moved straight to her discussion chapter.
Her supervisor sent the chapter back within a week with one blunt question. Where is your effect size? Significant tells me nothing about how strong this is. Meera had never been taught that chi-square and effect size were two separate things to report, not two ways of saying the same thing.
The Fix Took Under an Hour
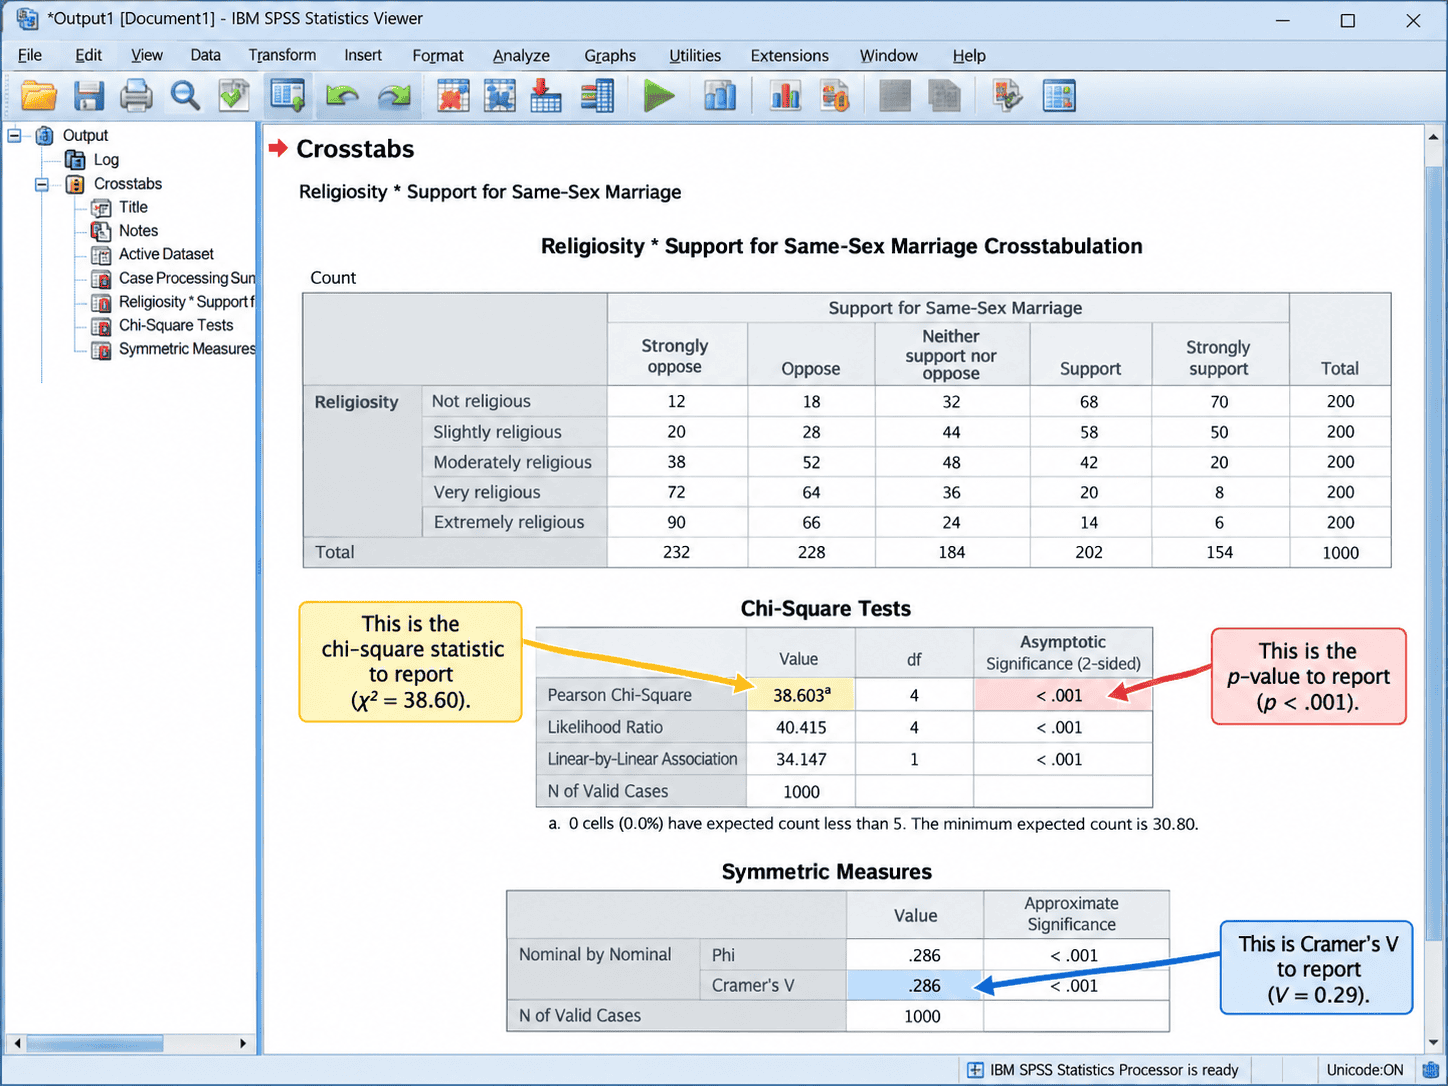
We reopened her SPSS Crosstabs output, ticked Cramer’s V under Statistics, and got V = 0.29. With her table size, that landed in the medium range. We rewrote one sentence combining both numbers, and the chapter went back to her supervisor the same week.
The lesson here is not that Meera made some careless mistake. It is that almost nobody teaches students, clearly, that significance and strength are two different questions requiring two different numbers.
Chi-Square vs Cramer’s V in Sociology – Why Committees Ask for Both
The chi-square vs Cramer’s V question in sociology keeps coming back to this one idea. Statistical significance and practical significance are not the same conversation. Chi-square answers the statistical one, Cramer’s V answers the practical one, and a sociology committee is trained to ask for both because a p-value alone can be misleading.
Large samples make this worse, not better. With survey data running into the thousands, even a genuinely weak association between two variables will often produce a tiny p-value. I have seen a Cramer’s V of 0.08, which is negligible by any standard, attached to a chi-square that was significant at p < .001 purely because the sample had four thousand respondents.
If you only report the chi-square in a case like that, you are technically correct and substantively misleading. I have seen research forums where people ask where to draw the line on an effect size, simply because nobody explained that the line moves with table size. Reviewers in sociology, public health, and social policy programmes know this trap well, which is exactly why effect size has become a standard expectation rather than an optional extra.
How to Get Cramer’s V in SPSS
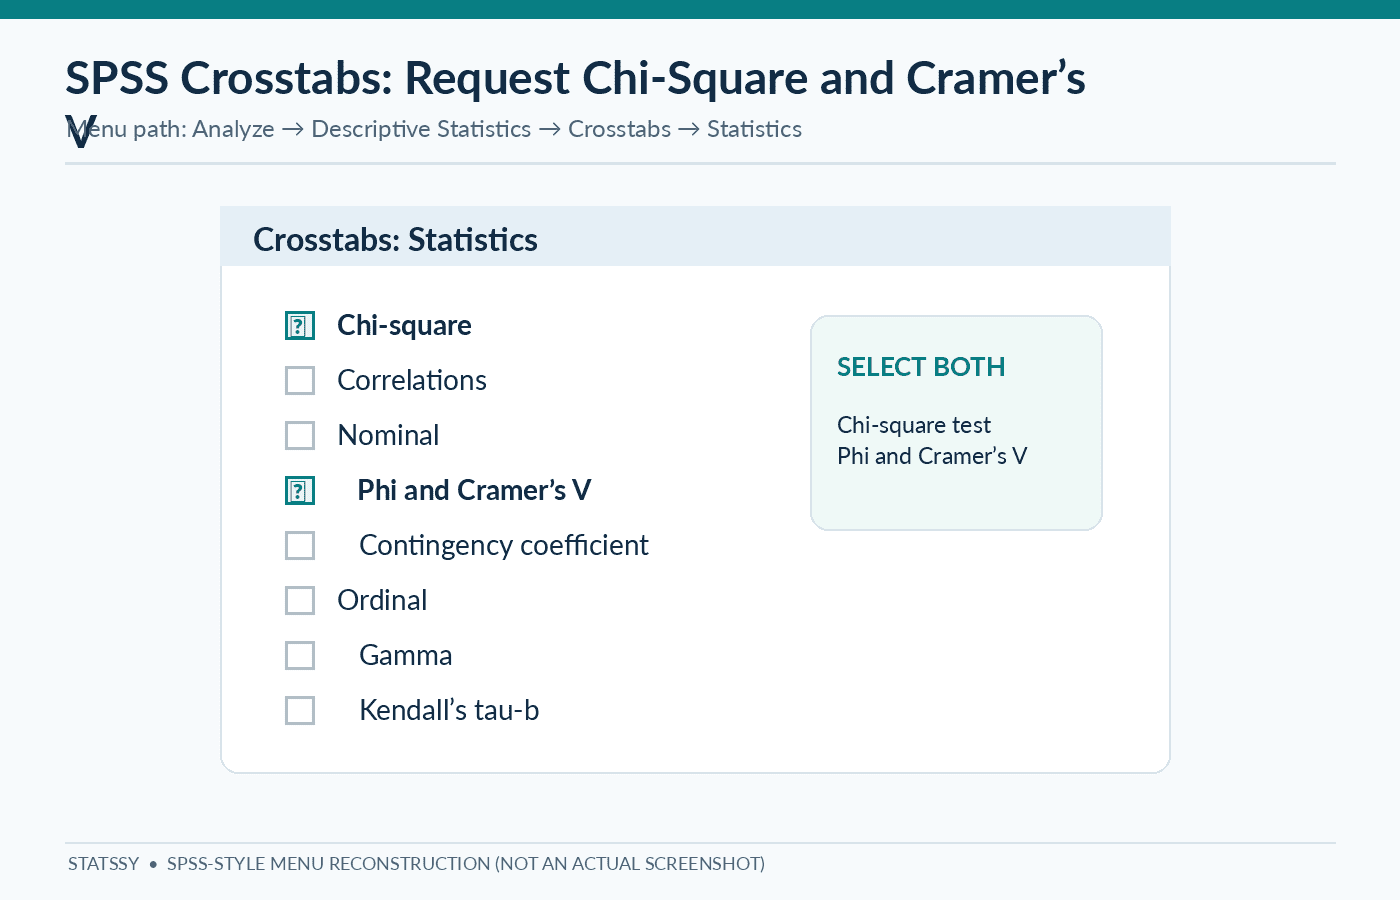
Getting Cramer’s V alongside your chi-square output takes four clicks in SPSS, and most students have already run the hard part of the analysis without knowing the effect size was one tick box away.
- Go to Analyze, then Descriptive Statistics, then Crosstabs
- Put your first categorical variable in Row(s) and the second in Column(s)
- Click Statistics, then tick both Chi-square and Phi and Cramer’s V
- Click Continue, then OK, and read Cramer’s V straight off the Symmetric Measures table
Where Phi and Cramer’s V Get Confused
SPSS prints Phi and Cramer’s V in the same output block, which causes a genuine mistake I see constantly in draft chapters. Phi is only a bounded, interpretable effect size for a 2×2 table. The moment your table is bigger than that, for example a 3×4 table of education level by political affiliation, phi can exceed 1.0 and stops meaning anything. Cramer’s V is built to stay bounded between 0 and 1 regardless of table size, so for anything larger than 2×2, Cramer’s V is the number you report, not phi. This same which-one-to-report dilemma shows up in ANOVA post-hoc testing too, deciding between Tukey HSD and Games-Howell.
When Chi-Square Assumptions Fail
Chi-square only behaves itself when every expected cell count in your table is 5 or higher. Drop below that, particularly in a small 2×2 table, and the test stops being reliable regardless of what Cramer’s V tells you afterward.
When expected counts run low, switch to Fisher’s exact test instead of chi-square. SPSS prints Fisher’s exact test automatically in the same Crosstabs output whenever your table is 2×2 and the assumption is violated, so you often already have the correct number sitting in your output without realising it.
Effect Size for Chi-Square Beyond SPSS
Not every student has SPSS open, and some committees want to see that you understand the formula, not just the menu path, so here is the manual version.
Cramer’s V is calculated as the square root of chi-square divided by the sample size times the smaller of rows minus 1 or columns minus 1.
V = \sqrt{\dfrac{\chi^2}{N \cdot \min(r-1,\, c-1)}}
Most of the stats sites I checked while researching this piece just paste that formula and stop there, which is not very useful if you cannot picture what the pieces mean. N is your total sample size. The min(r-1, c-1) part accounts for how big your table is. That is exactly why a 2×2 table and a 5×5 table need different thresholds for what counts as a strong relationship, something I get to in the next section.
For a 2×2 table specifically, phi and Cramer’s V are mathematically identical, so either one is correct.
Interpreting Cramer’s V Correctly
A Cramer’s V of 0.3 is not automatically a medium effect, which is exactly where the chi-square vs Cramer’s V question in sociology gets genuinely tricky. Whether it counts as small, medium, or large depends on your table’s degrees of freedom, and this is the single most commonly skipped detail across the SPSS tutorials I found while researching this piece.
Jacob Cohen set the original benchmarks in 1988, and they shrink as the table grows.
| Degrees of Freedom (df*) | Small | Medium | Large |
|---|---|---|---|
| 1 | 0.10 | 0.30 | 0.50 |
| 2 | 0.07 | 0.21 | 0.35 |
| 3 | 0.06 | 0.17 | 0.29 |
| 4 | 0.05 | 0.15 | 0.25 |
df* is the smaller of rows minus 1 and columns minus 1, the same value used inside the Cramer’s V formula itself.
So a V of 0.25 on a 2×2 table, df* = 1, sits only in the small to medium range. The same 0.25 on a 5×5 table, df* = 4, would already count as large. Reading the raw number without checking it against your table size is the most common misinterpretation I see in draft chapters. This same df-adjusted table turns up in peer-reviewed methods research too, not just textbooks.
Reporting Categorical Association in Sociology the APA Way
Once you have both numbers, the write-up is one sentence, not two paragraphs. APA’s own statistics reporting conventions want chi-square, degrees of freedom, sample size, p-value, and the effect size reported together. All of it belongs to the single test, not treated as separate findings.
Here is the template I hand to every student.
“A chi-square test of independence showed a significant association between [variable 1] and [variable 2], chi-square(df, N = sample size) = value, p = value, Cramer’s V = value, indicating a [small/medium/large] effect.”
Applied to Meera’s case from earlier, that becomes this.
“A chi-square test of independence showed a significant association between religiosity and attitudes toward same-sex marriage, chi-square(4, N = 310) = 38.60, p < .001, Cramer’s V = 0.29, indicating a medium effect.”
That single sentence, with the effect size and its size label included, is usually enough to stop a committee from sending the chapter back for exactly the reason Meera’s was.
Common Mistakes Sociology Students Make
These are the three mistakes that turn a clean chi-square vs Cramer’s V write-up into a resubmission.
Reporting Significance Without Effect Size
This is the single biggest gap I see in draft chapters, and it is the entire reason this guide exists. A p-value alone answers only half the question a committee is asking.
Using Phi Instead of Cramer’s V on Bigger Tables
Phi only behaves itself on a 2×2 table. Anything larger and it can print a number above 1.0, which a careful examiner will flag immediately as the wrong statistic reported.
Treating Significant and Strong as the Same Word
A large sample can make almost any relationship statistically significant. Significant means the relationship is probably real. Strong, which is what Cramer’s V measures, means the relationship actually matters. Reading one statistic in isolation causes trouble well beyond this test too, the same trap catches students interpreting a Durbin-Watson statistic without checking the bounds around it first.
Quick Reporting Checklist
Before you submit any chapter that settles chi-square vs Cramer’s V for your sociology data, run through this list.
- Chi-square statistic, degrees of freedom, sample size, and p-value are all reported
- Cramer’s V is reported alongside it, not in a separate table nobody reads
- You checked the df-adjusted threshold table rather than assuming 0.3 means medium
- You used Cramer’s V, not phi, for any table bigger than 2×2
- Your one results sentence follows the APA template, with the effect size labelled small, medium, or large in plain words
A chapter like this sometimes needs more than a checklist. If yours does, here’s how to tell whether you need a dissertation expert’s eyes on it.
FAQ
Is Cramer’s V the same as effect size
Yes. Cramer’s V is one specific type of effect size, built for categorical data in a contingency table. Chi-square is not an effect size on its own.
What is a good Cramer’s V value
It depends on your table’s degrees of freedom. On a 2×2 table, 0.5 and above is large. On a 4×4 table, anything above 0.25 already counts as large. Always check the threshold against your table size before deciding.
How do I calculate Cramer’s V in SPSS
Go to Analyze, then Descriptive Statistics, then Crosstabs, then tick Phi and Cramer’s V under the Statistics button. SPSS prints it in the Symmetric Measures table.
Can Cramer’s V be used for any size contingency table
Yes, which is exactly why it is preferred over phi for anything bigger than a 2×2 table. Phi is only reliable at 2×2.
How do I report Cramer’s V in APA format
Report it inside the same sentence as your chi-square result, written as Cramer’s V = value, directly after your p-value, with a word label such as small, medium, or large.
What effect size should I report alongside a chi-square test
Cramer’s V, for any table bigger than 2×2. For a 2×2 table specifically, phi and Cramer’s V give you the identical number, so either label is accurate.
What if my chi-square assumptions are violated
Switch to Fisher’s exact test if your expected cell counts drop below 5, which is common in small 2×2 tables. SPSS reports Fisher’s exact test alongside chi-square automatically for 2×2 tables, so check that output before deciding your chi-square result was even valid in the first place.