
Binary vs Multinomial Logistic Regression Sociology Guide for Categorical Outcomes
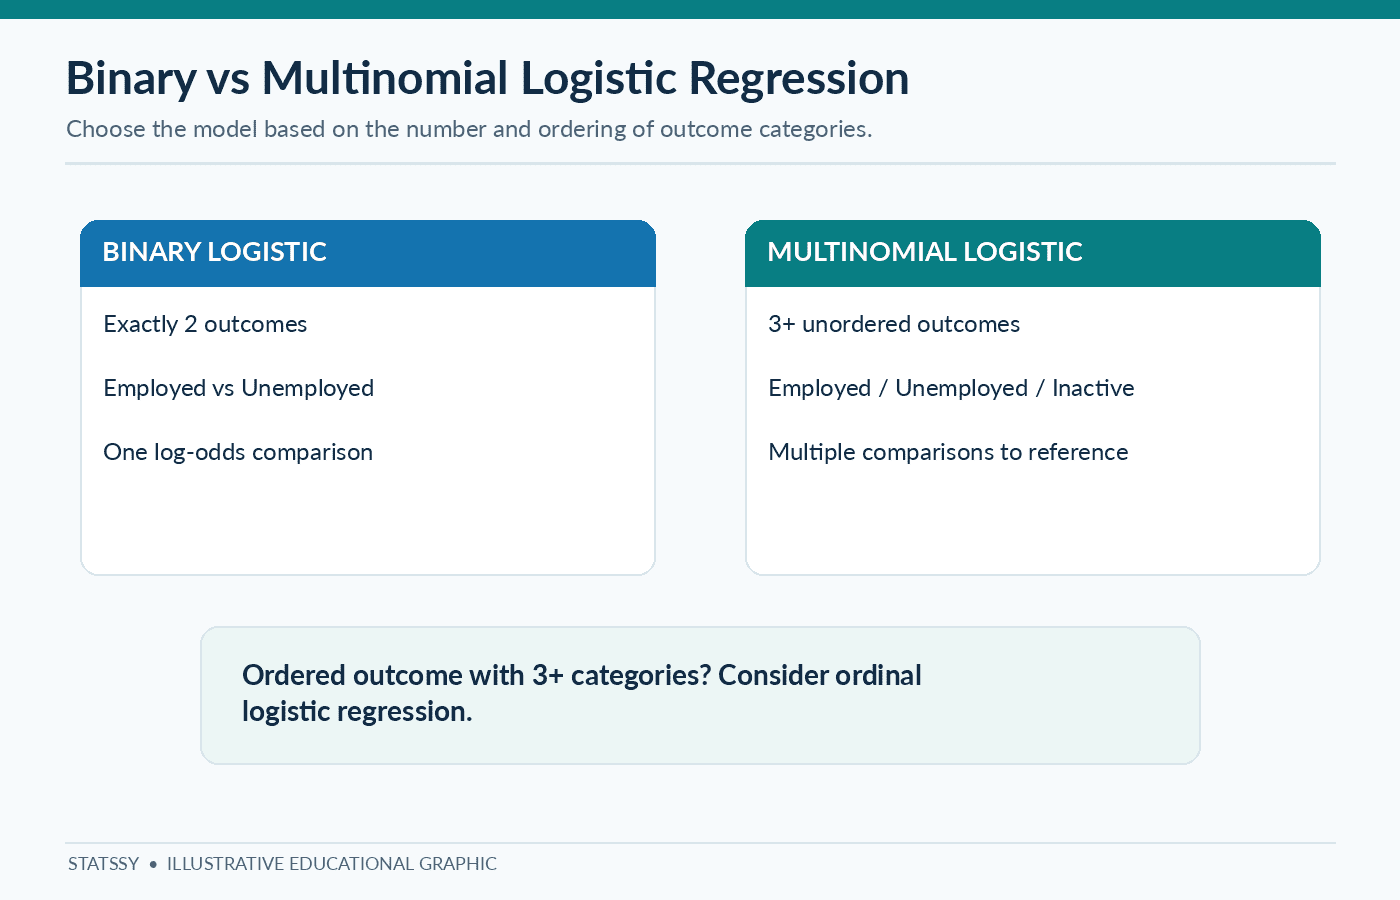
Binary vs multinomial logistic regression sociology mix-ups show up in my inbox every single month, usually from a student two weeks from submission who has just been told their model is wrong.
Here is the direct answer first. Use binary logistic regression only when your outcome variable has exactly two unordered categories, for example employed vs unemployed. The moment your outcome has three or more unordered categories, like employment status split into employed, unemployed and economically inactive, you need multinomial logistic regression instead, not binary, and not ordinal unless those categories actually have a natural order.
I have spent twelve years helping sociology students fix exactly this confusion in their dissertation data chapters. This guide walks through the difference in plain language, a real decision table, a case study of a student who got this wrong, and the SPSS steps to run it correctly the first time.
Binary Logistic Regression vs Multinomial Logistic Regression at a Glance
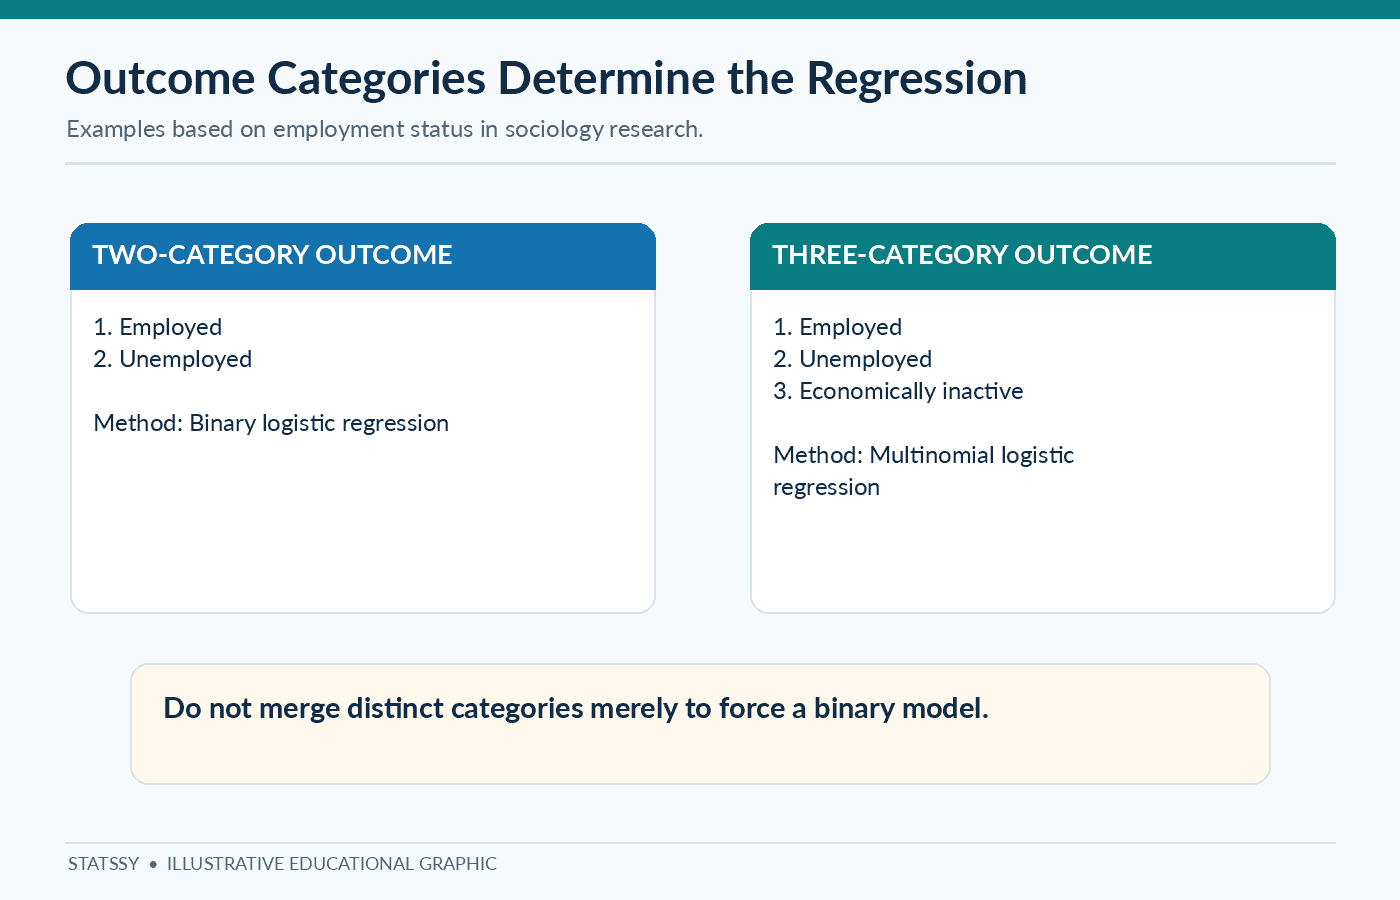
Here is the comparison I draw for students before anything else.
| Binary Logistic Regression | Multinomial Logistic Regression | |
|---|---|---|
| Number of outcome categories | Exactly two | Three or more, unordered |
| Example outcome | Employed vs unemployed | Employed, unemployed, economically inactive |
| SPSS menu path | Analyze, Regression, Binary Logistic | Analyze, Regression, Multinomial Logistic |
| Coefficient sets produced | One | One per non-reference category |
| Use it when | Your outcome is genuinely two-sided | Your outcome has three or more groups with no natural order |
What a Categorical Outcome Variable Means in Sociology
I define it for my students like this, a categorical outcome variable in sociology is any dependent variable sorted into named groups rather than measured as a number. It is not something you calculate an average for. It is something you count and classify, group by group.
Sociologists run into this constantly. Employment status, religious affiliation, voting preference, marital status and social class are all categorical outcome variables, and each one needs a specific type of logistic regression depending on how many categories it holds and whether those categories have a real order.
Nominal vs Ordinal Categorical Variables
A nominal variable has categories with no natural ranking. Religious affiliation is nominal. Hindu, Muslim, Christian and Sikh are not higher or lower than each other, they are just different groups.
An ordinal variable has categories that do have a natural order, even if the gap between them is not measured precisely. Social class, in some classification schemes, is treated as ordinal, working class sitting below middle class sitting below upper class.
This distinction decides your statistical model. Get it wrong and your entire results chapter becomes indefensible at viva.
Common Sociology Examples
- Employment status (employed, unemployed, economically inactive) – nominal, three unordered categories
- Social class (NS-SEC categories) – treated as nominal in most modern sociology research
- Marital status (never married, married, divorced, widowed) – nominal
- Highest qualification level (no qualification, secondary, degree, postgraduate) – ordinal
If your outcome variable looks like any of these with three or more categories, you are already past the point where binary logistic regression works for you.
Binary Logistic Regression, the Two-Category Case
I always start here. Binary logistic regression predicts the odds of one of exactly two outcomes happening, pass or fail, employed or unemployed, yes or no. It is the simplest member of the logistic regression family, and it is the model most students learn first, which is exactly why it gets misapplied so often.
When Your Outcome Is Genuinely Two Options
Binary logistic regression is the right choice only when your dependent variable truly collapses into two mutually exclusive groups and nothing is left out. If you are predicting whether a respondent voted or did not vote, that is binary. If you are predicting which of four political parties they voted for, that is not binary anymore, no matter how tempting it is to force it into a yes/no shape.
What Binary Logistic Regression Cannot Do
Binary logistic regression cannot model three or more unordered categories correctly. Students sometimes try to force a workaround, recoding a three category outcome into two binary models run separately, say employed vs not employed and then unemployed vs not employed. This throws away information and inflates your type one error rate across the two separate tests. It also gives an examiner an easy, fair reason to send your results chapter back.
Multinomial Logistic Regression, the Three-or-More Unordered Category Case
This is the model I reach for most often in sociology dissertations. Multinomial logistic regression extends binary logistic regression to outcome variables with three or more categories that have no natural order, and instead of one equation, it builds several at once, each comparing one category against a reference category you choose.
How It Compares Categories Against a Reference
Say your outcome is employment status with three categories, employed, unemployed and economically inactive. If you set employed as your reference category, multinomial logistic regression produces two sets of coefficients, one comparing unemployed to employed, one comparing economically inactive to employed. Every predictor in your model gets interpreted twice, once for each contrast.
Choosing the Right Reference Category
Pick a reference category that makes substantive sense for your research question, usually the largest group or the group every other category is naturally compared against. Employed works well as a reference for employment status. For social class, researchers often use the middle category or the largest NS-SEC group as the reference, since comparing extremes to a middle point tends to be more interpretable than comparing extremes to each other.
In SPSS, you set this under Analyze, Regression, Multinomial Logistic, and then under the Reference Category button inside that dialog box.
Binary vs Multinomial Logistic Regression Sociology Decision Table
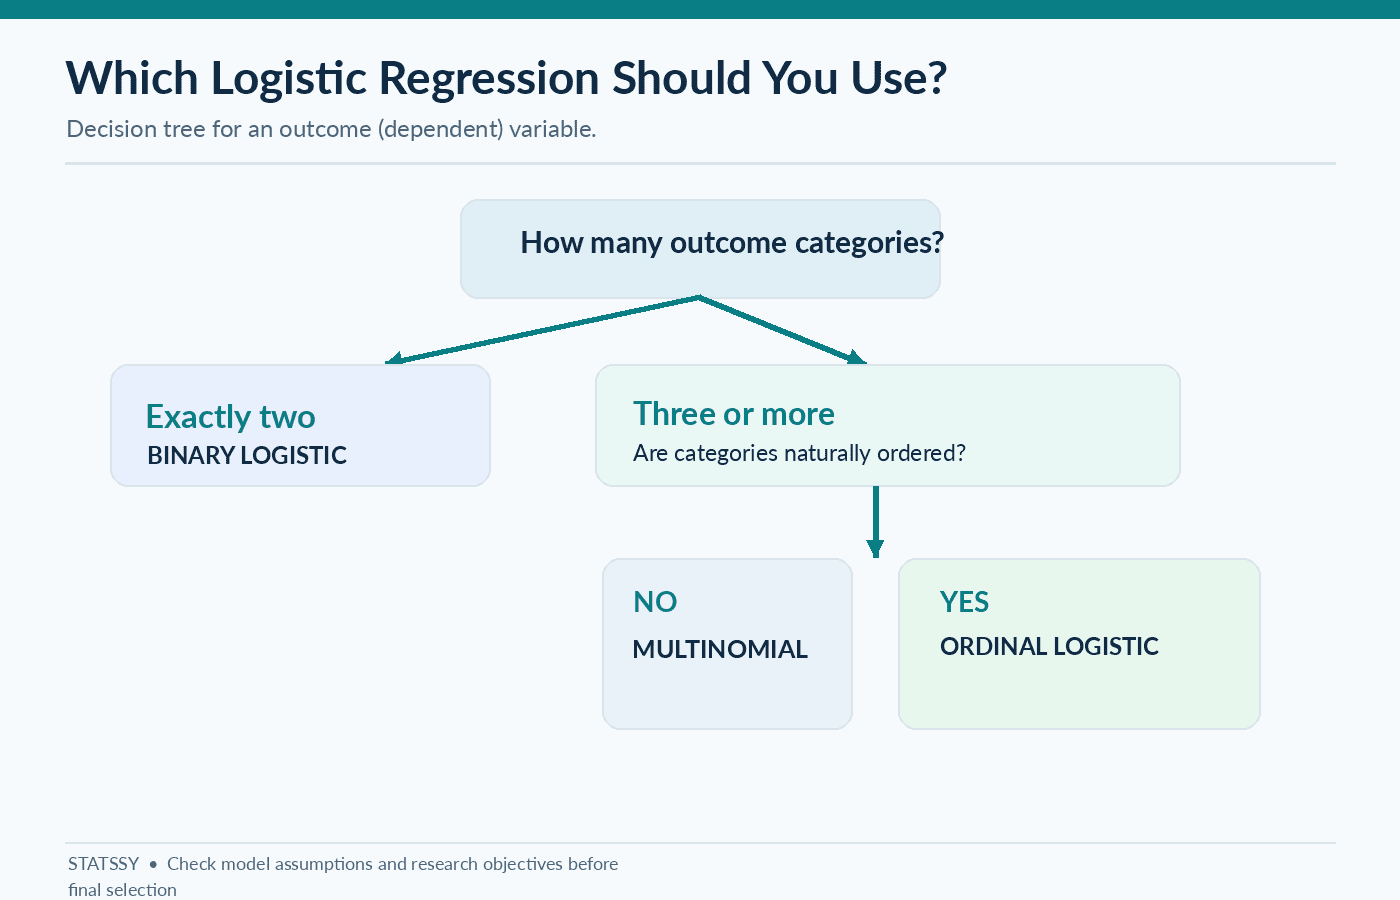
This is the part I ask every dissertation student to screenshot. Three questions, answered in order, tell you exactly which model you need.
- How many categories does your outcome variable have. Exactly two, binary logistic regression. Three or more, move to question two.
- Do those three or more categories have a natural order. No order, multinomial logistic regression. A real order, move to question three.
- Is the order strong enough that you are comfortable assuming the effect of each predictor is the same across every step of that order. If yes, ordinal logistic regression. If you are not confident in that assumption, multinomial logistic regression is still the safer, more defensible choice.
| Number of categories | Ordered | Correct model |
|---|---|---|
| 2 | Not applicable | Binary logistic regression |
| 3 or more | No | Multinomial logistic regression |
| 3 or more | Yes, proportional odds holds | Ordinal logistic regression |
| 3 or more | Yes, but unsure | Multinomial logistic regression |
Where Ordinal Logistic Regression Fits In
Ordinal logistic regression is built for genuinely ordered categories, like qualification level or a Likert scale. It assumes something called proportional odds, meaning each predictor has the same effect at every step up the order. That assumption fails often enough in social science data that many sociology dissertations, including social class models, end up using multinomial logistic regression instead, treating class as a set of distinct groups rather than forcing a strict order onto it. Choosing between these research tools the way you would choose between Pearson and Spearman correlation comes down to what your data can actually support, not what looks simplest on paper.
Case Study, the Student Who Used Binary Logistic Regression on a Three-Category Outcome
This is a composite case built from patterns I have seen across several dissertation reviews, not one identifiable student.
What Went Wrong and Why SPSS Did Not Stop Them
A master’s student in sociology was studying predictors of employment status among young adults in a regional UK sample. Employment status had three categories, employed, unemployed and not in the labour force. She opened Analyze, Regression, Binary Logistic in SPSS, recoded her outcome into two groups by combining unemployed and not in the labour force into one category labelled not employed, and ran the model. SPSS did not warn her, because SPSS runs whatever test you ask it to run, it has no idea what your research question actually needs.
What the Examiner Flagged
Her internal examiner caught it immediately at the viva stage, three weeks before final submission. The two groups she had merged were conceptually different, unemployed people are actively seeking work, people not in the labour force often are not, for reasons that matter to a labour market study. Merging them had quietly erased the exact distinction her research question depended on.
How It Was Fixed Before Resubmission
She reran the analysis as multinomial logistic regression with employed set as the reference category, keeping all three groups intact. The corrected model took about four hours of rework, not the two weeks she feared, because her predictor variables and dataset did not change, only the test and the output interpretation did. Her final results were stronger, not weaker, because two of her predictors behaved very differently for the unemployed group compared to the not in labour force group, a finding she would have missed entirely under the binary model. If you are not sure whether your own results chapter has a similar gap, these signs you need a dissertation expert’s review are worth checking before your supervisor does.
Running Multinomial Logistic Regression in SPSS
I am covering multinomial logistic regression spss specifically here, since SPSS remains the most common software in sociology departments across the USA and UK. The same decision logic applies directly if you are running this in R or Stata instead.
Step by Step SPSS Navigation
- Go to Analyze, Regression, Multinomial Logistic.
- Move your categorical outcome variable into the Dependent box.
- Click Reference Category and choose the group you want every comparison measured against.
- Move your predictor variables into the Factor(s) box if categorical, or the Covariate(s) box if continuous.
- Click Statistics and tick Pseudo R Square, Classification Table and Parameter Estimates.
- Click Continue, then OK.
Reading and Reporting the Exp(B) Output
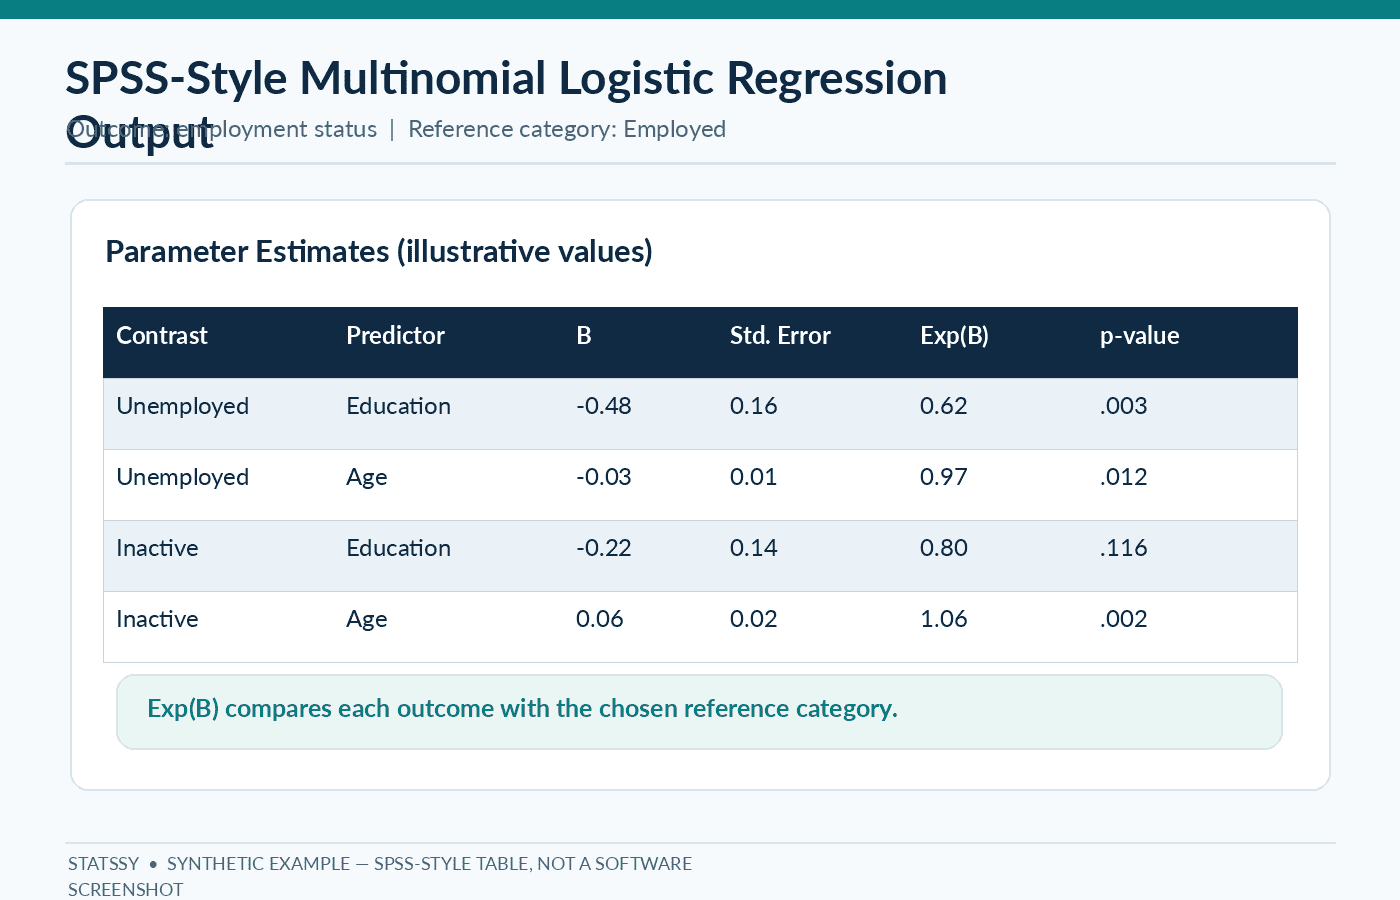
SPSS gives you one block of coefficients per non-reference category. An Exp(B) above 1 means a predictor increases the odds of landing in that category relative to the reference category. An Exp(B) below 1 means it decreases those odds.
Check your output for high standard errors or extremely wide confidence intervals too, since these often signal a category with too few cases. This is worth ruling out alongside checking for multicollinearity between your predictors before you trust any coefficient at all.
APA Style Write-up Template
A multinomial logistic regression was conducted to predict employment status (employed as reference) from [predictors]. The model was statistically significant, χ²([df]) = [value], p = [value]. Compared to employed, being unemployed was associated with [predictor], Exp(B) = [value], p = [value]. Compared to employed, being not in the labour force was associated with [predictor], Exp(B) = [value], p = [value].
Model Fit, Assumptions and Sample Size
Before I trust any multinomial logistic regression output, I check three things beyond the Exp(B) values themselves. The likelihood ratio test tells you whether your model as a whole fits significantly better than an empty model, and SPSS reports this automatically in the Model Fitting Information table. Pseudo R-squared values, Cox and Snell and Nagelkerke, give you a rough sense of how much variance your predictors explain, though neither behaves exactly like R-squared in linear regression, so I treat them as a general guide rather than a precise number.
Multinomial logistic regression also assumes independence of irrelevant alternatives, meaning the odds of choosing one category over another should not depend on what other categories are available. This assumption rarely gets tested in dissertation work, and in my experience most examiners do not expect a formal test for it, but it is worth naming in your limitations section.
Sample size matters more here than in binary logistic regression, since each category needs enough cases on its own. A common rule of thumb asks for at least 10 cases per predictor for each outcome category, so a three category outcome with five predictors needs a noticeably larger sample than the same study run as binary logistic regression. If you are planning your sample before data collection, a sample size calculator gives you a starting estimate.
Social Class as a Categorical Outcome Variable
Logistic regression social class work is one of the most common places I see this exact binary vs multinomial mistake, because social class looks ordered on the surface and often is not treated that way in practice.
NS-SEC and Other Social Class Schemes, UK and US
In the UK, the National Statistics Socio-economic Classification, NS-SEC, is the standard scheme, and it comes in three, five or eight category versions depending on your research design. In the US, researchers more often build their own social class categories from income, education and occupation combined, which usually produces unordered groups rather than a clean ranking.
Why Social Class Is Usually Multinomial, Not Ordinal, in Practice
NS-SEC categories like higher managerial, intermediate and routine look like they sit on a ladder, but the occupations inside each category do not form a single clean hierarchy once you look closely. A lot of published sociology research treats NS-SEC as nominal and runs it through multinomial logistic regression for exactly this reason, rather than assuming proportional odds across categories that do not behave uniformly. If you are still deciding how to classify your outcome variable at the research design stage, it is worth settling that question before you choose between cross-sectional and longitudinal designs, since the two decisions affect each other.
My Take After 12 Years of Reviewing Dissertations
I have read a lot of SPSS tutorials on this exact topic, and UCLA’s own multinomial logistic regression walkthrough is a good example of the pattern. It is technically correct, and it still predicts a student’s preference for chocolate over vanilla from a puzzle score, not an employment or social class outcome a sociology student could map onto their own variables. It explains the mathematics of multinomial logistic regression well. It never explains why a student would pick the wrong model in the first place, or what happens when an examiner catches it.
That gap is where most dissertation mistakes actually live, not in the formula, in the moment of deciding which test to even open. In twelve years of reviewing sociology dissertations, the binary vs multinomial logistic regression mix-up is one of the most common statistical errors I see at the draft stage. It sits right alongside running a t-test on non-normal data and skipping an assumption check entirely.
It is rarely about understanding statistics, and almost always about nobody showing them this decision point before they opened the software. Once someone does, the fix usually takes an afternoon, not a rewrite.
Frequently Asked Questions
Is multinomial logistic regression the same as ordinal logistic regression?
No. Multinomial logistic regression is for unordered categories. Ordinal logistic regression is for categories with a genuine order and assumes proportional odds across that order, an assumption that does not always hold in social science data.
What happens if you accidentally use binary logistic regression on a 3-category outcome?
You either lose a category by merging it with another, or you simply cannot represent your real research question, since binary logistic regression is built for exactly two groups. Either way, the model stops matching what you are actually studying.
How many categories before you need multinomial instead of binary logistic regression?
Three. The moment your outcome variable has three or more unordered categories, binary logistic regression can no longer model it correctly and multinomial logistic regression becomes the right tool.
Can SPSS, R and Stata all run multinomial logistic regression?
Yes. SPSS runs it under Analyze, Regression, Multinomial Logistic. R uses the nnet or mlogit packages. Stata uses the mlogit command. The underlying statistics are the same across all three, only the syntax and output layout differ.
Do you need to report Exp(B) for every category in multinomial output?
Yes. Multinomial logistic regression produces one set of coefficients per non-reference category, and each set needs its own Exp(B) values reported and interpreted separately in your results chapter.
How do you choose a reference category in multinomial logistic regression in SPSS?
Pick a category that makes sense as a comparison baseline for your research question, usually the largest group or a conceptually default group, then set it under the Reference Category button inside the Multinomial Logistic dialog box in SPSS.
What is the independence of irrelevant alternatives assumption in multinomial logistic regression?
It means the relative odds between any two categories should not change if you add or remove another category from the model. Most dissertation examiners do not expect a formal test of it, but naming it in your limitations section strengthens your methodology chapter.
About the Author
I am Siddharth, a dissertation statistics expert with twelve years of experience guiding sociology and social science students through exactly this kind of model selection problem. I have reviewed hundreds of results chapters, and the binary vs multinomial logistic regression mix-up remains one of the most common and most fixable mistakes I see.
Connect with me on LinkedIn, or if you want a second pair of eyes on your own categorical outcome variable before your next supervisor meeting, try a simple way to organise that conversation.