
Ordinal Logistic Regression vs Linear Regression for Likert Scale Survey Data
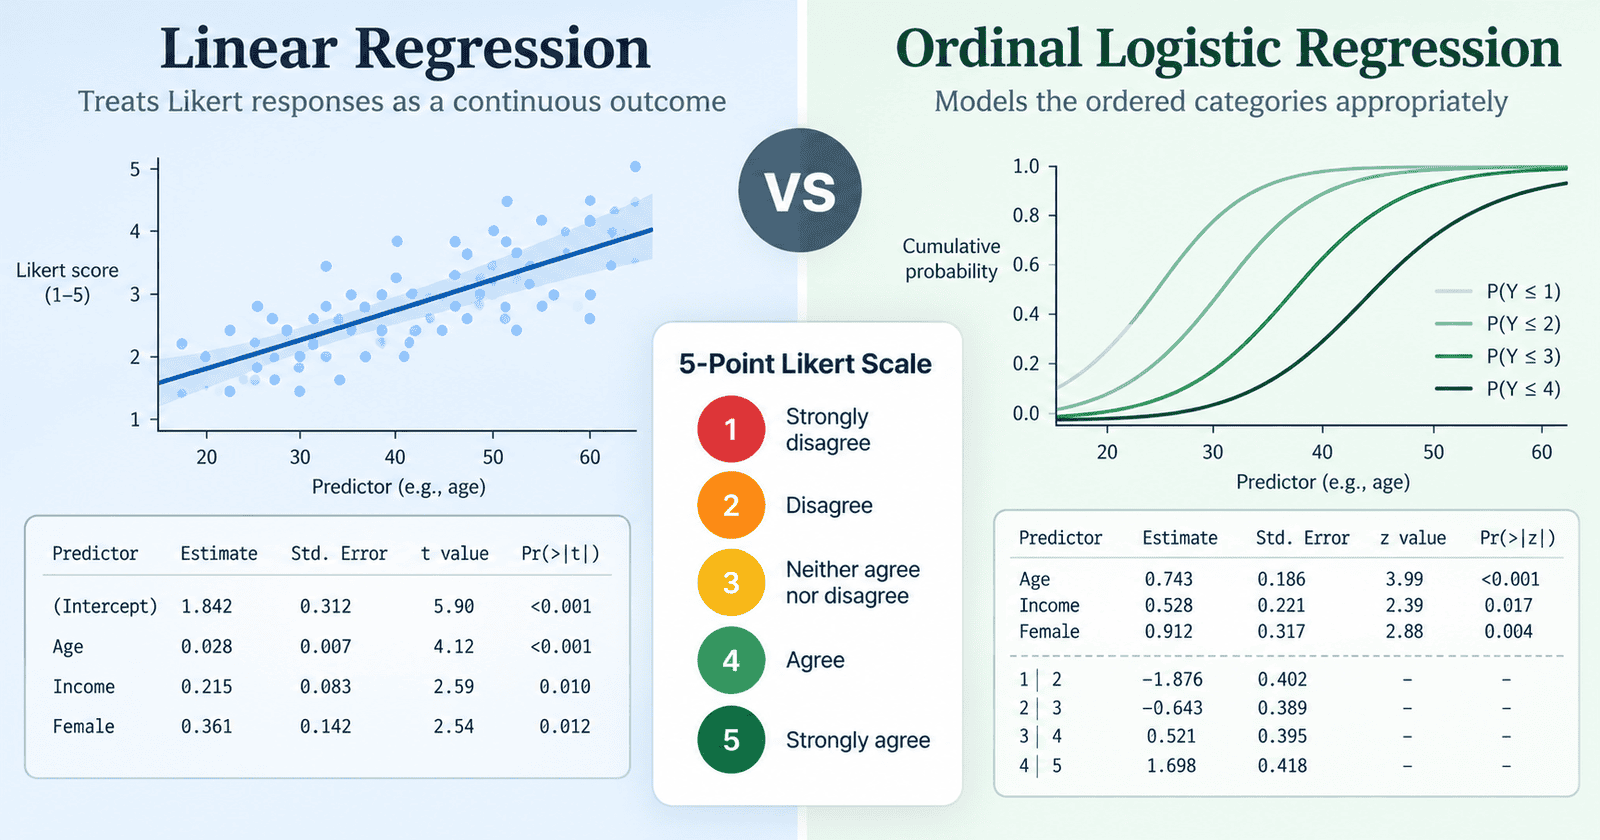
Ordinal logistic regression vs linear regression comes down to one question before anything else, is your Likert outcome ordinal or is it genuinely continuous. Ordinal logistic regression is the correct choice for a single Likert item or any ordered categorical outcome, linear regression only earns its place once you have a properly built composite scale. I have spent twelve years guiding sociology, psychology, and management students through this exact fork in the road, and the same mistake lands in my inbox more times than I can count.
A student collects good survey data on a 5 point attitude scale, runs a standard linear regression because that is what every YouTube tutorial shows, and only finds out something is wrong when a supervisor circles the methods section in red. This article exists so that does not happen to you. I will show you exactly when Likert data can be treated as continuous, when it absolutely cannot, and I will walk you through a real redo I supervised, the kind of case study that rarely makes it into a textbook.
Likert Item vs Likert Scale, the Distinction That Decides Your Test
Most students I work with have never heard this distinction, and it is the single most common reason their methodology gets questioned. The format gets its name from Rensis Likert, the psychologist who introduced this rating approach in 1932, and almost a century later researchers still argue about how to treat the numbers it produces. A Likert item and a Likert scale are not the same thing, even though people use the words interchangeably in casual conversation.
What Counts as a Single Likert Item
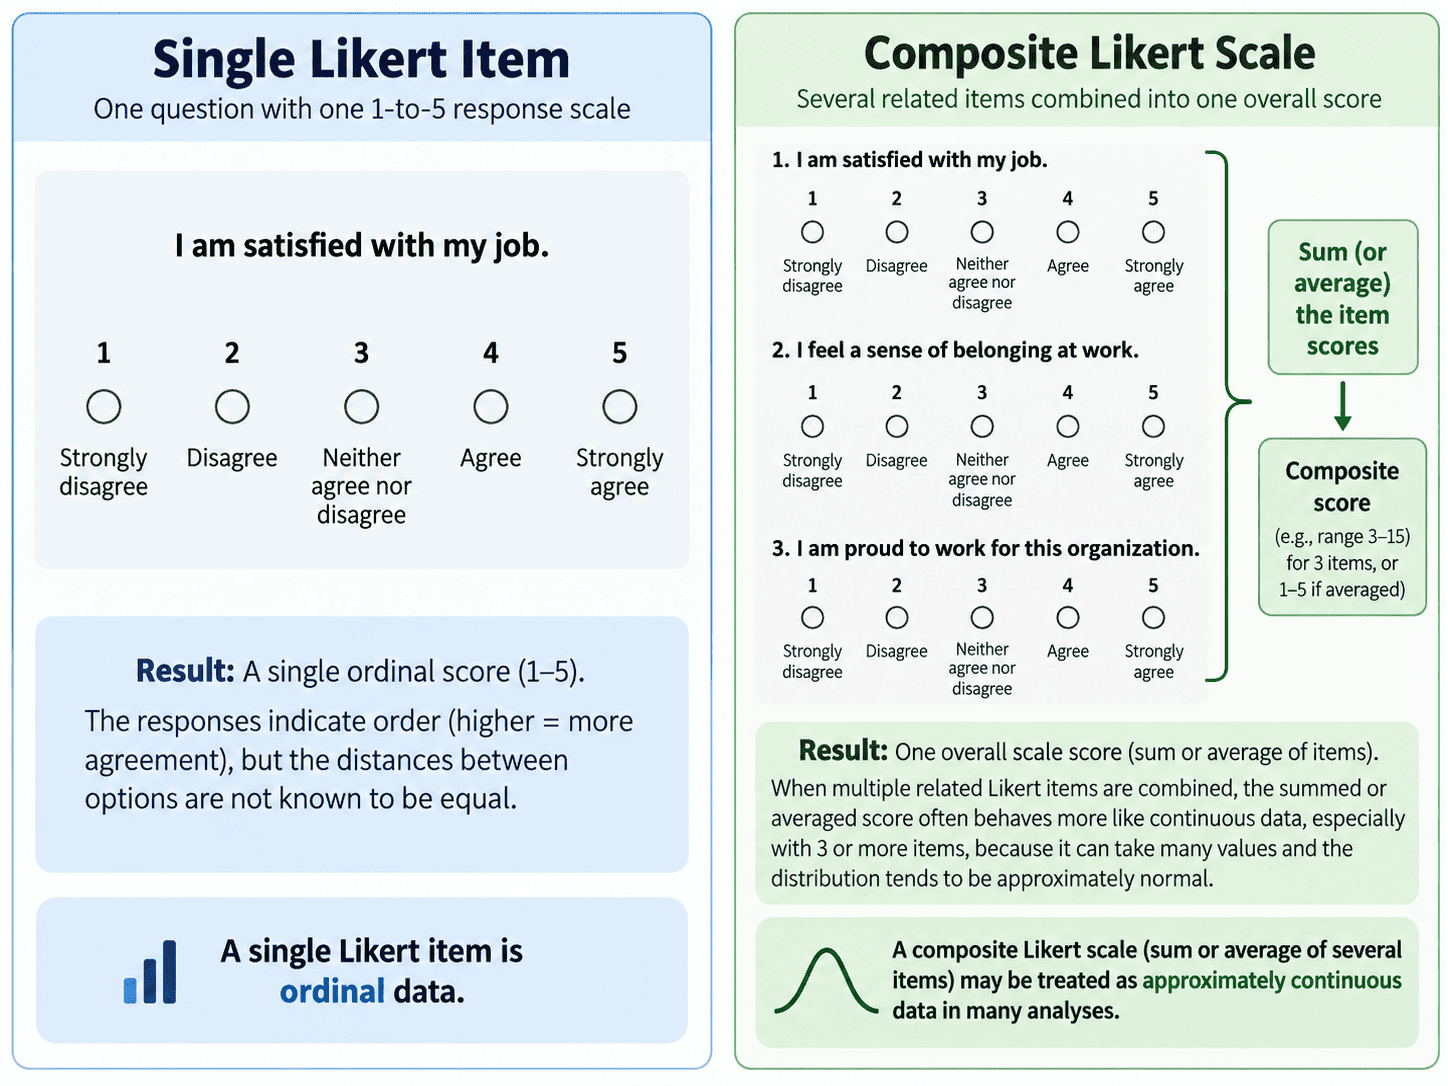
A single Likert item is one question with one set of ordered response options. “I trust my local government” rated from 1 (strongly disagree) to 5 (strongly agree) is a single item. It has five discrete categories and nothing links them to each other.
What Counts as a Composite Likert Scale
A Likert scale is what you get when you combine several related items into one composite score, usually by summing or averaging them. If you ask four questions about trust and add the scores together, you now have a range from 4 to 20 instead of 1 to 5. This composite behaves very differently from a single item, and I will explain exactly how in the next section.
Why Your Committee Cares About This Distinction
A committee member who flags “your data is ordinal” is almost always talking about a single item being misused, not a properly built composite scale. If you can show you understand the difference and defend your choice with a reason, half the battle in your viva is already won. If you cannot explain it, that is usually the moment a supervisor asks you to redo the chapter.
If your project also involves comparing group means rather than predicting a Likert outcome, the same logic applies to choosing between Tukey HSD and Games Howell for your post hoc test.
Treating Likert Data as Continuous, When It Is Allowed and When It Is Not
Treating likert data as continuous is not automatically wrong, the real question is which Likert data you mean. Ordinal logistic regression is a regression method built for ordered categorical outcomes, it estimates the odds of a response falling at or below a given category rather than predicting an exact numeric value the way linear regression does. This is really what the ordinal logistic regression vs linear regression question comes down to, assumption fit, not personal preference.
The Equal Interval Assumption Linear Regression Needs
Linear regression assumes the distance between every pair of adjacent values is identical. The jump from “disagree” to “neutral” is assumed to be worth exactly the same amount as the jump from “agree” to “strongly agree.” Nobody can prove that assumption holds for a single Likert item, and most careful researchers accept it does not.
When a Summed Scale Behaves Like Continuous Data
A composite scale built from five or more Likert points, especially when several items are summed together, starts to behave statistically similar to genuinely continuous data in simulation studies. This is the evidence base that lets many published papers defend treating a multi item scale as continuous and run it through linear regression without apology. I have used this exact argument in dozens of methodology sections and it holds up in most committee reviews.
Plenty of blog posts confidently declare that a Likert scale is basically continuous and stop right there. That confidence is doing more work than it has earned. The simulation research behind that claim is about a scale built from five or more points with several items summed together, not a single question answered once, and most of those same blog posts never make that distinction clear for the student reading them at midnight before a deadline.
When a Single Item Must Stay Ordinal
A single item, especially one with only three to five categories, does not get this protection. Treating one question’s raw 1 to 5 response as continuous is the mistake examiners flag most often, and it is the mistake at the centre of the case study later in this article.
| Situation | Treat as continuous | Treat as ordinal |
|---|---|---|
| Single Likert item, 5 or fewer categories | No | Yes |
| Summed or averaged scale, 5 or more points, multiple items | Often defensible | Only if distribution is heavily skewed |
| Outcome variable in a regression model | Depends on above | Use ordinal logistic regression by default for single items |
| Reporting group means and standard deviations | Case by case | Prefer medians and proportions for single items |
This exact decision point is also where many students realise their sampling design and their analysis plan were never aligned in the first place.
What Breaks When You Run Linear Regression on Likert Data
The Equal Distance Assumption Gets Violated
I covered this above, but the practical consequence is that your coefficients get interpreted as if each one point increase means the same thing everywhere on the scale, and that is simply not a safe claim for a single ordinal item.
Predictions Can Fall Outside the Real Scale
Linear regression can happily predict a value of 6.3 on a scale that only goes from 1 to 5. That prediction is meaningless, and an alert examiner will ask you to explain it.
Variance Gets Uneven Near the Endpoints
Responses pile up at the extremes of a Likert scale far more than linear regression’s assumptions allow. This produces uneven variance across the range, known as heteroscedasticity, and it quietly weakens the reliability of your significance tests.
Effect Sizes Can Come Out Distorted
This is the part students underestimate the most. Recent methods research comparing linear and ordered models on the same ordinal dataset has shown the two approaches can produce meaningfully different estimated group differences, not just slightly different numbers but different enough to change the substantive story the data tells. That is the practical weight behind the ordinal logistic regression vs linear regression decision, it is not academic hair splitting, it changes what your numbers actually mean.
Once you understand what breaks, the ordinal logistic regression vs linear regression choice becomes far less intimidating. It is worth checking your model for multicollinearity using VIF before you trust any of your odds ratios, since a Likert predictor correlated with another variable in your model distorts results regardless of which regression type you choose.
What Ordinal Logistic Regression Does Differently
The Proportional Odds Model in Plain Language
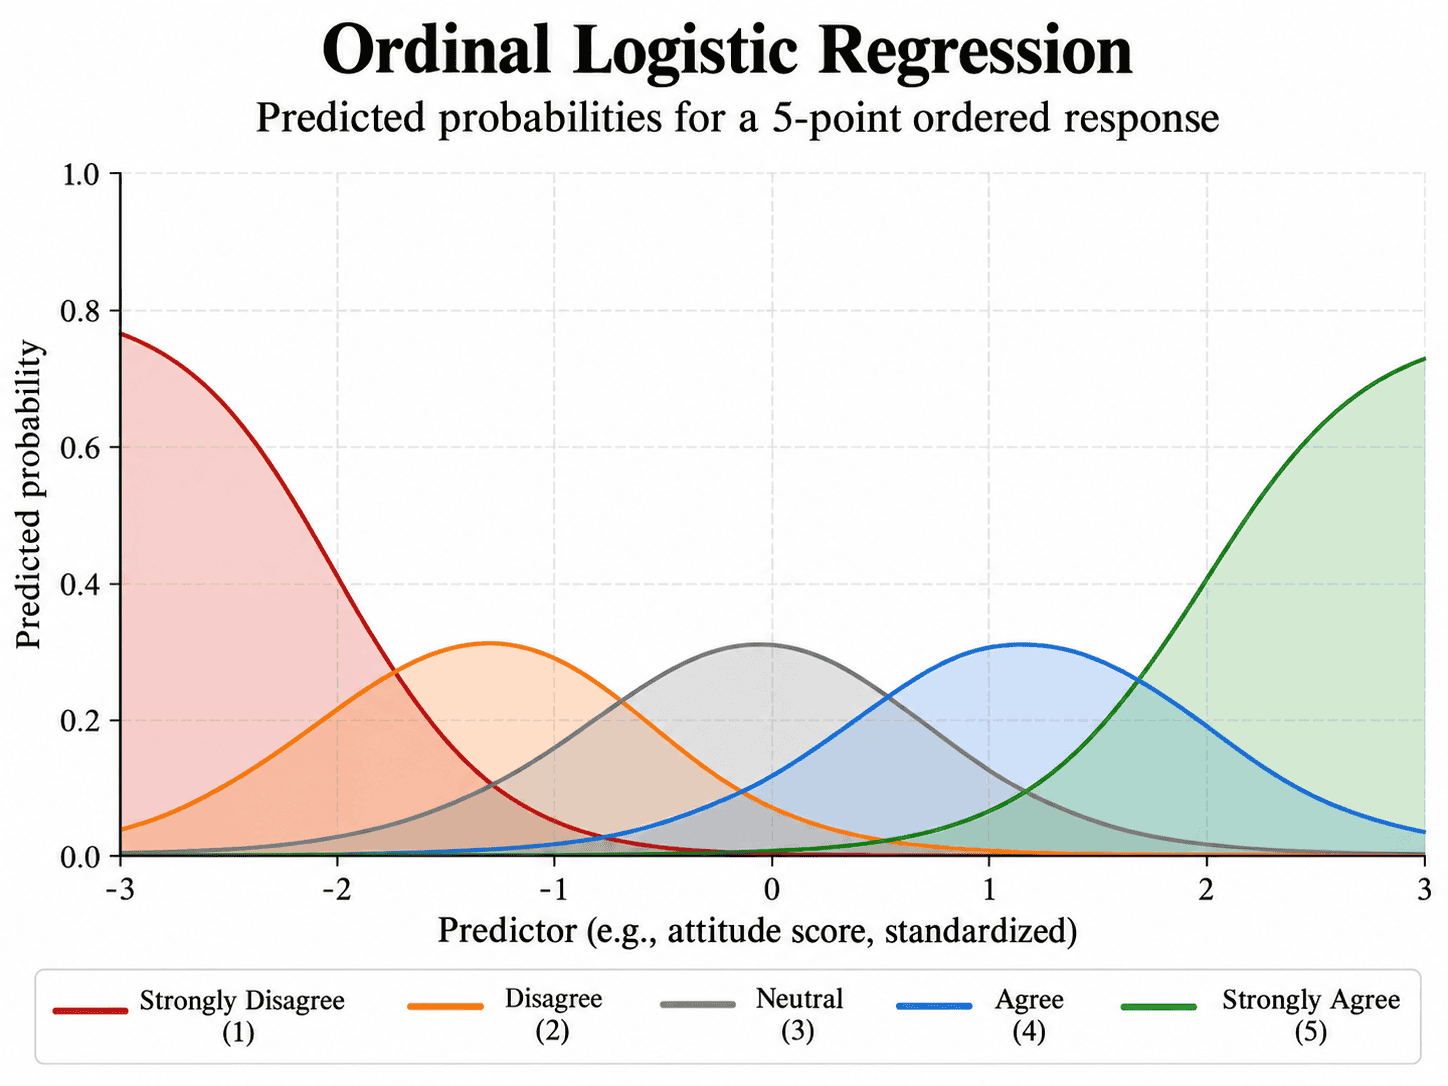
Ordinal logistic regression, also called the proportional odds model or the cumulative logit model depending on which textbook you are reading, does not try to predict an exact score. Instead it models the odds of your outcome falling in a given category or any category below it, compared to falling above it. Think of it as building several logistic regressions at once, one for each cut point in your scale, and forcing them to agree on how each predictor behaves across the whole range.
The foundational papers on ordinal regression models, the ones your methods textbook footnotes, were written by statisticians for statisticians. They are correct, and they are close to unreadable if you are not already comfortable with maximum likelihood notation, which is exactly why so many dissertation students skip straight to copying SPSS menu paths instead of understanding what the model is actually doing.
Reading Odds Ratios and Cumulative Probabilities
Instead of a slope coefficient, your output gives you odds ratios. An odds ratio above 1 means higher values of a predictor push respondents toward the higher end of the Likert scale, an odds ratio below 1 pushes them toward the lower end. I always tell my students to interpret these in plain language for their discussion chapter, nobody outside statistics instinctively understands “an odds ratio of 1.8” without a sentence explaining what it means for real people.
The Proportional Odds Assumption and the Brant Test
The model assumes each predictor has the same effect across every cut point of the scale, this is called the proportional odds assumption. The Brant test checks whether that assumption holds. If it fails, you are not stuck, a generalised ordinal model or a partial proportional odds model can relax the assumption for the specific predictors causing trouble.
Ordinal Logistic Regression vs Linear Regression, Side by Side
| Feature | Linear Regression | Ordinal Logistic Regression |
|---|---|---|
| Dependent variable type | Continuous | Ordinal category |
| Core assumption | Equal distance between values | Proportional odds across categories |
| Output | Coefficients, predicted scores | Odds ratios, cumulative probabilities |
| Risk with single Likert item | High, assumption usually violated | Low, built for this exact data type |
| Common software | SPSS Linear Regression, R lm, Stata regress | SPSS Ordinal Regression, R polr or ordinal package, Stata ologit |
| Typical dissertation use case | Composite scale of 5+ points | Single item or short ordinal outcome |
Ordinal Regression for a Sociology Dissertation, a Real Case Study
This case study is the ordinal logistic regression vs linear regression decision playing out in a real dissertation, and it is the ordinal regression sociology dissertation scenario I am asked about most often, a single survey item, a looming deadline, and a supervisor who wants the right test, not just a passing one.
The Original Linear Regression Setup
Ananya, a master’s student I worked with, was studying how income level and education predicted attitudes toward immigration policy, measured on a single 5 point Likert item from strongly oppose to strongly support, collected from 214 respondents. She ran a standard multiple linear regression in SPSS with income and education as predictors. The output looked clean on the surface, an R squared of point one four, a significant coefficient for education at b equals point three one, p less than point zero five, everything a first pass analysis is supposed to look like.
Why the Supervisor Flagged It
Her supervisor asked one question in the first draft review, “is attitude toward policy really a continuous variable here.” Ananya did not have an answer ready, and that single gap in reasoning sent her back to redo the entire analysis chapter three weeks before submission.
Rerunning It as Ordinal Logistic Regression
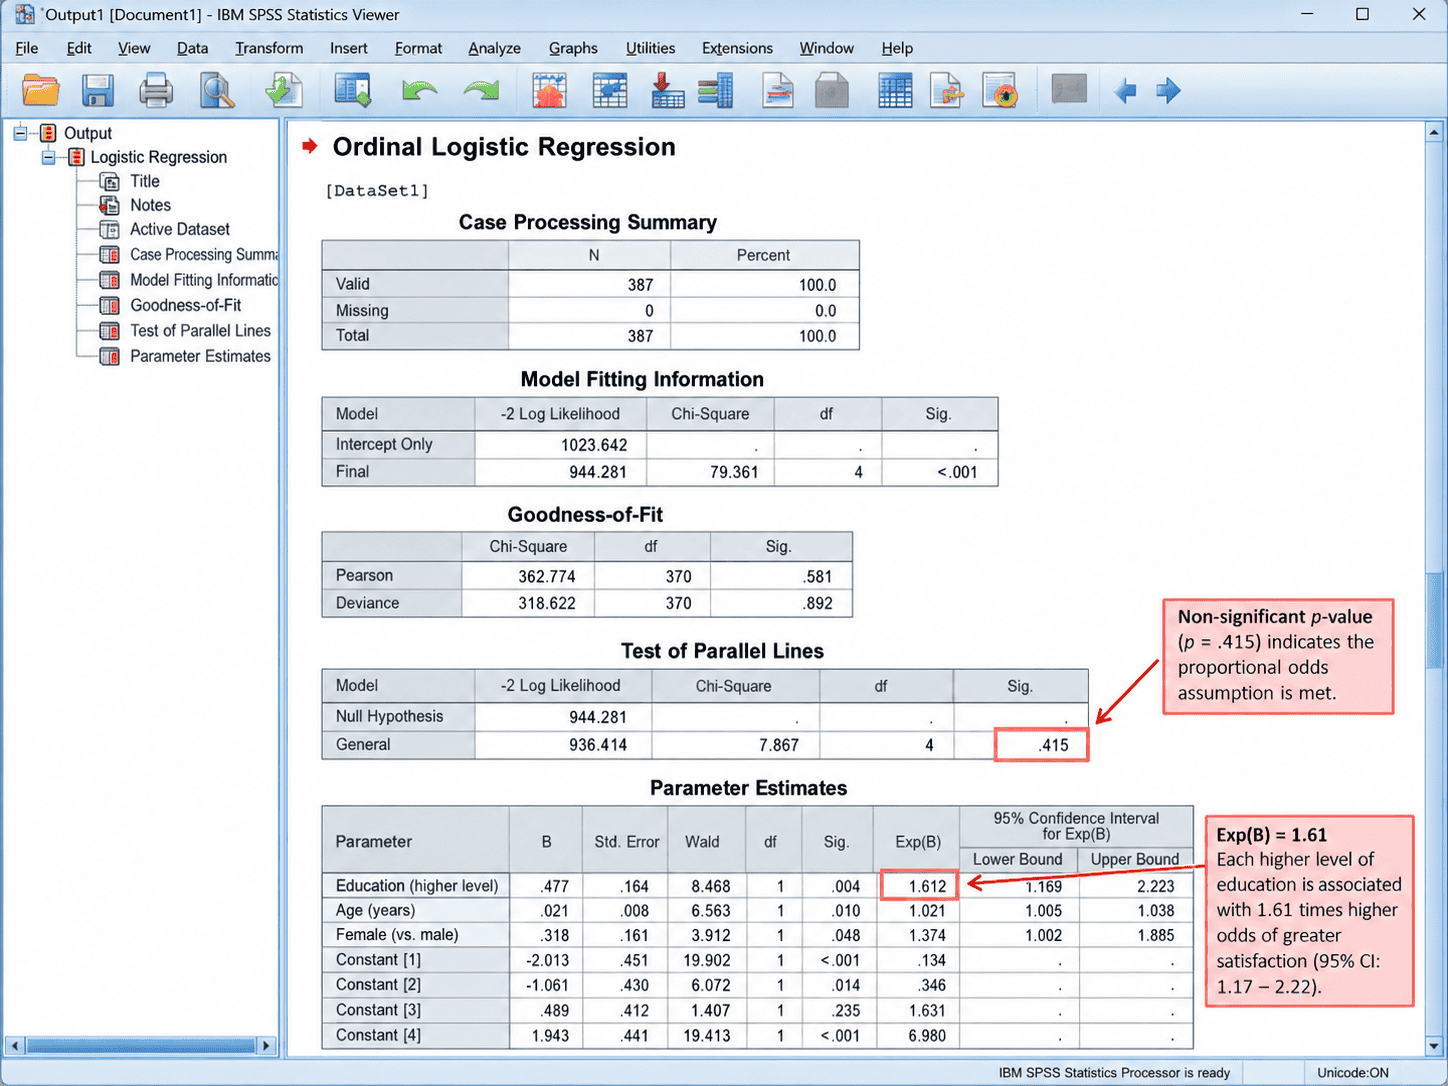
We rebuilt the model in SPSS using Analyze, Regression, Ordinal, with the same income and education predictors against the same 5 point attitude item. The output switched from coefficients to odds ratios, education came back with an odds ratio of 1.61, 95 percent CI 1.19 to 2.18, and we ran the test of parallel lines to confirm the proportional odds assumption held, which it did at p equals point four one.
What Actually Changed
The direction of both relationships stayed the same, income and education still predicted more favourable attitudes. What changed was the strength of the education effect, the linear model’s R squared of point one four and the ordinal model’s Nagelkerke pseudo R squared of point one nine were telling slightly different stories about how much education actually mattered once the model respected the real spacing of her response categories instead of assuming it. Her discussion chapter got stronger, not weaker, because the finding was now backed by the correct test.
Likert Scale Regression in SPSS, Running Ordinal Logistic Regression Step by Step
If you searched for a likert scale regression spss walkthrough specifically, here it is end to end, no jumping between browser tabs.
- Go to Analyze, then Regression, then Ordinal.
- Move your Likert item into the Dependent box, make sure SPSS recognises it as Ordinal under Variable View first.
- Move your predictors into the Covariate box for continuous variables or the Factor box for categorical ones.
- Click Output and tick Test of Parallel Lines to check the proportional odds assumption.
- Click Options and review the link function, Logit is the standard choice for most dissertation use cases.
- Run the model and check the parallel lines significance value, a non-significant result above point zero five supports your assumption.
- Record the odds ratios, confidence intervals, and model fit statistics for your results chapter.
Reading the Test of Parallel Lines
A non-significant result here is good news, it means your proportional odds assumption is reasonable. A significant result does not end your analysis, it means you report the violation honestly and consider a generalised ordinal model for the predictors causing the problem.
How Much Sample Size You Actually Need
A common rule of thumb for ordinal logistic regression asks for roughly ten observations per predictor for each category of your outcome variable, so a model with two predictors and a 5 category Likert item wants a reasonably comfortable sample before you trust the output, not forty responses squeezed in during the last week of data collection. Below that, SPSS tends to throw the empty cells warning, and your confidence intervals get wide enough to be close to useless. UCLA’s statistics consulting pages are usually the first result when you search for this SPSS syntax, and they deserve the traffic because the walkthroughs are accurate, what they rarely spell out is exactly this sample size question, which is how students end up running the model on far too few responses and never thinking about it again.
If you are still planning your data collection, work out your target sample before you finalise your survey length, this calculator gives you a starting number in under a minute.
Running the Same Model in R and Stata
SPSS is where most of my students start because their university already pays for the licence and the menu path is forgiving for a first attempt. R gives you more control once you need diagnostics SPSS does not report by default, the polr function in the MASS package or the clm function in the ordinal package both run the same proportional odds model and hand you more flexibility for checking the proportional odds assumption predictor by predictor. Stata’s ologit command does the same job in a single line, adding the or option gives you odds ratios directly instead of raw log odds, which saves a step when you are writing up results on a deadline. None of the three gets you a mathematically different answer, the choice comes down to what your department expects and what you are comfortable debugging at 1am.
Reporting the Output in APA Style
Report the odds ratio, the confidence interval, the Wald statistic, and the significance value for each predictor, followed by a plain language sentence explaining direction and strength. Something like “respondents with higher education had significantly higher odds of reporting more favourable attitudes, OR equals 1.61, 95 percent CI 1.19 to 2.18, p less than point zero one” covers both the statistical and narrative expectations most committees look for.
Before you finalise any results chapter, it is worth testing your residuals for normality and then checking for autocorrelation in your residuals if your design has any time ordered element.
Quick Checklist Before You Run Anything
- Is your outcome a single Likert item or a summed composite scale
- Does your composite scale have five or more points and multiple items feeding into it
- Have you checked the proportional odds assumption if you choose ordinal logistic regression
- Have you confirmed your sample size is large enough for the number of predictors and categories you have
- Can you explain your choice in one sentence if a committee member asks
- Have you reported odds ratios in plain language, not just raw numbers
The Short Version
Linear regression needs equally spaced, genuinely continuous data, a single Likert item almost never qualifies, a composite scale built from five or more summed points usually does. Ordinal logistic regression, the proportional odds model, is built for the single item case, it estimates odds across ordered categories instead of predicting an exact score and checks its own key assumption through the test of parallel lines. When in doubt on a dissertation deadline, treat a single Likert item as ordinal, treat a properly summed multi item scale as a judgment call backed by your sample size and distribution, and always be ready to explain your choice in one sentence to your committee. That is the entire ordinal logistic regression vs linear regression decision in one paragraph, everything above this is the detail behind it.
Frequently Asked Questions
What happens if you treat ordinal data as continuous by mistake?
Your coefficients, predicted values, and significance tests all become unreliable because the model assumes equal spacing that likely does not exist, and a careful examiner will usually catch this in review.
What do I do if my ordinal logistic regression fails the parallel lines test?
You report the violation honestly and move to a generalised ordinal model or a partial proportional odds model, which allows specific predictors to vary across cut points instead of forcing one effect across the whole scale.
Can I run ANOVA on Likert scale data instead?
ANOVA shares the same equal interval assumption problem as linear regression for a single item, so it faces the same objection, a non-parametric alternative like Kruskal-Wallis is often safer for comparing groups on one ordinal item. The same logic sits behind choosing Spearman’s rank correlation over Pearson’s whenever one of your variables is ordinal rather than continuous.
How many Likert points does a scale need before it can be treated as continuous?
Five or more response points on a properly summed multi-item scale is the commonly cited threshold in simulation research, a single item at any point count does not automatically qualify.
Does switching to ordinal logistic regression change my actual conclusions or just my methods section?
It can change both, as the case study above shows, the direction of your findings often stays the same but the strength of specific effects can shift once the model respects your data’s true structure.
How do I report ordinal logistic regression results in APA format?
State the odds ratio, confidence interval, Wald statistic, and p value for each predictor, then add one plain language sentence explaining what the number means for your actual sample.
What is the difference between ordinal logistic regression and multinomial logistic regression?
Multinomial logistic regression treats your outcome categories as unordered and compares each one separately against a reference category, which throws away the ranking your Likert data already gives you for free. Use multinomial regression only when your categories genuinely have no natural order, such as preferred mode of transport, and stick with ordinal logistic regression whenever the categories can be lined up from low to high.
If any part of this sounds like your situation, it is worth reading about how to know if you need a dissertation expert before your next supervisor meeting, not after.
Written by Siddharth Gupta, dissertation and research methodology expert with 12 years of experience guiding sociology and social science students through statistical analysis. Connect on LinkedIn.