
How to Analyze Likert Scale Data in SPSS: A Step-by-Step Guide for Dissertations
If you have spent hours googling how to analyze Likert scale data in SPSS and still feel confused, you are not the first. I have sat with over a hundred dissertation students in the last 12 years, and this exact question comes up almost every week. Trust me, it is not as complicated as the forums make it sound, once you follow the steps in the right order.
This guide covers the full workflow: cleaning your data, coding and reverse coding, checking reliability, building composite scores, and choosing the correct statistical test. By the end, you will know exactly what to click in SPSS and, more importantly, why.
How to Analyze Likert Scale Data in SPSS in 5 Steps
If you just need the shape of the process before reading the full detail, here it is:
- Clean your data and set up value labels and missing values correctly.
- Reverse code any negatively worded items using Transform > Recode into Different Variables.
- Check reliability with Cronbach’s alpha before you combine any items.
- Create a composite score using Transform > Compute Variable.
- Check normality, then run the correct test, parametric or non-parametric, based on what you find.
Each step is explained in full below, along with the mistakes that usually trip students up.
What Is a Likert Scale (and Why It Confuses Most Students)
A Likert scale is a rating scale, usually ranging from “Strongly Disagree” to “Strongly Agree,” used to measure attitudes, opinions, or perceptions that cannot be observed directly. It is named after Rensis Likert, who introduced it in his 1932 doctoral work as a faster alternative to the judge-panel scales researchers relied on before that. Each response is assigned a number, typically from 1 to 5, so that it can be entered and processed in IBM SPSS Statistics, referred to simply as SPSS for the rest of this guide.
The confusion starts because people mix up two related but different things.
Likert Item vs Likert Scale: The Distinction Examiners Check
A single question with a rating response, such as “I find my job satisfying,” is called a Likert item. A Likert scale is a group of related Likert items combined into one composite score, such as five questions that together measure “job satisfaction.”
I have seen students lose marks in their defence simply because they called one question a “Likert scale.” One item is ordinal data on its own. A properly combined set of items, checked for reliability, is what most statisticians treat as a scale. Keep this distinction clear in your methodology chapter.
Is Likert Scale Data Ordinal or Interval? My Honest Take After 12 Years
This is the most argued-about question in every research methods forum. Take the traditionalist position laid out in academic papers on levels of measurement: Likert responses are ordinal, full stop, and any researcher who averages them or runs regression on them without justification is making an unsupported statistical leap. I respect the theory. It simply does not survive contact with an actual dissertation committee.
Here is what actually gets accepted by most committees, in my experience guiding dissertations. Treat a single Likert item as ordinal, and treat a summated Likert scale, meaning multiple items averaged or summed with acceptable reliability, as approximately interval for parametric testing. This is the convention followed in the majority of published social science research, and it holds up if you cite it properly and check your assumptions before running any test, which I’ll show you how to do further down.
Before You Open SPSS: Preparing Your Questionnaire Data
Before you touch any menu in SPSS, your data file needs to be in order. This step is where most errors quietly creep in, and nobody notices until the results look strange.
Cleaning Your Data and Catching Entry Errors
Run a simple Frequencies table (Analyze > Descriptive Statistics > Frequencies) on every variable first. If your scale runs 1 to 5 and you see a stray 6 or a 9 sitting in there, that is a data entry mistake, not a real response. This one check alone will save you from wrong results later, and it applies to anyone learning how to analyze questionnaire data in SPSS, not just Likert scales.
Setting Up Variable View: Value Labels and Missing Values
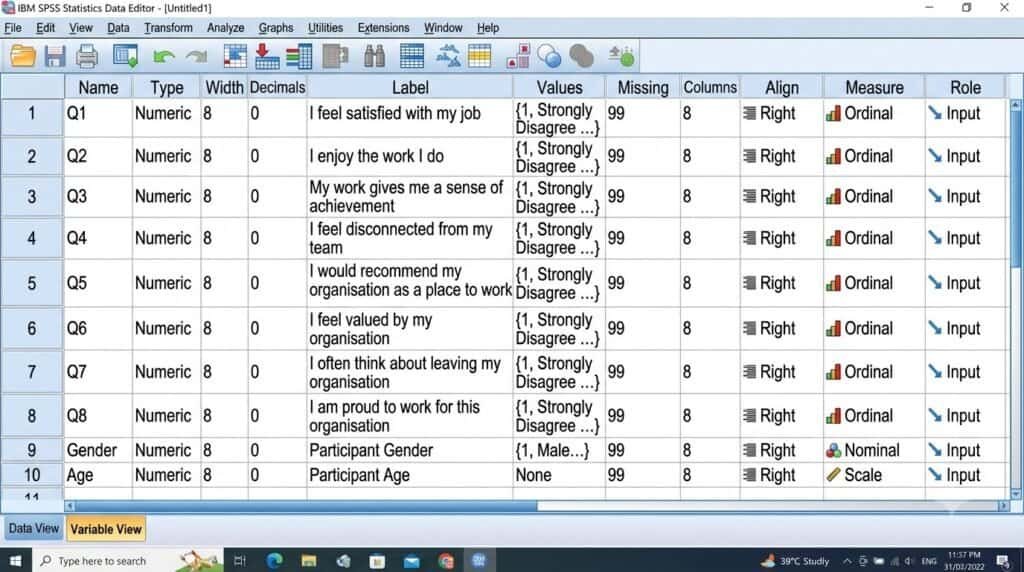
In Variable View, assign proper value labels (1 = Strongly Disagree, 5 = Strongly Agree) so your output reads clearly instead of showing bare numbers. Also define your missing values properly, for example if blank responses were coded as 99, tell SPSS that 99 is missing so it does not get treated as a real score.
Step 1: Coding and Reverse Coding Likert Items in SPSS
Once your data is clean, the actual process of how to code Likert scale data in SPSS begins here, with reverse coding.
Spotting Negatively Worded Items
Most well-designed questionnaires include a few negatively worded items on purpose, for example “I feel disconnected from my team” sitting inside a job satisfaction scale where every other item is positively worded. If you sum these as they are, a high score on this one item will pull down the meaning of the whole scale, because agreeing with it actually means low satisfaction.
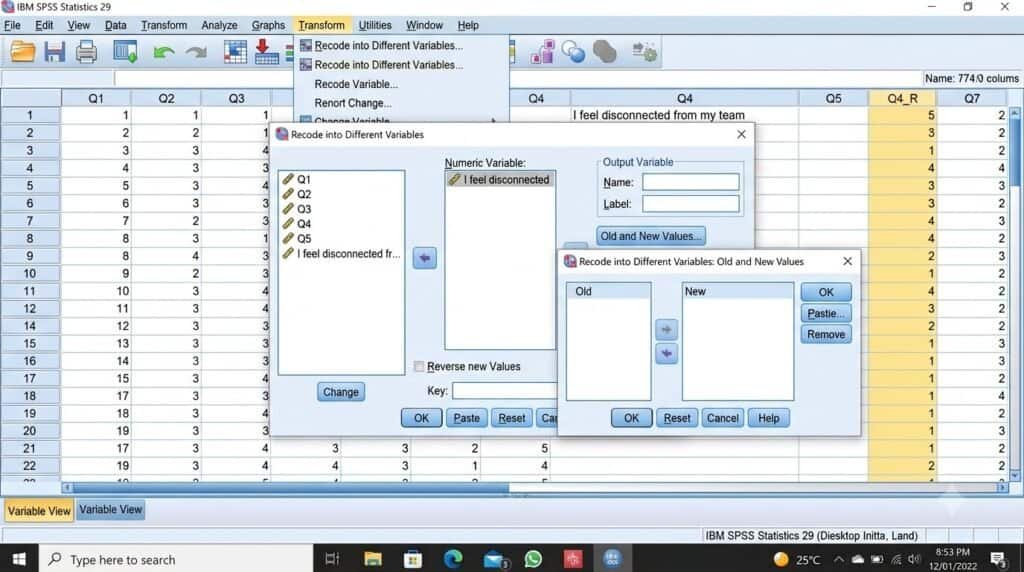
Reverse Coding Using Transform, Recode into Different Variables
To fix this, go to Transform > Recode into Different Variables, select the negatively worded item, and flip the values (on a 5-point scale, 1 becomes 5, 2 becomes 4, 3 stays 3, 4 becomes 2, 5 becomes 1). Give the new variable a clear name like “Q7_R” so you always know it has been reversed. Never overwrite your original variable, keep both so you can audit your work later.
Case in point: I once worked with a student, let’s call her Ananya, whose employee engagement scale had a Cronbach’s alpha of just 0.52, which is unacceptable. After going through her 8 items, we found one negatively worded item that had never been reverse coded. Once fixed, alpha jumped to 0.81. One missed step nearly cost her a redo of her entire results chapter.
Step 2: Checking Reliability With Cronbach’s Alpha
You cannot skip this step if you are combining multiple items into one scale. This is also the step most YouTube tutorials rush through in thirty seconds, which is exactly why students get it wrong.
Running Reliability Analysis in SPSS
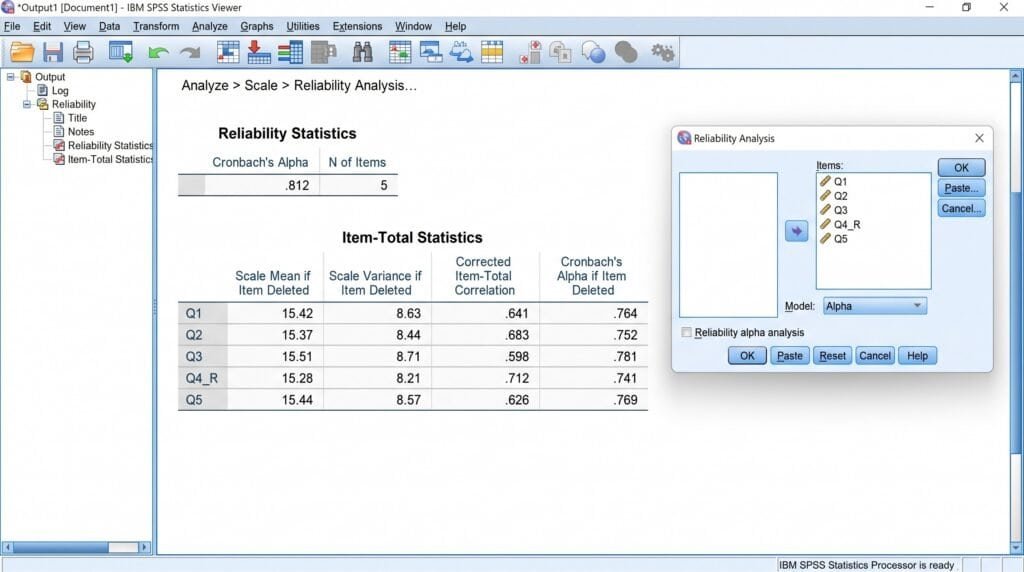
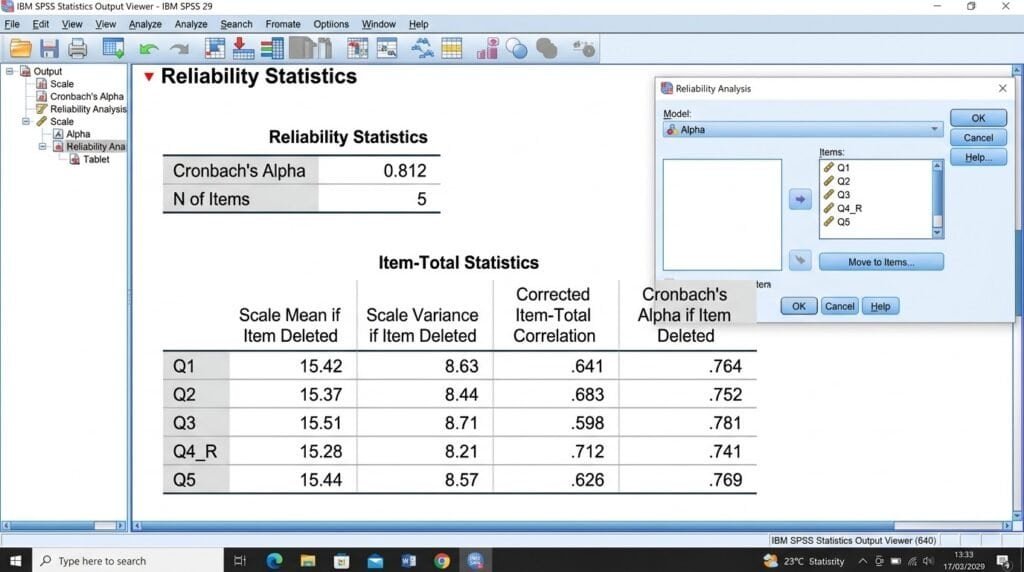
Cronbach’s alpha is a statistic that measures how consistently a group of Likert items measure the same underlying construct, expressed as a number between 0 and 1. Go to Analyze > Scale > Reliability Analysis, move all the items of your scale into the Items box, and make sure the model is set to Alpha. Click OK, and SPSS will give you a Cronbach’s alpha value along with an “alpha if item deleted” column that tells you which item is dragging your reliability down. If you prefer syntax over menus, SPSS’s own documentation for the RELIABILITY procedure covers the exact command structure.
What Counts as a Good Alpha Score
| Cronbach’s Alpha | Interpretation |
|---|---|
| 0.90 and above | Excellent |
| 0.80 to 0.89 | Good |
| 0.70 to 0.79 | Acceptable |
| 0.60 to 0.69 | Questionable |
| Below 0.60 | Poor, revise the scale |
Most dissertation committees expect at least 0.70. If yours is lower, check for reverse coding errors first, then consider dropping the weakest item using the “alpha if item deleted” column.
Step 3: Creating a Composite (Summated) Score
Once reliability is acceptable, combine your items into one score that represents the construct as a whole. A composite score, also called a summated score, is a single value built by combining multiple Likert items that measure the same construct, usually as their mean or sum.
Go to Transform > Compute Variable, name your new variable (for example “JobSatisfaction”), and in the Numeric Expression box type the mean of your items, such as MEAN(Q1, Q2, Q3, Q4_R, Q5). Using the mean instead of the sum keeps your composite score on the same 1 to 5 range as the original items, which is easier to interpret and report.
If you want to go further and confirm that your items genuinely measure one construct rather than two or three hidden ones, factor analysis is the next tool to reach for. It is usually expected only at the PhD level, or when you are validating a brand new scale instead of using an established one.
Step 4: Running Descriptive Statistics on Likert Data
With your composite score ready, get a feel for your data before running any inferential test.
Frequencies, Mean, Median, Mode, and Standard Deviation
Use Analyze > Descriptive Statistics > Frequencies, tick Mean, Median, Mode, and Std. Deviation, and generate a bar chart if you want a quick visual for your results chapter. A mean close to 4 on a 5-point scale, for instance, tells you respondents generally agreed with the statement.
Checking Normality Before Choosing a Test
This is the step most students skip entirely, and in my experience it is one of the most common reasons examiners send papers back for revision. Run a normality check through Analyze > Descriptive Statistics > Explore, tick “Normality plots with tests,” and look at the Shapiro-Wilk result (this test is more reliable for smaller samples). If you are unsure how to read this output, this Shapiro-Wilk normality guide walks through interpretation with examples.
Case in point: A PhD scholar I worked with, Rohit, ran an independent samples t-test directly on his Likert composite scores without checking normality first. His external examiner flagged it during the viva and asked him to justify the choice. He could not, and ended up redoing the analysis with a non-parametric alternative three weeks before his final submission. Checking normality first would have avoided that entirely.
Step 5: Choosing and Running the Right Statistical Test
This is where “how to analyze Likert questionnaire data in SPSS” actually turns into results you can write up.
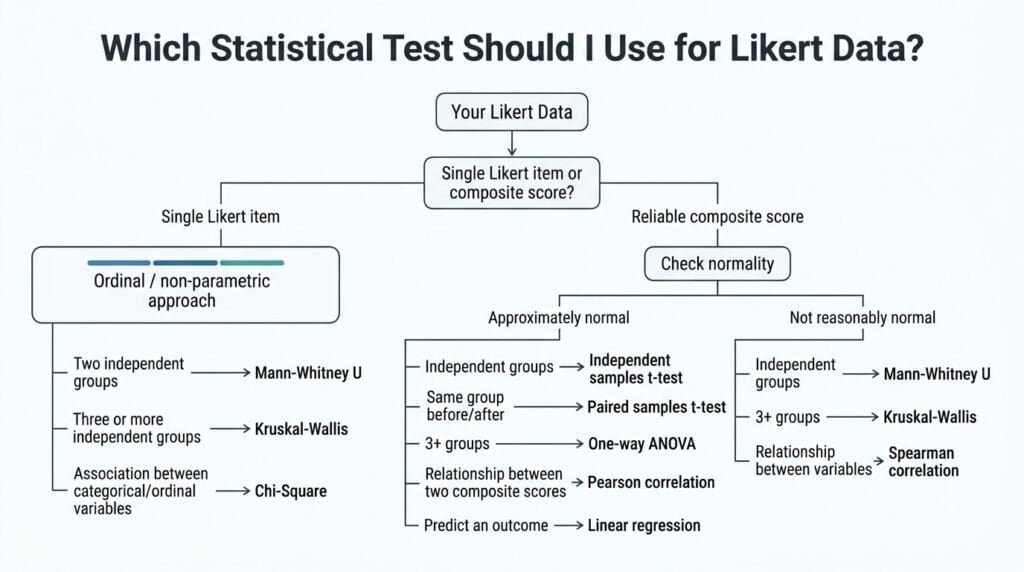
Parametric Options: t-test, ANOVA, Correlation, and Regression
If your composite score is reasonably normal and your sample size is decent, generally above 30 per group as a rough rule of thumb, you can proceed with parametric tests. Common choices are an independent samples t-test, one-way ANOVA, Pearson correlation, or linear regression, and if you are comparing the same group before and after an intervention, a paired t-test is usually the right starting point over a one-way ANOVA. For relationships between two Likert-based composite scores, choosing between Pearson and Spearman correlation comes down to whether your data actually meets the normality assumption.
Non-Parametric Alternatives: Mann-Whitney U, Kruskal-Wallis, Chi-Square
If normality fails, or you are working with a single ordinal Likert item rather than a composite score, non-parametric tests are the safer and more defensible route. Use Mann-Whitney U instead of an independent t-test, Kruskal-Wallis instead of one-way ANOVA, and Chi-Square for testing associations between categorical or ordinal variables.
How to Analyse a 5-Point Likert Scale Specifically
Students often ask if there is anything different about how to analyze 5 point Likert scale data in SPSS compared to a 7-point scale. The process is identical, coding, reverse coding, reliability, composite scoring, and test selection all work the same way. The only real difference is interpretation: on a 5-point scale, a mean of 3 sits exactly at neutral, while on a 7-point scale, neutral sits at 4. Always mention your scale range clearly in your results section so readers interpret your means correctly.
Reporting Your Likert Scale Results in APA Format
For your results chapter, report descriptive statistics first, followed by your test result, following the APA guidance on reporting statistics that most universities expect by default unless your department says otherwise. A typical example: “Respondents reported moderately high job satisfaction (M = 3.82, SD = 0.64). An independent samples t-test showed no significant difference between male and female respondents, t(148) = 1.12, p = .264.” Keep this format consistent across every scale you report, and always state your reliability coefficient somewhere in the same section, for example “Cronbach’s alpha for the scale was .81, indicating good internal consistency.”
Common Mistakes Dissertation Students Make With Likert Data in SPSS
- Forgetting to reverse code negatively worded items before computing a composite score.
- Running Cronbach’s alpha after creating the composite score instead of before it.
- Treating a single Likert item as if it were a full scale.
- Skipping normality checks and picking a parametric test by habit.
- Reporting means without ever stating the scale’s reliability.
- Mixing 5-point and 7-point items in the same composite without adjusting or rescaling them first.
Get your research design right at the planning stage too. A Likert scale bolted onto the wrong design will still give you messy, hard-to-defend results, no matter how carefully you code and reverse code it in SPSS.
Should You Do This Yourself or Get Help?
Learning how to analyze Likert scale data in SPSS yourself is entirely doable if you have a few weeks and no urgent deadline breathing down your neck. If you are three weeks from submission, dealing with a low alpha you cannot fix, or an examiner who has already pushed back once, that is usually the point where a second pair of expert eyes is worth it. I have written a short guide on knowing when you actually need a dissertation expert if you are on the fence about it. Likert scale analysis for dissertation does not need to be a solo, sleepless battle, so reach out the moment your alpha refuses to cooperate, not three weeks after.
FAQ
Is Likert scale data ordinal or interval?
A single Likert item is ordinal. A composite Likert scale made of multiple reliable items is commonly treated as approximately interval for parametric testing, and this is the accepted convention in most social science dissertations, provided you check your assumptions first.
What is a good Cronbach’s alpha for a Likert scale?
0.70 or above is generally considered acceptable, 0.80 and above is good, and anything below 0.60 means the scale needs revision, usually starting with a check for reverse coding errors.
Can I run a t-test or ANOVA on Likert scale data?
Yes, but only on a composite score built from multiple items, and only after confirming the data is reasonably normal. For a single Likert item or non-normal data, use Mann-Whitney U or Kruskal-Wallis instead.
How do I reverse code a Likert scale item in SPSS?
Use Transform > Recode into Different Variables, flip the scale values (1 becomes 5, 2 becomes 4, and so on for a 5-point scale), and save it as a new variable so your original data stays intact.
What is the difference between a Likert item and a Likert scale?
A Likert item is one single rating question. A Likert scale is a group of related items combined into one score, tested for reliability using Cronbach’s alpha.
How many respondents do I need for Likert scale analysis?
It depends on your test, your design, and how you select respondents, so there is no single fixed number. Most parametric tests need at least 30 respondents per group as a rough starting point, and how you sample matters as much as how many, so it helps to know whether stratified or cluster sampling suits your population better than a plain random draw. Use a proper sample size calculator based on your expected effect size and design before you start collecting data, not after.
How is a Likert scale different from a semantic differential scale?
A semantic differential scale uses opposite adjective pairs, such as “Weak” to “Strong” or “Boring” to “Interesting,” instead of agreement statements. If your questionnaire uses adjective pairs rather than “agree, disagree” wording, you are working with a different scale type, and the SPSS steps in this guide will not map onto it directly.
Written by Siddharth, a dissertation statistics expert with over 12 years of experience guiding students through SPSS, R, and research design. Connect on LinkedIn.