
SPSS Tables for Dissertation Chapter 4: Which Ones Should You Include?
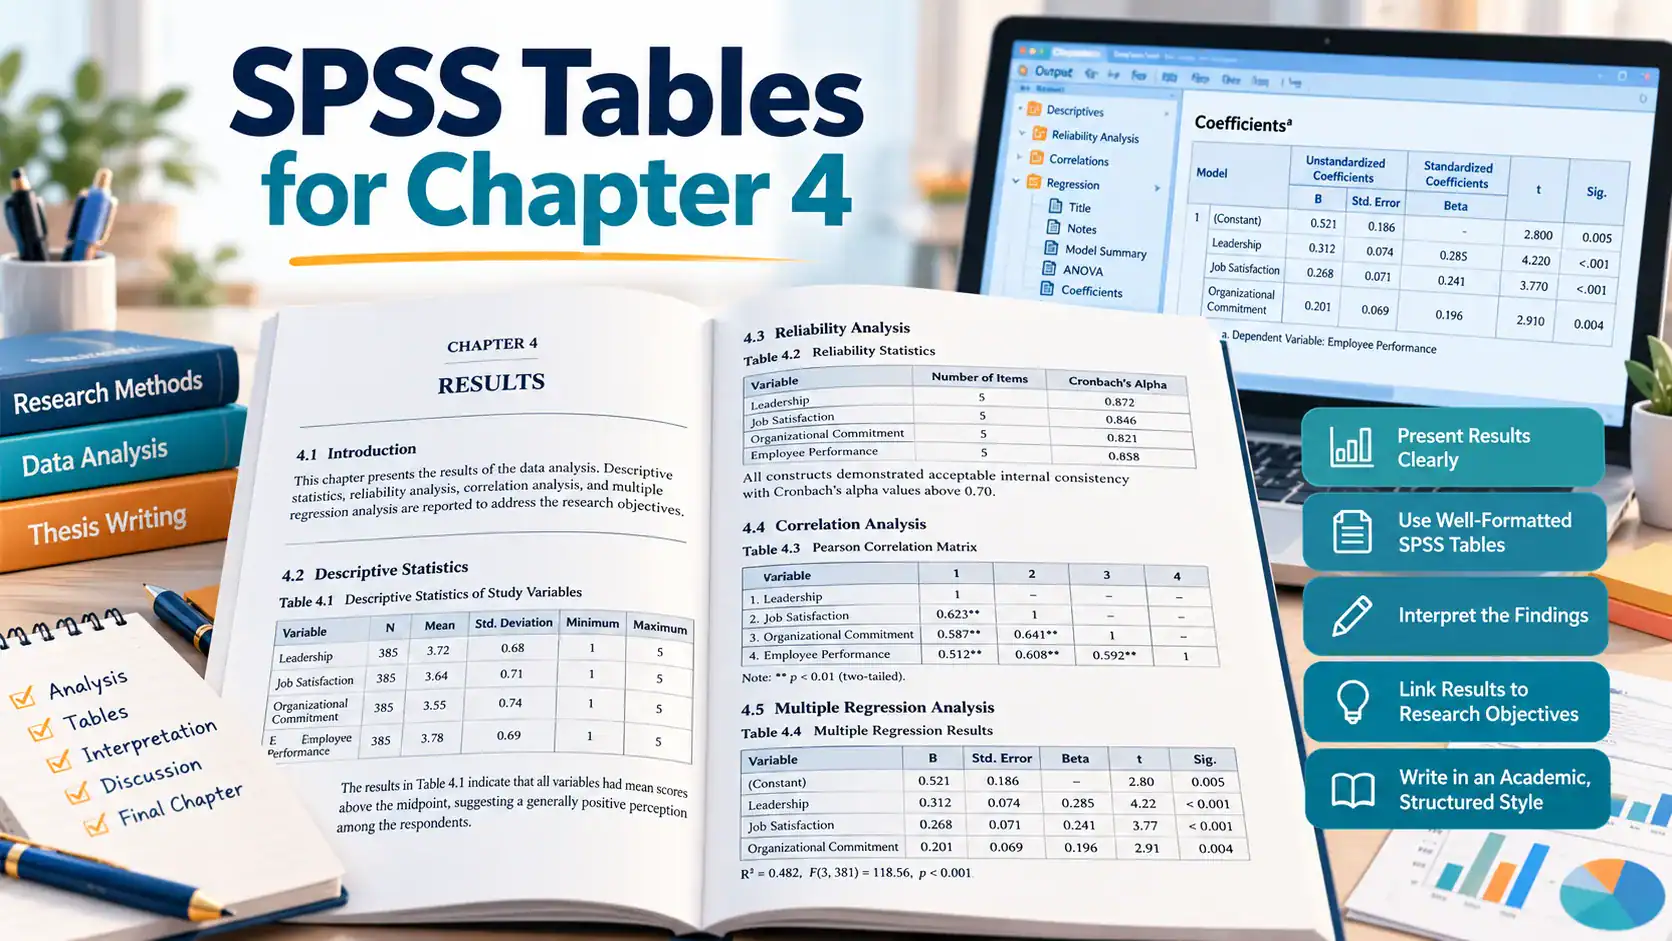
SPSS tables for dissertation chapter 4 are usually the single biggest source of panic I see in students I guide, and it is almost never about the statistics. It is about choosing which 5 tables to keep out of the 25 SPSS just handed you.
If your supervisor has already said “simplify your tables,” or you are staring at a full SPSS output chapter 4 dissertation file wondering where to even start, you are not alone. I get this exact message from students every single week.
I have been doing dissertation and research guidance for over 12 years now. I still open a student’s SPSS output file and see the same thing every single time. Every table the software generated, pasted in, in order, with zero editing. That is not a results chapter. That is a data dump with a chapter number on it.
This guide tells you exactly which SPSS tables to report in dissertation Chapter 4, which ones belong in the appendix, which to delete, and how to present SPSS results in dissertation writing the way an examiner actually expects.
The Short Answer
Three tables are non-negotiable in almost every quantitative Chapter 4, no matter what test you ran:
- A demographic or sample profile table (who your respondents actually are)
- A descriptive statistics table for your main study variables
- A reliability table if you used scaled questionnaire items (Cronbach’s Alpha)
Beyond these three, which regression tables to include in a dissertation, and which ANOVA tables to include, depends entirely on the test you ran. I will give you the exact list for every common test below.
Quick definition: Chapter 4 of a dissertation, often called the Results or Findings chapter, is the section where you present your analysed data objectively, using tables and figures, without discussing implications. Interpretation and discussion belong in Chapter 5, not here.
Why “Just Include Relevant Tables” Is Advice That Goes Nowhere
A lot of SPSS help content and freelance dissertation services circulating online tell you to “be selective” or “include relevant tables” and stop right there. I have read dozens of these pages while researching this one, and that is exactly where they stop being useful. Nobody tells you relevant according to what.
Here is the rule I give every student: every table in your chapter should map directly to a hypothesis or research question from Chapter 1. If a table does not answer one of your stated questions, it does not belong in the body of your chapter, full stop. This is really the foundation of how to write chapter 4 quantitative research sections well, every table and every sentence tied back to a hypothesis.
The test and tool you locked in during Chapter 3 is also what decides your Chapter 4 table list, not the other way round. If your methodology chapter says multiple regression, your results chapter owes the reader three specific regression tables, not one.
A short case from last year: An MBA student came to me with 32 SPSS output tables for a study with exactly 3 hypotheses. We cut it down to 9 tables. Her supervisor’s only comment on the revised draft was “much cleaner now.” Same data, same analysis, completely different impression.
SPSS Tables for Dissertation Chapter 4: The Test to Table Matrix
This is the part most generic guides skip entirely. Here is the direct reference I give students, test by test.
| Statistical test | Tables you must include | Include only if… |
|---|---|---|
| Descriptive / demographic | Sample profile table, descriptive statistics table | Always, for every quantitative study |
| Reliability | Cronbach’s Alpha table | You used scaled or Likert-type items |
| Correlation | Correlation matrix (Pearson or Spearman) | Use Spearman only if your data fails normality checks |
| Independent / paired t-test | Group means and t-test results table | Add a Cohen’s d value if your handbook expects effect sizes |
| One-way / two-way ANOVA | Omnibus ANOVA table | Post hoc table (Tukey, Bonferroni, Games-Howell) only if the omnibus result is significant and you have 3 or more groups |
| Regression | Model Summary, ANOVA, Coefficients | VIF or collinearity table only with 2 or more predictors |
| Chi-square | Cross-tabulation plus chi-square statistic | Always report expected count notes if any cell has a low expected frequency |
| Factor analysis (if used) | Total Variance Explained, Rotated Component Matrix | Only if your study involved scale validation beyond basic reliability |
A quick expansion on the sections people ask me about most:
Correlation tables
A single correlation matrix covering all your main variables is usually enough. If you ran both Pearson and Spearman, include only the one that matches your data’s distribution, not both, and check that decision with a normality test first (Shapiro-Wilk test guide). Choosing between the two correlation types is its own small decision worth getting right (Pearson vs Spearman correlation guide).
Stuck with Chapter 4 SPSS tables?
Get practical assistance reviewing which output tables answer your hypotheses.
Review My SPSS Tables on WhatsAppT-test tables
One results table showing group means, the t-value, degrees of freedom, and significance, with Cohen’s d alongside if effect size reporting is expected at your level. If your design is pre-post rather than two independent groups, check first whether a paired t-test is even the right test, since a lot of students default to it when repeated measures ANOVA fits better (paired t-test vs repeated measures ANOVA).
ANOVA tables
The most common question I get on which ANOVA tables to include in a dissertation is whether a post hoc table is mandatory. It is not, unless your omnibus ANOVA is significant and you have three or more groups. Report partial eta squared alongside the omnibus result if your programme expects effect sizes, and pick the correct post hoc test rather than defaulting to Tukey by habit (Tukey HSD vs Games-Howell).
Regression tables
If you are deciding which regression tables to include in your dissertation, the answer is three, not one:
- Model Summary (R, R-squared, adjusted R-squared)
- ANOVA table (tests whether the overall model is significant)
- Coefficients table (individual predictor significance, beta values, and confidence intervals if reported)
Add a VIF table only if you have two or more predictors (VIF guide). If your study involves sequential or time-ordered data, a Durbin-Watson table for autocorrelation belongs here too (Durbin-Watson test interpretation).
Which SPSS Tables Should You Include?
Open the statistical analysis you performed to see the typical tables to consider reporting. Your university’s guidelines and research design take precedence.
Correlation analysis
Consider one correlation matrix reporting the variables, correlation coefficients and significance information; report sample sizes where relevant.
One-way ANOVA
Consider group descriptive statistics and an omnibus ANOVA result. Add appropriate pairwise comparisons when justified and report an effect size where expected.
Multiple linear regression
Consider Model Summary, overall model ANOVA and Coefficients. Include diagnostic findings relevant to the model; detailed diagnostic output may belong in an appendix.
Exploratory factor analysis
Consider KMO and Bartlett’s test, factor retention evidence (such as eigenvalues or scree plot) and the final pattern/loadings matrix. Report rotation and extraction method.
Chi-square or t-test
Chi-square: cross-tabulations and test statistics with expected-count cautions. T-test: group descriptives and test results, including confidence interval and effect size when applicable.
Does This Table Belong in Chapter 4?
Open each SPSS output example and compare your choice with a suggested placement.
Correlation matrix directly testing a research hypothesis
Chapter 4 body: it directly answers the research question. Present a readable, reformatted table rather than a raw SPSS screenshot.
Detailed item-total statistics for a reliability check
Often appendix or supplementary material: report the main reliability result in the body, and retain detailed diagnostic output when necessary.
Regression Coefficients table for the main hypothesis
Chapter 4 body: coefficient estimates directly answer which predictors are associated with the outcome.
Unused, repeated SPSS output generated during experimentation
Usually omit from the submitted chapter, unless it documents an important diagnostic, analysis decision or required audit trail.
Chapter 4 Body vs Appendix: Where Each Table Goes
A simple 3-part rule I use with every student:
- Stays in the chapter body: any table tied directly to a hypothesis, plus your demographic and reliability tables
- Goes to the appendix: full SPSS output for diagnostic checks you ran only for your own verification (normality tests, full item-total statistics), referenced briefly in text
- Gets deleted: anything SPSS generated automatically that you never discuss, such as residual plots you did not analyse
If you are unsure whether something counts as a diagnostic check, assume it goes to the appendix rather than the main chapter.
Formatting SPSS Output Into APA Tables
Getting SPSS output tables APA format right is less about rules and more about one habit: never paste SPSS’s raw pivot table look directly from the Output Viewer. The real formatting authority here is APA Style’s own table guidelines, laid out in the Publication Manual (7th edition), not SPSS’s default output style.
- In the Output Viewer, right-click the table and choose “Copy,” then paste into Word as an editable table, not as a picture
- IBM SPSS Statistics ships with a built-in APA TableLook, which gets you most of the way, though it still needs manual cleanup for spacing and notes
- Remove default gridlines and apply a simple open table style (horizontal lines only, top, below headers, bottom)
- Number tables sequentially within each chapter (Table 4.1, Table 4.2), unless your university handbook specifically asks for continuous numbering across the whole dissertation
- Add a table note below the table only when you need to explain an abbreviation or a significance threshold
If you are still fuzzy on what actually counts as tabular data versus a figure in the first place, this is worth a quick read (what is tabular data).
Pairing Tables With Narrative
A table shows the numbers. The sentence right after it tells the reader what those numbers mean for your hypothesis, without wandering into discussion territory that belongs in Chapter 5.
How to interpret SPSS tables in dissertation writing
For a significant coefficient, state the direction and size plainly: “Experience positively predicted job performance (B = .42, p = .003).” For a non-significant result, do not bury or hide the table. Write it just as plainly: “The coefficient for X was not statistically significant (p = .312), suggesting no evidence of a relationship with Y in this sample.” A non-significant finding is still a finding, and examiners notice when students quietly skip over it.
Your SPSS results section dissertation content should stay purely descriptive at this stage. Save the “why” and the “so what” for Chapter 5.
A Quick Self-Audit Before You Submit
Save this checklist, it is the exact one I run through with every student before their Chapter 4 goes to committee:
- Does every table map to a hypothesis or research question?
- Have you removed duplicate or auto-generated SPSS tables you never discuss?
- Is every table numbered and referenced in the text (e.g., “as shown in Table 4.2”)?
- Does your regression section have all three required tables, not just one?
- Have post hoc tables been included only where the omnibus test was significant?
- Are tables pasted as editable Word tables, not screenshots?
- If your supervisor already said “simplify your tables” once, has that specific table actually been cut or moved to the appendix, not just reformatted?
FAQs
How many tables should a dissertation Chapter 4 have?
There is no fixed number. Most MBA and Master’s level chapters land somewhere between 6 and 12 tables, while PhD and DBA chapters tend to run higher because they usually test more hypotheses. What matters is that each table maps to a hypothesis, not the count itself.
What is the difference between Chapter 4 and Chapter 5?
Chapter 4 presents your results objectively, tables, figures, and statistics, with no interpretation. Chapter 5 is where you discuss what those results mean, connect them back to existing literature, and address limitations.
Should I include non-significant results in Chapter 4?
Yes. Report them plainly in both the table and the accompanying sentence. Omitting non-significant findings is a research integrity problem, not a formatting choice.
Can I paste SPSS output directly into my dissertation?
Not as a screenshot or raw pivot table. Copy it from the Output Viewer into Word as an editable table and reformat it to a simple APA-style layout before it goes anywhere near your chapter.
Do I need the ANOVA table alongside regression results?
Yes. The ANOVA table tells the reader whether your overall regression model is significant. The Coefficients table alone does not answer that question.
How do I format SPSS output tables in APA style?
Copy the table as an editable Word table, strip SPSS’s default gridlines for a simple open-table layout, and number tables by chapter (Table 4.1, 4.2) unless your handbook asks for continuous numbering.
What happens to SPSS tables I ran but I am not discussing?
They go in the appendix with a short in-text reference, or get deleted entirely if they served no purpose beyond your own checking.
About the author: I have guided dissertation and research students on data analysis and Chapter 4 writing for over 12 years, across MBA, Master’s, and PhD programmes in the US, UK, and beyond. Connect on LinkedIn.
If you are looking for SPSS dissertation results help that actually reviews your specific output rather than handing you a generic template, our SPSS tutoring support looks at your real tables, not just general advice.