
I can help you develop beautiful dashboard in Tableau
- 0
- (0)
Project Details
Why Hire Me?
As a data analyst with 7+ years of experience, I bring precision, design sense, and strategic thinking to Tableau dashboard development. My focus is not only on aesthetics but also on clarity, functionality, and actionable storytelling.
Why Clients Choose Me:
-
Expert in dashboard design, KPI reporting, and storytelling with data
-
Skilled in handling multi-source data blending and live connections
-
Adept in using filters, actions, parameters, LOD expressions
-
Experienced in diverse sectors: eCommerce, healthcare, logistics, education
-
Ensure clarity, speed, and user experience in every visualization
-
Provide post-delivery support and usage training
What I Need to Start Your Work
Please provide the following to begin your project smoothly:
1) Project Scope and Dashboard Objectives
-
Short overview of what the Tableau dashboard should solve or communicate
-
Clear KPIs and performance metrics you want tracked
2) Data Source and Integration
-
Complete datasets (Excel, CSV, database access, etc.)
-
Clarify data types, sources, and update frequencies
-
Mention if any cleaning or preprocessing has been done or is needed
3) Dashboard Design and Visualization
-
Preferences for dashboard structure and branding (fonts, colors, logos)
-
Types of visuals required: bar charts, line graphs, maps, KPI cards, etc.
-
List of interactivity features: filters, drilldowns, dynamic parameters
4) Analytical Depth and Reporting
-
Specific insights to highlight (e.g., daily sales, YoY trends, top categories)
-
Data update cycle (live, daily, weekly)
-
Required level of analysis: summary vs deep-dive
5) User Accessibility and Sharing
-
List of users and access roles (viewer/editor)
-
How you intend to share: Tableau Public, Tableau Online, Server, PDF
6) Data Security and Compliance
-
Any company or industry-level security or compliance needs
-
Protocol for secure data transfer and handling
7) Development Timeline
-
Final deadline and any milestones for check-ins or reviews
-
Whether the delivery will be staged or single-go
8) Communication and Collaboration
-
Preferred platforms: Zoom, WhatsApp, Google Meet, Email
-
Update frequency and review meeting preferences
9) Additional Features and Customization
-
Any advanced calculations or Tableau extensions needed
-
Other requirements such as mobile responsiveness or export formats
Portfolio

Sales Conversion Insights: Tableau Dashboard for Multi-City Retail Chain
A Tableau dashboard built to track product-level sales, customer conversion rates, and promotional effectiveness across multiple store locations. Designed for performance benchmarking and pricing insights in the retail sector.
Patient Flow Optimization: Interactive Tableau Dashboard for Hospital Resource Allocation
An interactive Tableau dashboard for visualizing real-time hospital capacity, bed availability, and emergency department traffic. Helps healthcare managers optimize resource use and improve patient experience.
Workforce Productivity Tracker: Tableau Dashboard for HR KPIs and Attrition Analysis
A comprehensive Tableau dashboard displaying department-wise productivity, training outcomes, and attrition rates. Designed to support HR decision-making in midsize to large firms.
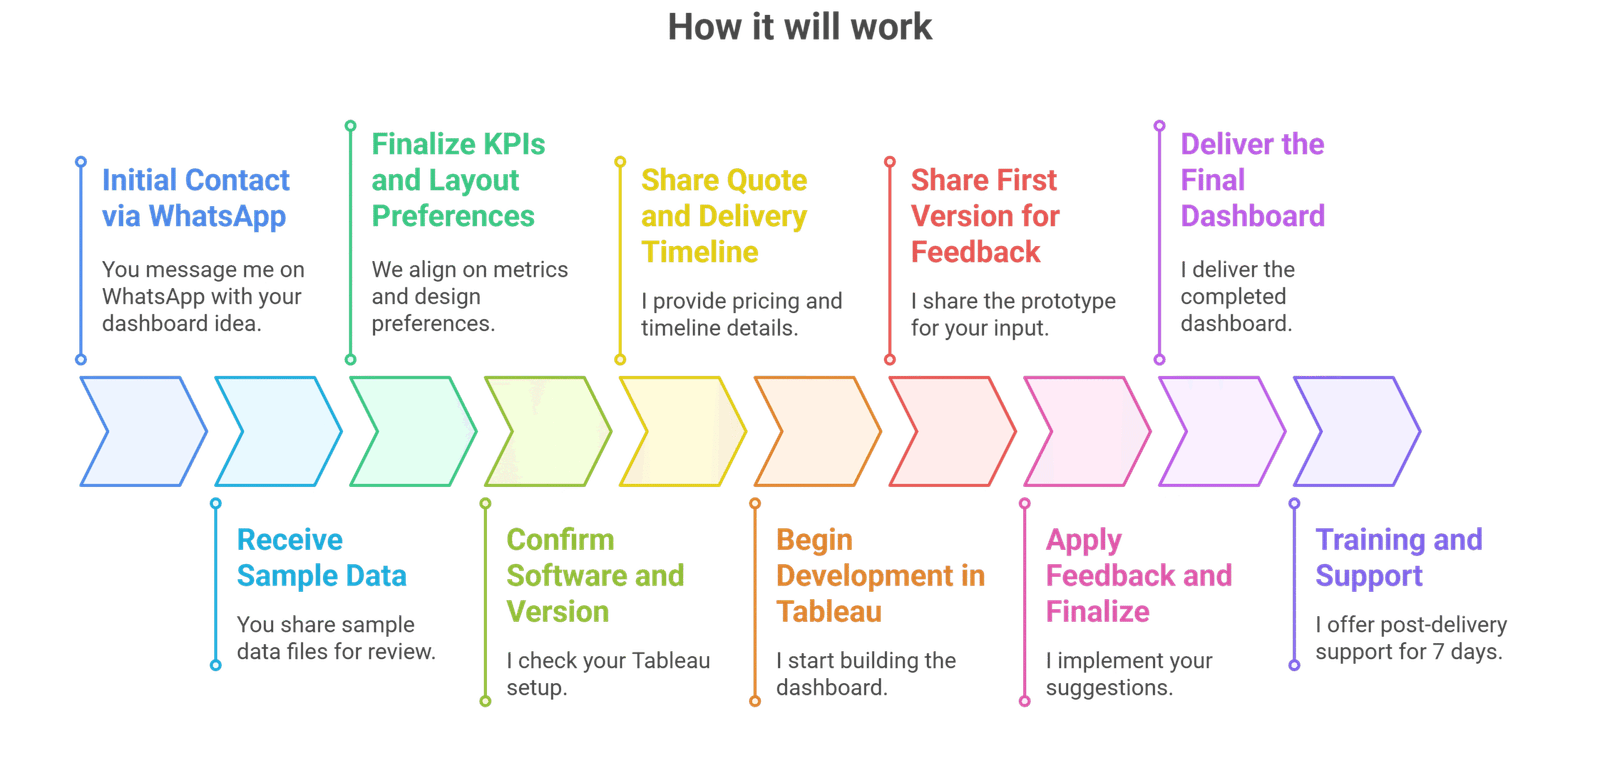
Process
Visual Start
Starts at $55
Basic dashboard with static visuals
-
 3
Days Delivery
3
Days Delivery
-
 1
Revision
1
Revision
Interactive Insights
Starts at $95
Dynamic dashboard with filters & charts
-
5
Days Delivery
-
3
Revisions
Executive Tableau Suite
Starts at $250
Fully custom dashboard, mobile-friendly
-
12
Days Delivery
-
Unlimited
Revisions


