
10 Common Sample Size Mistakes in Dissertation Research
Sample size mistakes in research are the single most common reason I get called into a dissertation at the last stage. Usually it’s three weeks before a defence or a viva, when the student realises their committee will not accept the number they picked. I have spent 12 years reviewing methodology chapters for students in the US, the UK, and India, and the pattern repeats itself across every discipline. A student picks a number that feels safe, runs the study, and only then discovers the number was never defensible in the first place.
This article walks through the 10 sample size mistakes in research I see most often in dissertation work. I’ve included real numbers and real examples, so you can catch yours before your committee does.
The 10 mistakes, at a glance
- Picking an arbitrary sample size
- Confusing population-based and power-based formulas
- Blind reliance on free online calculators
- Ignoring statistical power entirely
- Guessing or inflating the effect size assumption
- Overlooking nonresponse and attrition
- Not planning for subgroup or interaction analysis
- Using post-hoc power analysis to defend a small sample
- Mismatching the power analysis to the wrong statistical test
- Failing to document and justify the sample size decision
Why Sample Size Mistakes in Research Derail a Dissertation Methodology Chapter
Sample size matters because it directly determines whether your study can detect a real effect, and whether your conclusions hold up to committee or peer scrutiny. A sample size justification is the written explanation in your methodology chapter of how you arrived at your participant count, using your statistical test, your expected effect size, your alpha level, and your target power. That is the actual definition examiners work from. If your chapter does not contain this reasoning, you have not justified your sample size, you have only stated it.
Most common sample size calculation mistakes trace back to one root cause. Students treat sample size as a number to report rather than a number to prove. In my years reviewing methodology chapters across the US, UK, and India, the sample size section is very often a single sentence with no formula, no citation, and no power analysis behind it.
A 2017 assessment of 62 medical dissertations at the National Cancer Institute, Cairo University found that only four had estimated sample size or power at all. The median statistical power across the group was 35.5 percent, well below the 80 percent threshold most committees expect. These were doctoral-level studies, which tells me this is a training gap, not a one-off student mistake.
Population-Based Formulas vs Power-Based Sample Size
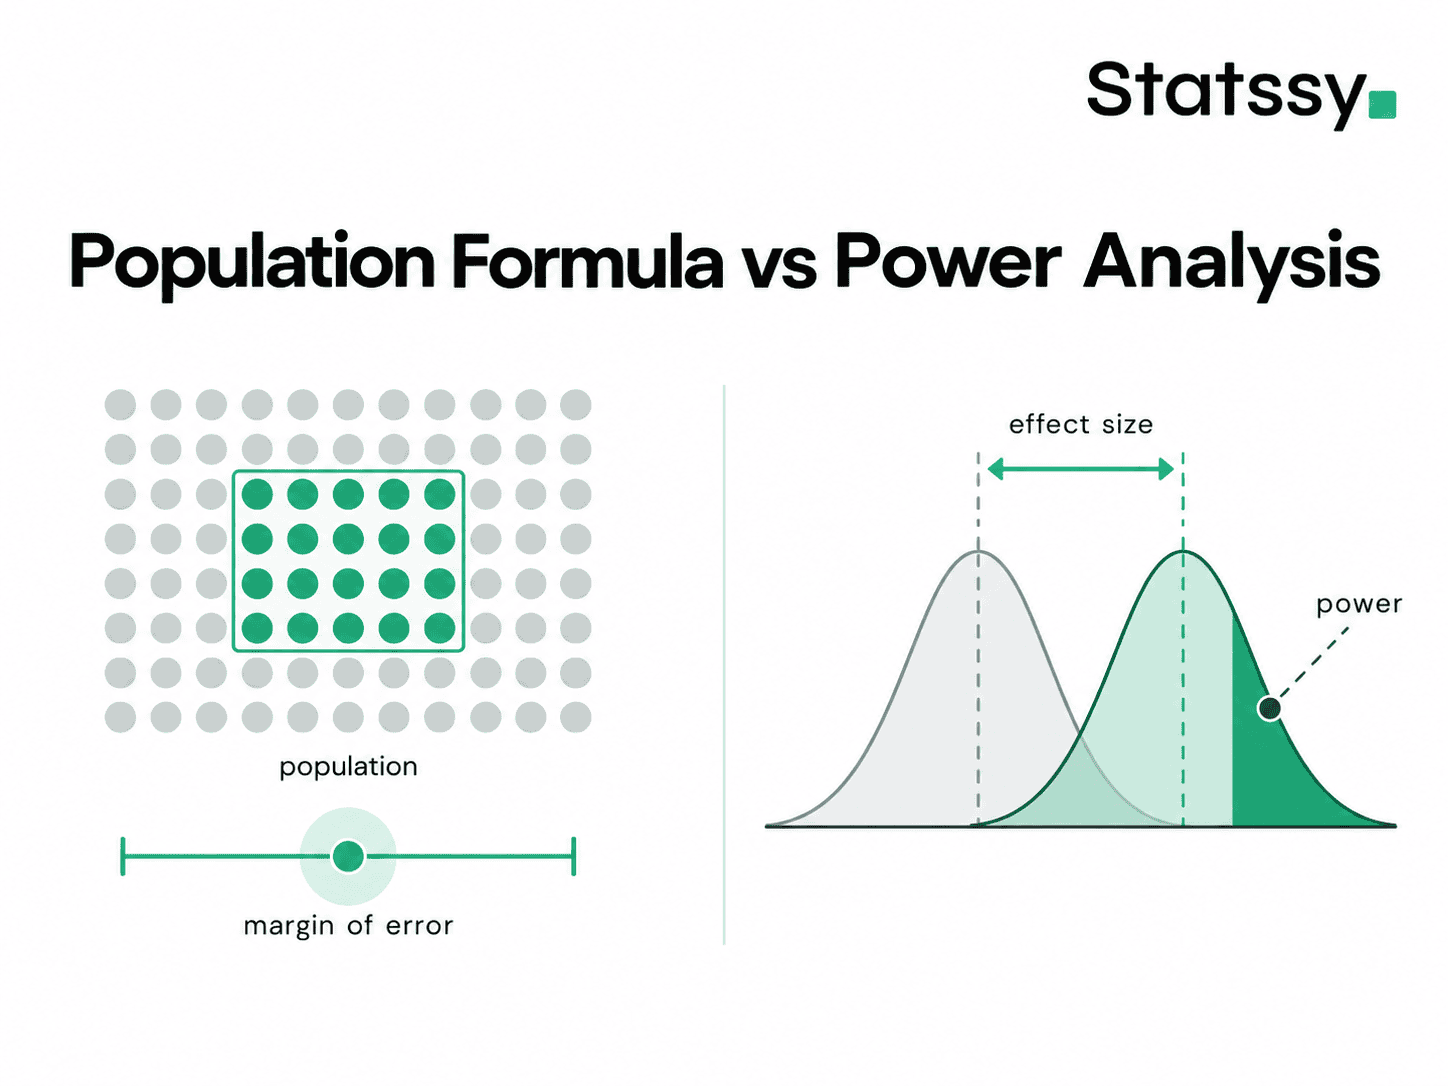
Cochran’s formula and the Krejcie-Morgan table calculate how many people you need to represent a known population within a margin of error. A power analysis calculates how many participants you need to detect a real effect given your statistical test. Dissertations testing a hypothesis almost always need the second type, not the first.
Mistake 1 – Picking an Arbitrary Sample Size
The most frequent of all sample size mistakes in research is choosing a round number because it feels substantial. I see 100, 150, and 384 (the generic 95 percent confidence, 5 percent margin figure) used constantly, regardless of what statistical test the student is actually running.
Why Round Numbers Do Not Survive Committee Questioning
A student I worked with on a UK MBA dissertation chose 150 respondents because a classmate used that figure the year before. At the viva, the external examiner asked a simple question, why 150 and not 100. The student had no answer, and the panel sent the methodology back for revision, delaying the defence by six weeks.
A bigger number is not automatically a safer one either. An oversized sample wastes participant goodwill and research budget, and it can make a trivially small, practically meaningless effect come out statistically significant. The goal is an adequately powered sample, not the largest one you can manage.
Mistake 2 – Confusing Population-Based and Power-Based Sample Size Formulas
This is where I see genuine confusion rather than carelessness, and graduate research guides often make it worse by using both formula types in the same paragraph without separating them. A dissertation testing a hypothesis through regression, ANOVA, or correlation needs a power-based calculation. A simple descriptive survey estimating a population proportion can use a population-based formula instead.
When Cochran’s Formula or Krejcie-Morgan Actually Applies
These two formulas fit a narrow case, a descriptive study with no hypothesis test, just an estimate of a characteristic in a known population. Population-based formulas are built around a margin of error and a confidence interval, and they support generalizability to a defined population. A power-based calculation instead protects your study’s ability to detect a real effect, which is a different kind of external validity question entirely. If your design mixes probability sampling with group comparisons, working out selecting the appropriate sampling strategy before you calculate anything will stop you mixing the two formula types by accident.
Mistake 3 – Blind Reliance on Free Online Sample Size Calculators
Free calculators built for market research polling assume a fixed population proportion, a margin of error, and a confidence level. None of that maps onto a power analysis for a t-test, ANCOVA, or multiple regression.
What These Calculators Assume That Your Study Might Not Meet
I reviewed several calculator pages while researching this piece, and most bury their own limitations in small print that students skip entirely. One assumption repeated across three different sites was that the population proportion stays constant for the entire study period, which rarely holds for anything measured over time. A sample size and statistical power calculator built for hypothesis testing gives you a defensible starting figure instead of a generic guess.
Mistake 4 – Statistical Power and Sample Size Mistakes That Undercut Your Results
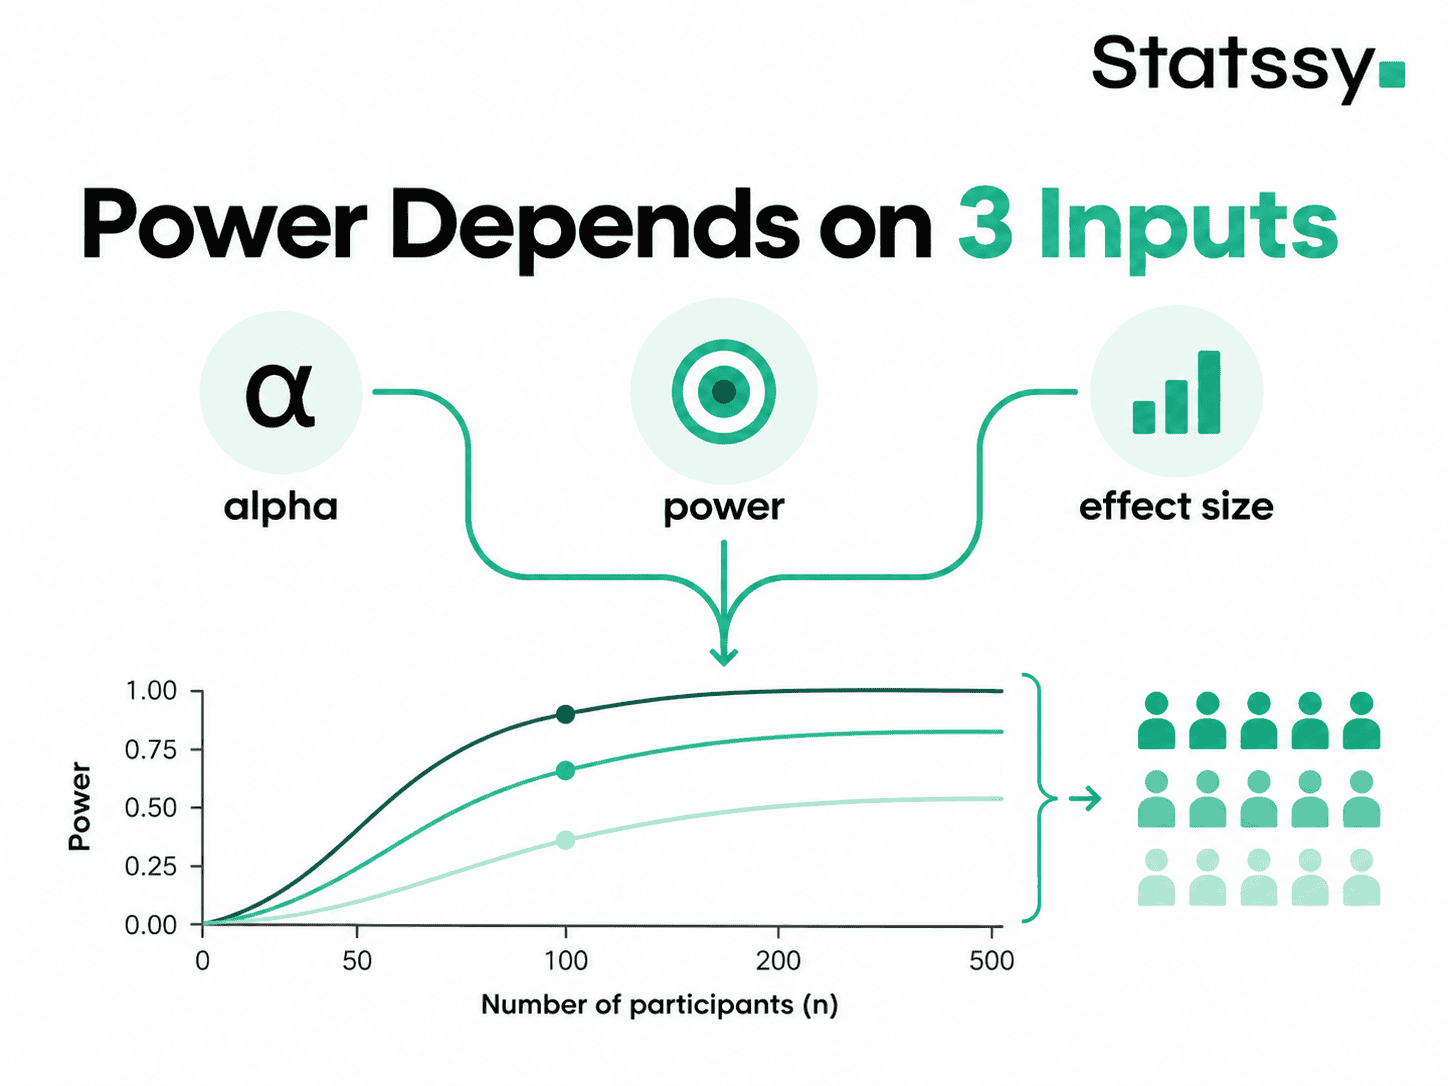
Three inputs decide your statistical power, your alpha level (usually .05), your target power (usually .80), and your expected effect size. Skip any one of these and your study is underpowered before you collect a single response.
Insufficient Sample Size in Research, What It Looks Like in Your Results Chapter
A review of PhD theses at the University of Kragujevac found that 93 percent of the 15 theses examined had at least one statistical error, and insufficient power from a small sample was the single most frequent mistake recorded. These were already-approved doctoral theses, which shows this gets missed even at final review stage.
Type I and Type II Error, the Two Risks Power Protects Against
A Type I error is finding an effect that is not really there. A Type II error is missing an effect that actually exists, and this is the risk an underpowered study runs into most. Reporting both error types by name in your methodology chapter signals to your committee that you understand what your sample size decision is actually protecting against.
Mistake 5 – Guessing or Inflating Your Effect Size Assumption
Your effect size assumption drives the entire calculation, and small errors compound badly. Halving your assumed effect size roughly quadruples the sample size you need.
The Pilot-Inflation Trap
A nursing dissertation student I worked with ran a pilot study with 15 participants, found what looked like a large effect, and planned her main study for 40 participants based on that figure. The true effect in the full population was much smaller, and her main study came back non-significant even though a real effect existed. Small pilot samples routinely produce unstable, inflated effect size estimates, which is exactly what happened here.
Where possible, pull your effect size estimate from prior published research on a similar population rather than your own small pilot. If nothing exists in the literature for your exact variables, Cohen’s conventional medium effect size benchmark is the defensible default examiners expect to see cited, not invented on the spot.
Mistake 6 – Overlooking Expected Nonresponse and Attrition
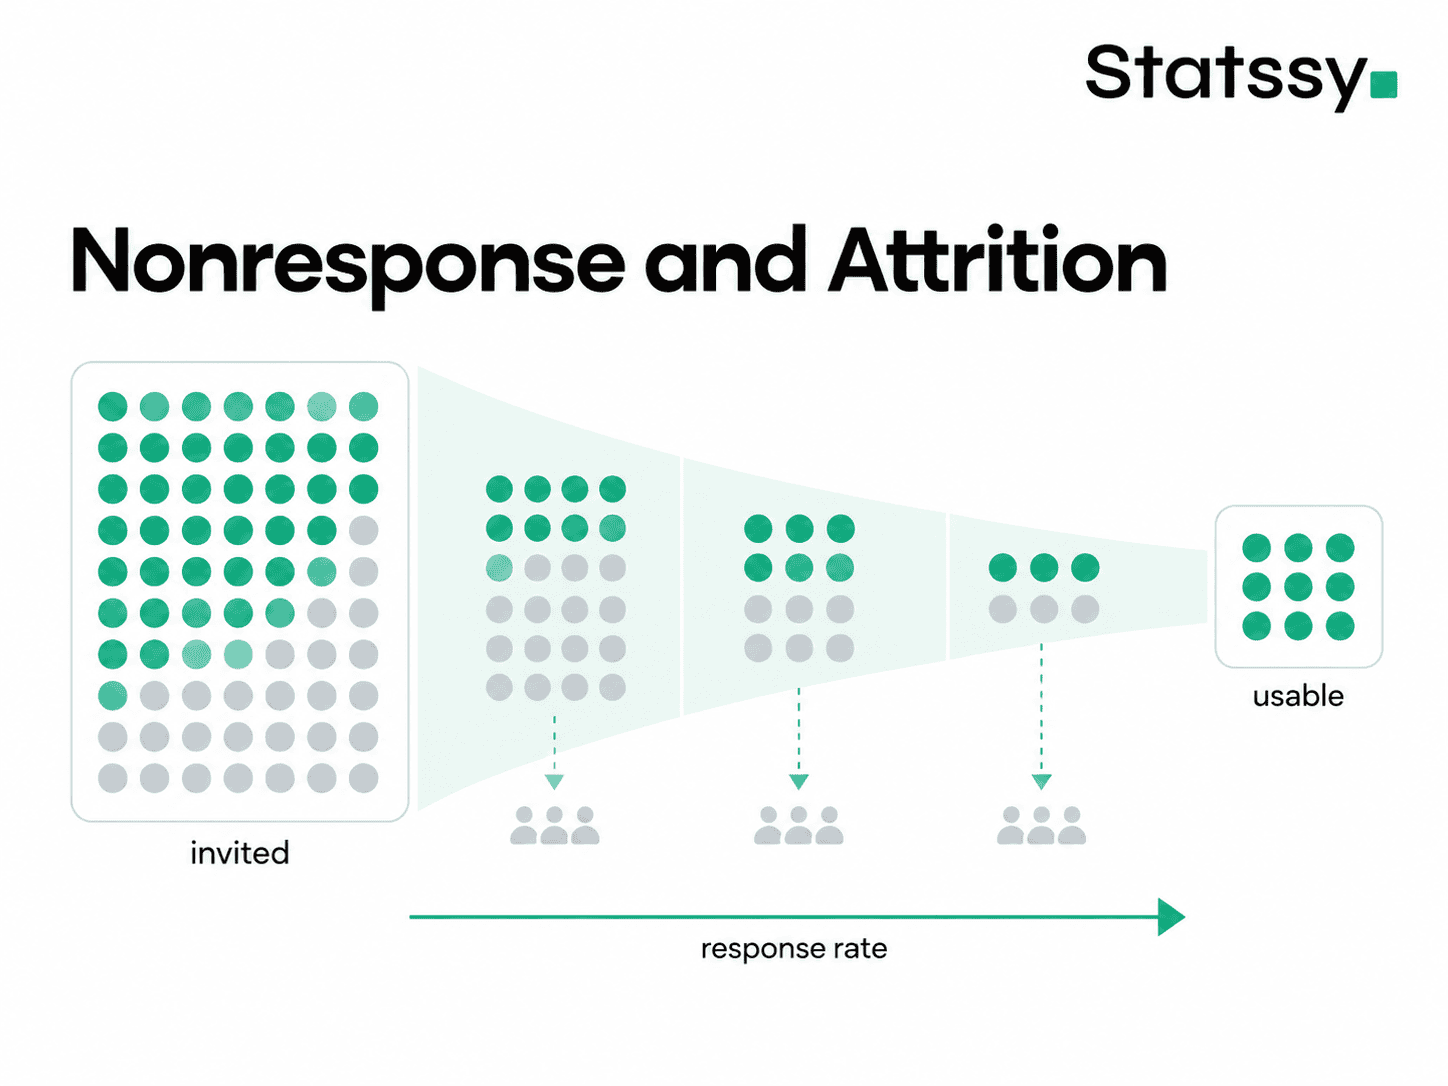
Your power analysis gives you the minimum number of completed, usable responses you need. It says nothing about how many people you need to approach to reach that number.
How Much to Inflate Your Sample, Worked Example
If you expect 30 percent nonresponse and your power analysis says you need 200 completed responses, you need to approach roughly 286 people. Missing or incomplete responses also shrink your usable sample after data cleaning, so the number you start analysis with is often smaller than the number you collected.
Longitudinal and Multi-Wave Studies Need a Bigger Buffer
Attrition compounds at every wave of a repeated-measures design. If your study tracks the same participants across time, deciding on a longitudinal design before you finalise your sample size stops you under-recruiting at wave one and losing your power by wave three.
Mistake 7 – Not Planning for Subgroup or Interaction Analysis
A power analysis for your main hypothesis does not automatically cover subgroup comparisons or interaction effects. If your research question includes anything like “does this effect differ by gender,” you need a separate, usually larger, power calculation for that specific comparison.
Why Your Main-Effect Sample Size Is Not Enough for Moderation Analysis
I once reviewed a marketing dissertation where the student calculated sample size for an overall ANOVA, then ran post-hoc subgroup comparisons by age bracket on the same 120 participants. The overall test showed a clear effect. Every subgroup comparison came back non-significant, not because the effect did not exist in each group, but because each subgroup cell had too few participants to detect it. If your sampling approach already leans on convenience rather than probability methods, understanding convenience sampling limitations matters even more here, because a non-representative sample makes subgroup comparisons shakier still.
Mistake 8 – Using Post-Hoc Power Analysis to Defend a Small Sample
Post-hoc, or retrospective, power analysis calculates power after you already have your results, using your observed effect size and your actual sample size. Committees and examiners reject this as a defence almost every time, and they are right to.
Why Examiners Reject This After the Fact
Post-hoc power is calculated from the same two numbers that produced your p-value, so a non-significant result will almost always produce a low post-hoc power figure. It tells you nothing new, it just restates your result in a more technical-sounding way. If you are already past data collection with a small sample, report it honestly as a limitation with a proper a priori calculation showing what you would have needed, rather than retrofitting a power number after the fact.
Mistake 9 – Mismatching the Power Analysis to the Wrong Statistical Test
Your power analysis must match the exact statistical test you plan to run, not a simpler stand-in for it. I regularly see students calculate sample size for a t-test, then switch their actual analysis to a multiple regression with several predictors, without recalculating anything.
A Worked Example, t-test vs Multiple Regression
A multiple regression with three predictors at 80 percent power needs roughly 547 participants if the expected effect is small, 76 if medium, and 34 if large. A simple t-test calculation for the same study would give you an entirely different, much lower number. I once had a student discover this gap only after her proposal defence, when her committee asked how her t-test power calculation justified a regression with five predictors. It did not, and she had to redo the calculation and delay data collection by a month. If your design shifts between a paired comparison and a repeated measure, knowing the difference between a paired t-test and repeated measures ANOVA before you lock in a sample size avoids exactly this problem.
Mistake 10 – Sample Size Justification Errors That Get Your Methodology Chapter Rejected
This mistake catches even students who did the calculation correctly. A defensible sample size section states the statistical test, the alpha level, the target power, the effect size with its source, the resulting minimum sample, and the inflation applied for nonresponse. Missing any one of these invites a committee question you cannot answer cleanly.
What a Defensible Sample Size Section Actually Contains
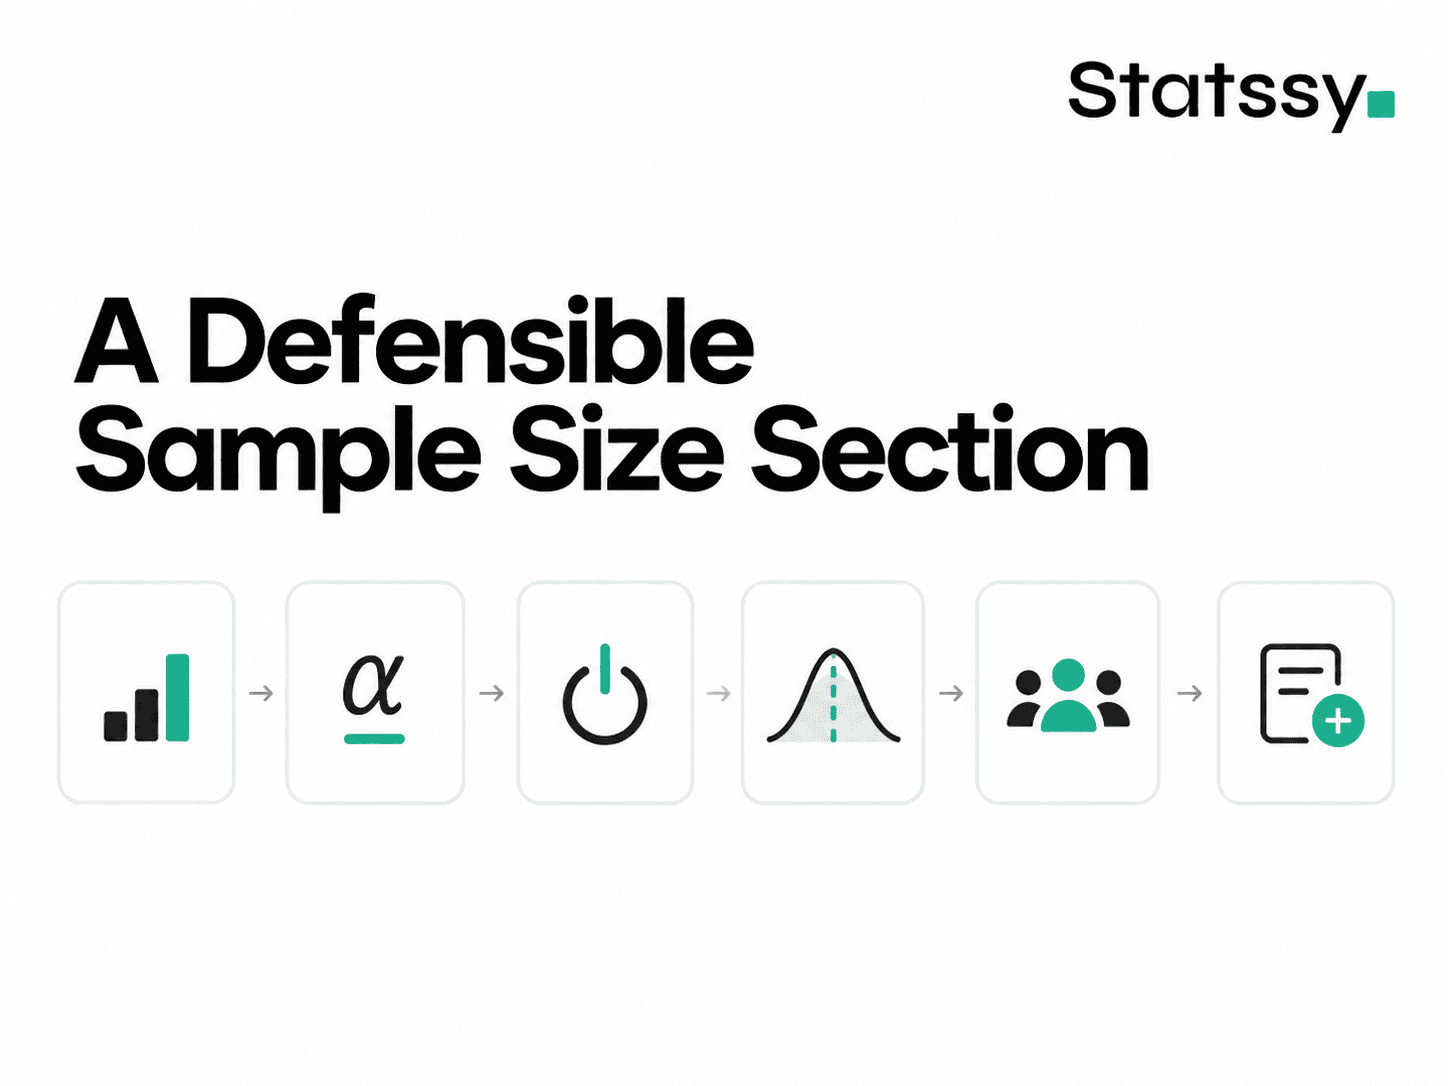
US students need this section to satisfy their IRB. UK students need it to satisfy their university ethics committee. In both cases, the committee wants the same underlying reasoning laid out in plain writing. Organising your methodology chapter around these six elements, in this order, makes the section far easier for a committee to approve on the first pass.
The G*Power and Citation Checklist for Chapter 3
G*Power is free, built at Heinrich Heine University, and produces a results screen you can paste directly into your methodology chapter with a citation. Keep that screenshot. A documented, cited calculation is far harder to argue with at a defence than a remembered number with no paper trail behind it.
What to Do If Your Committee Rejects Your Sample Size Justification
This happens more often than students expect, and it is fixable without starting over. First, ask your committee exactly which of the six elements above was missing or unclear, rather than guessing. Second, rerun your G*Power calculation with the specific test you will actually use and save the output screen as proof. Third, if you are already past data collection, reframe the gap honestly as a stated limitation backed by an a priori calculation, rather than trying to defend the original number after the fact.
A rejection at this stage is almost always a documentation problem, not a redesign problem. I have taken students from a rejected Chapter 3 to an approved resubmission within a week, simply by adding the missing reasoning rather than changing the actual sample.
How to Determine Appropriate Sample Size for Your Dissertation, Step by Step
- Identify the exact statistical test you will run, not a simplified stand-in for it
- Set your alpha level, typically .05, and your target power, typically .80
- Find your expected effect size from prior published research on a similar population
- Run the calculation in G*Power or an equivalent power analysis tool
- Inflate the resulting figure for expected nonresponse and attrition
- Add extra participants for any planned subgroup or interaction analysis
- Document every input with its source directly in your methodology chapter
A Quick Checklist Before You Submit Your Methodology Chapter
- Does your sample size match the actual test in your analysis plan, not an earlier draft of it
- Is your effect size sourced from literature, not your own small pilot
- Have you inflated for nonresponse and, if longitudinal, for attrition across waves
- Have you saved your G*Power output as a citable screenshot
- If this is a mixed methods study, have you justified the quantitative strand through power analysis and the qualitative strand through saturation logic separately
Frequently Asked Questions
What is a good sample size for a dissertation
There is no single good number. It depends entirely on your statistical test, your expected effect size, and your target power. A multiple regression with several predictors and a small expected effect can need over 500 participants, while a large-effect t-test might need under 40.
How do I calculate sample size for my dissertation using G*Power
Open G*Power, select the statistical test matching your planned analysis, choose “a priori” to compute sample size, enter your alpha, your target power, and your effect size, then run the calculation. Save the results screen for your methodology chapter.
Does a bigger sample size always mean better research
No. An oversized sample wastes time, money, and participant goodwill, and can make trivially small effects appear statistically significant. The goal is an adequately powered sample, not the largest one possible.
Can I use a free online sample size calculator for my dissertation
Only for population-based designs like a simple descriptive survey. For hypothesis-testing dissertations using regression, ANOVA, or similar tests, you need a power analysis tool, not a generic margin-of-error calculator.
What happens if my dissertation sample size is too small
Your study risks a Type II error, meaning you fail to detect a real effect that exists. Your committee may also flag the design as a limitation serious enough to require revision before approval.
How much extra should I add to my sample size for nonresponse
A common approach is dividing your required completed sample by your expected response rate. If you need 200 completed responses and expect a 70 percent response rate, you should approach around 286 people.
Is post-hoc power analysis acceptable in a dissertation defence
Most committees do not accept it as a justification, because it is mathematically tied to your p-value and adds no new information. Report low power as an acknowledged limitation instead, backed by what your a priori calculation would have required.
How do I report sample size justification in APA format
State the test, alpha, power, effect size with its citation, and resulting N as a short narrative paragraph in your methods section, followed by the G*Power citation. Most university templates in the US and UK expect this as a standalone subsection, not folded into your participants paragraph.
What is a defensible sample size for a mixed methods dissertation
Your quantitative strand still needs a full power analysis exactly as described above. Your qualitative strand follows a different logic, typically saturation, where you stop recruiting once new interviews stop producing new themes, not a fixed number decided in advance.
Still unsure whether your current sample size will hold up at your defence? Here’s how to know if you need a dissertation expert to check it before your committee does.