
Supervisor Asked for Effect Size and Confidence Interval SPSS: What Should You Report?
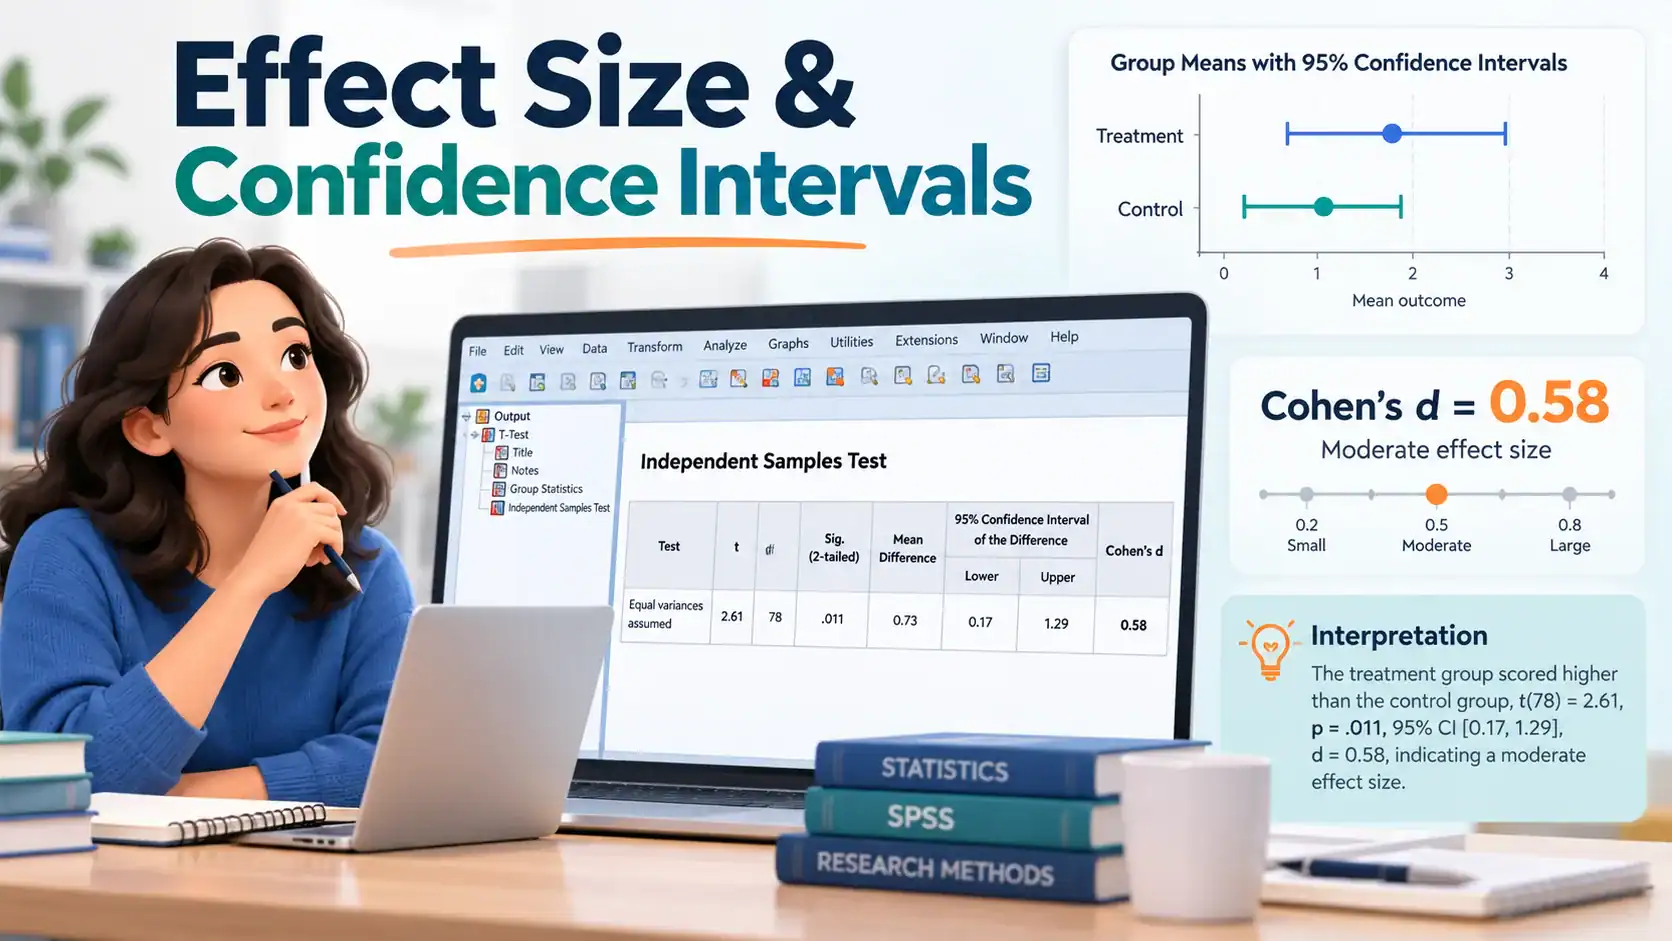
Effect size and confidence interval SPSS output is exactly what that one-line supervisor comment is pointing at, and most students have no idea which cell in the output it actually means. I have read this same comment in margin notes for 12 years now, scrawled under a perfectly significant t-test or ANOVA, always with zero example attached.
This is not your supervisor being difficult. It is the single most common gap I see in dissertation results chapters, across UK, US and Indian universities alike. If you landed here searching how to report effect size SPSS wants, here is the short version before the detail below: pick the number that matches your test from the table in the next section, pull it from the exact SPSS table named next to it, and pair it with its 95% confidence interval before you write a single sentence.
Why Your Supervisor Is Suddenly Asking for This
APA’s 7th edition made effect size reporting close to compulsory for quantitative results, specifically under its guidance in the Publication Manual, Section 6.44, which states that readers cannot judge a finding’s importance from significance alone. Most supervisors now check for it the way they check for a missing reference, as a formatting omission rather than a statistical one. A student I guided last year had a spotless regression chapter, strong R squared, clean write-up, and was still sent back twice because every p-value stood alone with no effect size next to it.
Here is my honest take: that APA guidance is correct in principle but gives almost no SPSS-specific direction on where to find these numbers. That gap, between what the manual asks for and what it actually shows you how to do, is where most of the confusion in dissertation groups comes from.
Effect Size vs P-Value: What Your Supervisor Is Actually Checking For
Why “significant” doesn’t mean “big” or “important”
A p-value only tells you whether a result is unlikely to be chance. It says nothing about how large or meaningful that result actually is. With a big enough sample, even a tiny, practically useless difference can turn up significant.
Effect size is a single number that tells you how large a difference or relationship is, independent of your sample size. Even when your p-value is already significant, you still need to report it, because significance only confirms the result is unlikely to be chance, not that it is large enough to matter in practice. That one addition is usually the entire fix a supervisor is asking for.
The one-line gap in most results chapters
Most drafts I review stop at “p = .03, therefore significant.” A supervisor reading that line cannot tell if your finding is trivial or substantial. Pairing the p-value with an effect size and its confidence interval closes that gap in a single added sentence.
Which Effect Size Should I Report?
This is the exact question I get asked on calls more than any other, so here is the short version before the detail below.
| Your analysis | Effect size to report | Where SPSS shows it |
|---|---|---|
| Two groups, continuous outcome (t-test) | Cohen’s d (or Hedges’ g for small samples) | T-Test output, “Effect Sizes” table |
| 3+ groups, continuous outcome (ANOVA) | Eta squared / partial eta squared | GLM / ANOVA table |
| Relationship between two continuous variables | Pearson’s r / R squared | Correlations table / Model Summary |
| Binary outcome, 2×2 design | Odds ratio | Logistic Regression, Exp(B) column |
| Categorical variables, larger tables | Cramer’s V | Crosstabs, Symmetric Measures table |
Comparing two groups needs Cohen’s d
Use this whenever you have compared two means, for example experimental versus control group scores.
Comparing three or more groups needs eta squared or partial eta squared
Use this after a one-way or factorial ANOVA. If your ANOVA is significant, the natural next step is a Tukey HSD or Games-Howell post-hoc test to locate exactly which groups differ, since your post-hoc choice affects how you present this result.
Relationships between variables need Pearson’s r or R squared
If you ran a correlation, r is already your effect size, you do not need to calculate anything extra. Choosing between Pearson and Spearman correlation is the test-selection step that comes before this one.
Categorical or binary outcomes need odds ratio or Cramer’s V
Use the odds ratio for logistic regression with a yes/no or pass/fail outcome. For larger categorical tables beyond a simple 2×2, such as comparing more than two groups across more than two categories, Cramer’s V from the Crosstabs procedure is the correct measure instead.
Stuck with effect sizes and confidence intervals?
Get practical assistance reviewing which effect-size measures and confidence intervals fit your analysis.
Check My Effect Sizes on WhatsAppHow to Report Cohen’s d SPSS Output Gives You
Does SPSS calculate Cohen’s d automatically? Yes, from version 27 onward, once you tick “Estimate effect sizes” in the T-Test dialog box. No, on older versions, where you calculate it by hand. That version difference is exactly where most guides online get this wrong, since many still tell every student to hand-calculate it regardless of version.
Where SPSS Shows Cohen’s d (If Your Version Supports It)
Run Analyze, then Compare Means, then Independent-Samples T-Test, and tick “Estimate effect sizes” in the dialog box before running it. Scroll past the Group Statistics table to the “Effect Sizes” table, where Cohen’s d SPSS prints directly alongside its 95% confidence interval.
Hand-Calculating Cohen’s d When SPSS Doesn’t Show It
- Subtract one group mean from the other to get the mean difference.
- Calculate the pooled standard deviation across both groups.
- Divide the mean difference by the pooled standard deviation to get Cohen’s d.
- If you do not have SPSS available at that moment, free tools such as jamovi or JASP calculate the same value with its confidence interval included, and G*Power can check whether your sample size was large enough to detect an effect of that size in the first place.
Small Samples Need Hedges’ g, Not Cohen’s d
If your group size is under about 20 per group, report Hedges’ g instead. It corrects for the small-sample bias that inflates Cohen’s d when samples are small, and many methodology texts in education and health research recommend it below that threshold.
Interpreting Small, Medium and Large
Interpretation benchmark, commonly cited from Cohen’s original work: 0.2 is a small effect, 0.5 is medium, 0.8 is large. I would add a caution here that your opinion piece should carry too, these cutoffs are generic and should always be read against your specific field, not applied mechanically.
APA Sentence for Cohen’s d
t(df) = value, p = value, d = value, 95% CI [lower, upper].
How to Report Eta Squared and Partial Eta Squared From an SPSS ANOVA
Every eta squared SPSS ANOVA output starts in the same GLM table, whether you ran a one-way or a factorial design.
Where SPSS Shows Partial Eta Squared
SPSS’s GLM output only ever gives you partial eta squared, labelled exactly that in the ANOVA table. This single labelling fact causes more confusion in dissertation groups than almost anything else in this entire topic. For interpretation, Cohen’s benchmarks are .01 for a small effect, .06 for medium, and .14 for large, the same logic as Cohen’s d but on a different scale.
Eta Squared vs Partial Eta Squared: Which Your Field Expects
Partial eta squared SPSS labelling is where almost all the confusion starts, because classical eta squared and partial eta squared are mathematically different once you have more than one factor in your design. A well-cited 2011 review by Richardson pointed out that the two have been confused for decades in published research, partly because early SPSS versions mislabelled partial eta squared as plain eta squared. My honest opinion: that historical labelling error is still echoing through student confusion today, and most research methods handbooks never explain it clearly.
For a one-way ANOVA the two values are identical, so this distinction only matters once your design gets more complex. Partial eta squared has become the dominant convention across most education and psychology journals, though some reviewers still expect classical eta squared for comparability across studies. Check your specific target journal or department’s author guidelines before deciding which one to report.
Omega Squared: The Unbiased Alternative SPSS Doesn’t Print
Omega squared is a less biased estimate of the true population effect than eta squared, since eta squared tends to overstate the effect in smaller samples. SPSS does not output it directly, so you calculate it from the same sum-of-squares values already sitting in your ANOVA table if a reviewer specifically asks for it.
APA Sentence for ANOVA Effect Size
F(df1, df2) = value, p = value, partial eta squared = value.
How to Report Odds Ratios and Their Confidence Intervals
The odds ratio confidence interval SPSS prints for you sits right next to Exp(B) in the logistic regression output, no extra calculation needed.
Where to Find the Odds Ratio and Its CI
Logistic regression hands you the odds ratio directly, in the Exp(B) column of the Variables in the Equation table. SPSS prints the 95% confidence interval right next to it in the same row.
Reading a Confidence Interval That Crosses 1.0
The one rule students miss constantly is that an odds ratio’s “no effect” point is 1.0, not 0. If your confidence interval crosses 1.0, the result is not significant, regardless of how far the point estimate sits from 1.
A psychology dissertation student I worked with in Mumbai last term ran a logistic regression on an exam-anxiety intervention, and her odds ratio came out at 2.1. Her supervisor sent the chapter back because the confidence interval was missing entirely. Once we added 95% CI [1.3, 3.4] straight from the same output table, it was accepted with no further comments.
Beyond 2×2 Tables: Cramer’s V for Larger Categorical Designs
Odds ratio works cleanly for a 2×2 table, but once you have more than two groups or more than two outcome categories, Cramer’s V from the Crosstabs Symmetric Measures table is the correct effect size instead.
APA Sentence for Odds Ratio
OR = value, 95% CI [lower, upper], p = value.
How to Report Confidence Intervals in Regression
Regression confidence intervals SPSS can show are switched off by default, you have to turn them on yourself before running the analysis.
Switching On Confidence Intervals in SPSS Regression
Click the Statistics button in the Linear Regression dialogue and tick “Confidence Intervals” before running the analysis. Checking VIF values in the same dialogue is worth doing at the same time, since multicollinearity affects how trustworthy your coefficients are.
Reading the B Coefficient’s Interval
Once ticked, SPSS adds a 95% CI column next to each unstandardised B coefficient in the Coefficients table. A narrow interval around B tells your supervisor the estimate is precise, a wide one tells them it could be far off in either direction.
APA Sentence for Regression
B = value, 95% CI [lower, upper], p = value.
SPSS Confidence Interval Interpretation: What 95% Actually Means
A 95% confidence interval means that if you repeated your study many times, 95% of the intervals calculated this way would contain the true population value. It does not mean there is a 95% chance the true value falls in this one specific interval, and that is the single most common misreading I correct in viva prep sessions.
Narrow intervals signal a precise estimate, usually from a larger sample. Wide intervals signal more uncertainty, and an honest results chapter says so rather than glossing over it.
Need expert help with effect sizes and confidence intervals?
Get guidance on your effect sizes, interval interpretation and reporting.
Review My Statistical Reporting on WhatsAppWhat to Put in Your Effect Size SPSS Dissertation Results Chapter
Effect sizes and confidence intervals belong in the results chapter, stated plainly alongside the test statistic. Save the interpretation of whether that effect is practically meaningful for your field for the discussion chapter, that is where supervisors expect the “so what” to appear.
Worked example, one paragraph combining all three:
“An independent-samples t-test showed higher scores in the intervention group, t(58) = 2.41, p = .019, d = 0.62, 95% CI [0.11, 1.13]. A one-way ANOVA across the three training conditions was significant, F(2, 87) = 4.30, p = .017, partial eta squared = .09. Logistic regression showed attendance predicted completion, OR = 1.84, 95% CI [1.12, 3.03], p = .016.”
Supervisor red flags checklist:
- Significant p-value with no effect size next to it, fix by adding the matching value from the tables above.
- “Eta squared” written when SPSS actually printed partial eta squared, fix by naming the exact measure SPSS gave you.
- Confidence interval missing for a reported odds ratio, fix by re-reading it off the Exp(B) column.
- Cohen’s d reported with no interval, fix by checking the Effect Sizes table or calculating it by hand.
If you are still unsure whether your specific results chapter is complete, how to know if you need a dissertation expert walks through exactly that decision.
FAQ
How do I report a 95% confidence interval in APA format?
Write it directly after the point estimate in square brackets, for example d = 0.62, 95% CI [0.11, 1.13].
How do you report an odds ratio with a confidence interval?
State the odds ratio, then its 95% CI in brackets, then the p-value, for example OR = 1.84, 95% CI [1.12, 3.03], p = .016.
What’s a “good” confidence interval, how narrow should it be?
There is no universal cutoff, a narrower interval simply means a more precise estimate. Judge it against your sample size and field norms rather than a fixed number.
How do I calculate Cohen’s d by hand if SPSS doesn’t show it?
Subtract one group mean from the other, then divide by the pooled standard deviation of both groups.
Do I need an effect size if my result isn’t significant?
Yes, a non-significant result still benefits from an effect size, since it shows whether the finding was simply small or whether your study was underpowered to detect it.
Is R squared itself an effect size?
Yes, R squared already tells you the proportion of variance explained, you do not need a separate effect size calculation for regression.
Effect Size and Confidence Interval SPSS: Getting It Right the First Time
APA effect size reporting SPSS gives you is never really a statistics problem, it is a “which table am I even looking at” problem. Once you know the five pairings in the decision table above, effect size and confidence interval SPSS reporting stops being a guessing game and becomes a five-minute addition to a chapter you have already written.
If you want a second pair of eyes on your SPSS output before you submit, that is exactly what working with an SPSS tutor session is built for.