
Cronbach’s Alpha Low in SPSS: How I Fix a Weak Reliability Scale
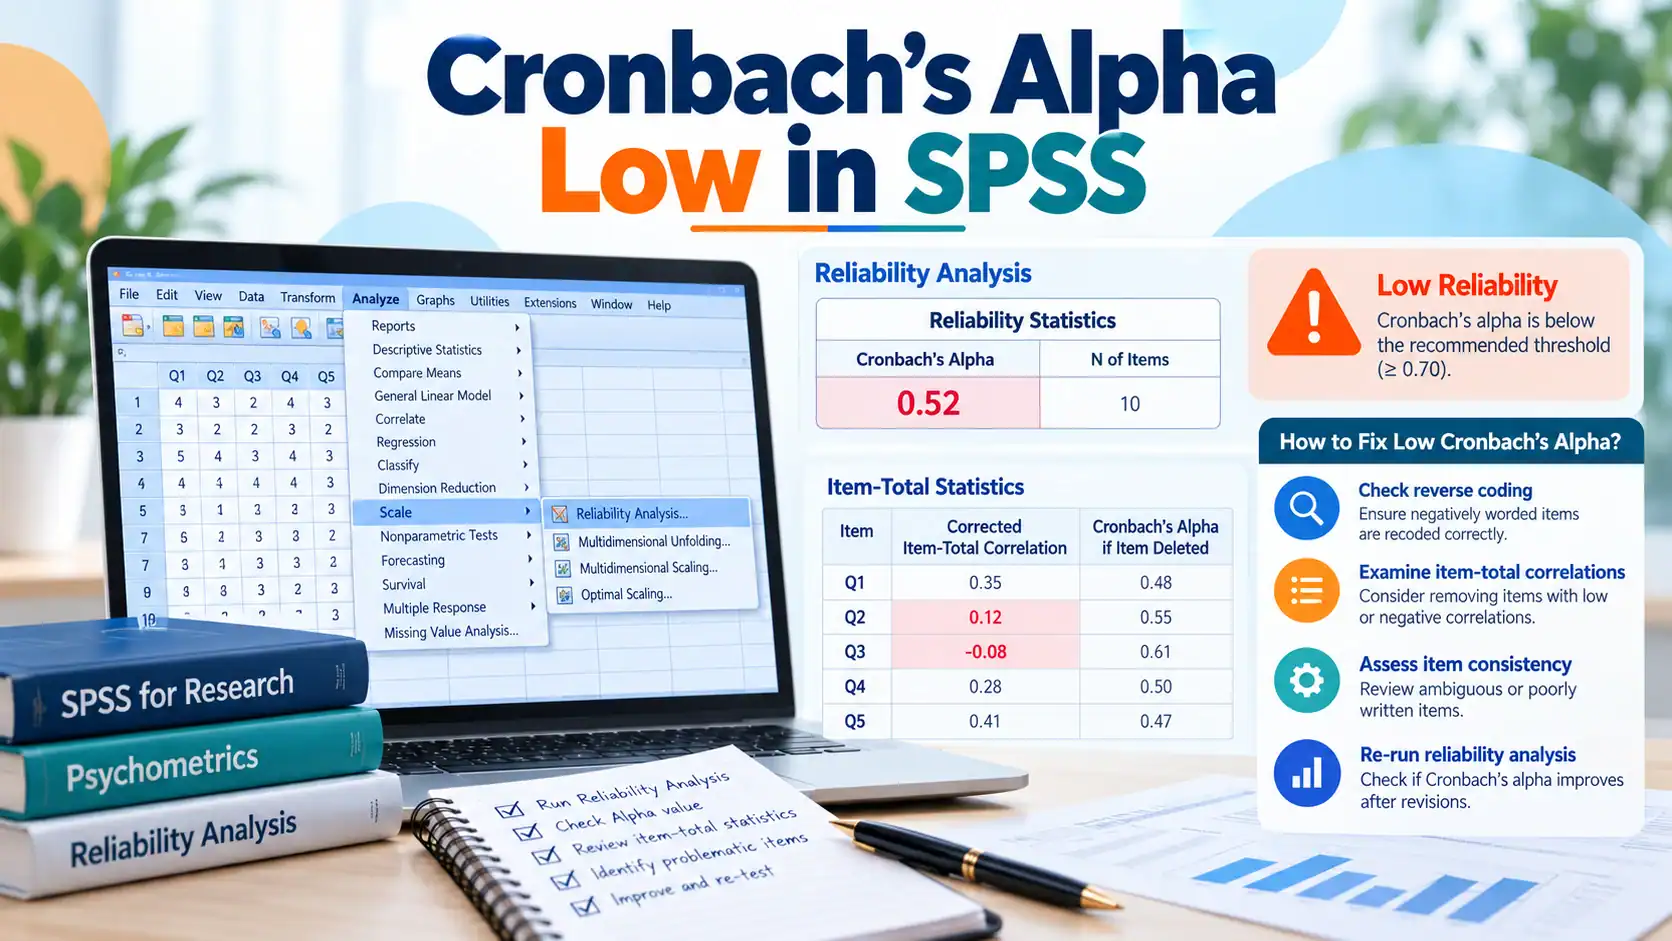
Cronbach’s alpha low SPSS is the message I get from panicked students almost every week of the year, usually two days before a supervisor meeting. You ran your reliability analysis, SPSS spat out a number like .54 or .61, and now you are staring at a methodology chapter that will not pass review.
In short, a low Cronbach’s alpha in SPSS almost always comes down to one of four causes:
- An item that was reverse-worded but never recoded
- One weak item with a low item-total correlation
- Too few items in the scale
- A construct that genuinely is not one-dimensional
I have fixed this exact problem across 12 years of dissertation and thesis consulting. I check these four causes in a fixed order, because checking them out of order wastes hours and sometimes leads students to delete a perfectly good item by mistake. In this guide I will show you how to fix a low reliability scale in SPSS, and how I diagnose which of the four causes is yours. I will also walk through real output from a case where I took a scale from alpha .52 to .81 without collecting a single new response.
What Counts as a Good Cronbach’s Alpha Score?
A Cronbach’s alpha below .70 is generally considered too low for scale reliability in a dissertation meant to measure a single construct. The most widely cited interpretation table comes from George and Mallery’s benchmark, documented by Indiana University’s Knowledge Base, which treats anything under .60 as unacceptable, .60 to .70 as questionable, and .70 and above as the usable range for most academic work.
Here is the threshold table I give every student:
| Alpha value | Interpretation |
|---|---|
| Above .90 | Excellent, sometimes too high (check for redundant items) |
| .80 to .90 | Good |
| .70 to .80 | Acceptable |
| .60 to .70 | Questionable, defend with caution |
| .50 to .60 | Poor |
| Below .50 | Unacceptable |
Here’s my honest opinion on that threshold: plenty of methods blogs treat .70 as a rigid law, but it isn’t one. It traces back to Jum Nunnally’s 1978 work on psychometric theory, not a universal cutoff. Examiners do give some leeway for newly developed or very short scales. But if you are using an existing, validated scale and your alpha is still under .70, something in your data collection or your SPSS setup has gone wrong, and that is fixable.
Why Is My Cronbach’s Alpha Low in SPSS? The 4 Real Reasons
Reverse-Coded Items That Were Never Recoded
This is the single most common cause I see, and most SEO guides on this topic barely mention it. If your Likert scale has negatively worded items (“I feel anxious when analysing data”) mixed with positively worded ones (“I feel confident analysing data”), SPSS has no idea they measure opposite directions unless you tell it. Left unrecoded, a reverse-worded item will show a negative or near-zero corrected item-total correlation in your output. That single item can drag a scale that should score .80 down into the .50s.
One Weak or Misfit Item Dragging Down the Scale
Sometimes one item genuinely does not belong, even after correct coding. It might be poorly worded, it might be measuring a slightly different idea, or it might just confuse respondents. You will see this as a low (not negative) corrected item-total correlation, typically under .30.
Most blogs tell you to start here, deleting whichever item shows the lowest correlation first. I disagree with that as a starting point, because if a reverse-coding error is sitting in your data, it will often look exactly like a weak item, and you end up deleting a perfectly good question instead of fixing the actual bug.
Too Few Items in the Scale
Cronbach’s alpha is mathematically a function of two things, the average inter-item correlation, and the number of items, as confirmed in IBM’s own SPSS Reliability command documentation. A 3-item scale needs much higher average correlations to hit .70 than an 8-item scale does. If your scale only has two or three items, a moderate alpha might actually be the ceiling, not a failure on your part.
A Genuinely Unreliable or Multidimensional Construct
If you have checked reverse coding, removed a clearly weak item, and the scale still will not budge above .60, the construct itself may be the issue. This usually means the items are tapping more than one underlying factor rather than one. The same logic shows up in regression work too: just as a high variance inflation factor tells you two predictors are tangled together, a stubbornly low alpha after your fixes tells you your items are tangled across more than one construct. At this point, item deletion is not the fix, going back to an exploratory factor analysis is.
Stuck with low Cronbach alpha?
Get practical assistance reviewing reverse-coded items, item-total correlations and scale reliability.
Review My Reliability Output on WhatsAppReverse Coding in SPSS: How to Fix the Error, Step by Step
This is always my first stop before I touch item deletion, because fixing a miscoded item can take alpha from .52 to .75 in thirty seconds. Here is exactly how I do it:
- Open your dataset and identify every negatively worded item in your scale (check your original questionnaire, not just the variable names).
- Go to Transform > Recode into Different Variables.
- Move the reverse-worded item into the box, give the new variable a clear name like
item4_R. - Click Old and New Values, and map the scale in reverse (for a 5-point Likert scale: 1 becomes 5, 2 becomes 4, 3 stays 3, 4 becomes 2, 5 becomes 1).
- Run Analyze > Scale > Reliability Analysis again using the recoded variable in place of the original.
- Check the Item-Total Statistics table again. A reverse-coded item that is now correctly oriented should show a positive corrected item-total correlation similar to the rest of your items.
If you skip this step and go straight to deleting items, you can end up removing a perfectly valid item just because it was never recoded.
How Do You Read the Item-Total Statistics Table in SPSS?
When you run Analyze > Scale > Reliability Analysis in SPSS and tick “Scale if item deleted” under Statistics, you get a table with two columns that matter most.
Corrected Item-Total Correlation tells you how well that single item correlates with the sum of all the other items, which is really just a specific application of choosing the right correlation measure for your data. Anything below .30 is weak. Negative values almost always mean a reverse-coding problem, not a bad item.
Cronbach’s Alpha if Item Deleted tells you what alpha would become if you removed that specific item. If this number is noticeably higher than your current overall alpha, that item is actively hurting your scale and is a genuine candidate for removal.
I never remove more than one item at a time. Delete one, rerun the analysis, and check the table again, because removing an item changes the correlations for every remaining item.
What to Do When You Have Too Few Items
If your scale only has two or three items, do not keep deleting your way down to one item chasing a higher alpha, since a single-item “scale” has no reliability statistic worth reporting at all. Instead:
- Check if the original validated instrument your scale is based on had more items you left out during adaptation.
- Consider whether a related construct’s items can be reasonably merged in, with proper citation and justification.
- If you are still at pilot stage, this is the moment to add one or two well-worded items before your main data collection, not after.
What to Do When the Construct Itself Is the Problem
If reverse coding is fixed, the weakest item is already gone, and alpha is still stuck below .60, stop trying to patch it with more deletions. Run an exploratory factor analysis on the item set and check whether your items are loading onto one factor or splitting into two. I have seen this happen often with scales adapted from a different cultural or professional context. The items simply do not hang together the way they did in the original validation study, and that finding is worth reporting honestly rather than engineering away.
Case Study: Scale Reliability for a Dissertation, Rebuilt From .52 to .81
A student I worked with last year had adapted a 6-item Research Self-Efficacy Scale for a pilot sample of 142 respondents. Her first reliability run returned alpha = .52, and she had three days before her proposal defence.
Her original Item-Total Statistics table looked like this:
| Item | Corrected Item-Total Correlation | Alpha if Item Deleted |
|---|---|---|
| Item 1 | .48 | .44 |
| Item 2 | .52 | .41 |
| Item 3 | .61 | .38 |
| Item 4 | -.12 | .58 |
| Item 5 | .55 | .40 |
| Item 6 | .49 | .43 |
Item 4 was the warning sign straight away. A negative corrected item-total correlation on a reverse-worded item (“I often doubt my ability to interpret statistical output”) meant it was never recoded after data entry. We recoded it in SPSS using the steps above and reran the analysis. Alpha jumped from .52 to .71 on that fix alone.
The second table still showed one weak point:
| Item | Corrected Item-Total Correlation | Alpha if Item Deleted |
|---|---|---|
| Item 6 | .19 | .79 |
Item 6 (“I prefer working in a team for data analysis”) was measuring a preference, not a self-efficacy belief, and it was the odd one out conceptually too. We removed it, reran the analysis one final time, and the 5-item scale landed at alpha = .81. No new data, no extra respondents, two targeted fixes.
How to Justify Item Deletion to Your Supervisor or Examiner
Students worry, reasonably, that dropping items looks like they are gaming the numbers. Here is how I frame it in a methodology chapter, and I have not had a student challenged on this in a viva when it’s framed this way:
- State the original alpha and the final alpha, do not hide the first number.
- Name the specific item removed and the conceptual reason it did not fit, not just “it had low correlation.”
- Report the corrected item-total correlation and the alpha-if-deleted value as evidence, not opinion.
- Cite that item refinement based on item-total statistics, a procedure built into Cronbach’s own 1951 formulation of the coefficient, is a standard, published step in instrument development, not something you invented to fix a bad result.
Transparency about what you removed and why reads as rigour, not manipulation.
Cronbach’s Alpha vs McDonald’s Omega, Should You Report Both?
Cronbach’s alpha assumes every item contributes equally to the construct, which is rarely true in real data. McDonald’s omega drops that assumption and is generally a more accurate reliability estimate for scales with uneven factor loadings. Omega is one way to estimate what researchers call composite reliability, a broader term for how consistently a set of items measures one construct. I now recommend students run both where their committee allows it, and report omega alongside alpha, since reviewers still expect the familiar alpha value too.
Reporting Your Fixed Reliability Score in APA Format
In your results or methodology section, report it plainly: “The scale demonstrated acceptable internal consistency (Cronbach’s α = .81, 5 items, n = 142) following the removal of one item that reduced overall reliability.” That single sentence, backed by the item-total table in your appendix, is usually enough to satisfy a reviewer.
Frequently Asked Questions
Is 0.6 Cronbach’s alpha acceptable for a dissertation?
A 0.6 alpha sits in the “questionable” range on most interpretation scales. Some committees accept it for newly developed or very short scales if you state this limitation openly, but for an established, validated instrument, you should aim to diagnose and fix the cause rather than report .6 as final.
Can Cronbach’s alpha be too high?
Yes. An alpha above .95 often signals redundant items that are all asking the same question in slightly different words rather than excellent reliability. When this happens I usually recommend shortening the scale, since a bloated, repetitive questionnaire tires out respondents without adding any real measurement value.
What causes low reliability in a survey scale?
The most common causes are unrecoded reverse-worded items, one conceptually weak item, too few items in the scale, or a construct that is genuinely multidimensional rather than single-factor.
Does sample size affect Cronbach’s alpha?
Yes, small samples make alpha estimates unstable and can produce misleadingly low or high values. A pilot sample under 50 can show alpha swings of .10 or more just from sampling variation, which is worth checking against a proper sample size calculator before you panic over one unstable reading.
What is the difference between reliability and validity?
Reliability, which Cronbach’s alpha measures, tells you whether your items are internally consistent. Validity tells you whether the scale actually measures the construct it claims to measure. A scale can be reliable without being valid.
Is there a minimum number of items needed for a reliable scale?
There is no hard rule, but scales with fewer than four items need notably higher inter-item correlations to reach conventional alpha thresholds, since alpha depends on item count as well as correlation strength.
Final Word
If your Cronbach’s alpha came back low, you most likely have a fixable problem, not a failed study. Check reverse coding first, read the item-total statistics table properly, and only delete an item when the data and the concept both tell you it does not belong. If you have checked all four causes and you are still stuck, or you want a second set of eyes on your SPSS output before your defence, you can work out if you need outside help before the deadline closes in on you.
For related SPSS and research design guidance, see my notes on testing your data for normality with the Shapiro-Wilk test and reading the Durbin-Watson statistic for autocorrelation.
Written by Siddharth Gupta, independent statistics and dissertation research consultant with 12 years of experience guiding thesis and dissertation students through SPSS analysis. Connect on LinkedIn.