
SPSS Dissertation Data Analysis Help: From Research Questions to Final Results
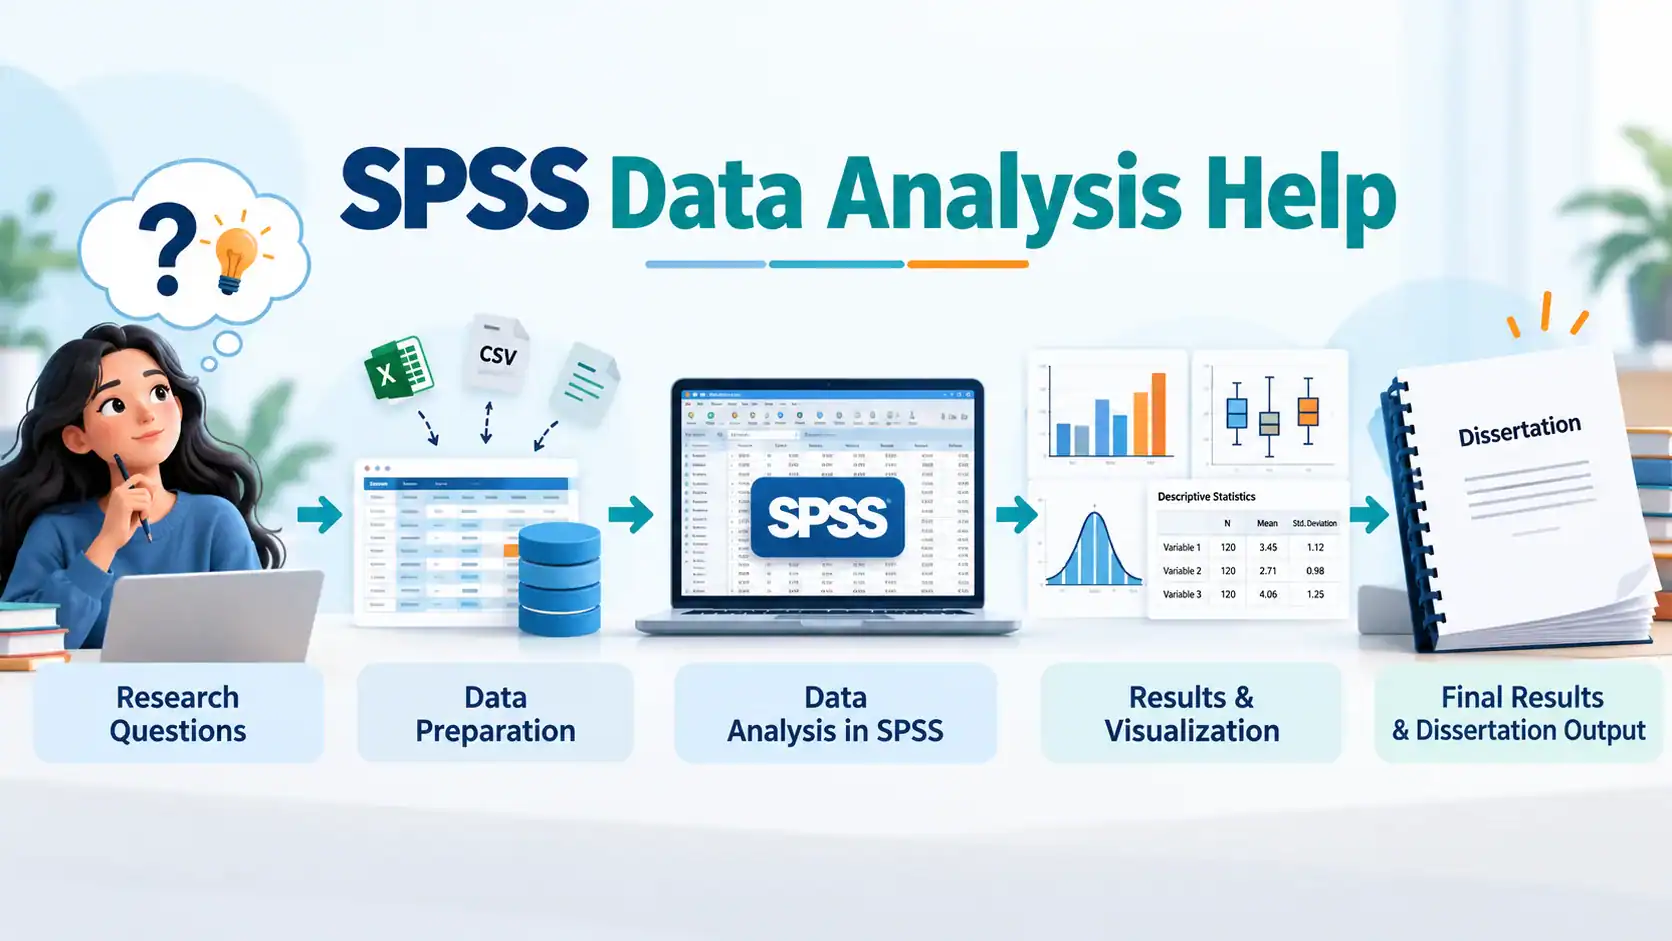
If you are searching for SPSS dissertation data analysis help right now, you are probably staring at a half-finished Chapter 4. A deadline is closing in, and an SPSS output window sits open, full of numbers that do not mean much to you yet. I have sat across from this exact situation for twelve years, first as a researcher myself, then as someone who helps other researchers get unstuck. This article walks you through the whole journey, from your research questions to your final results, the honest way.
What SPSS Dissertation Data Analysis Help Actually Means
SPSS dissertation data analysis help is guided support in selecting, running and interpreting statistical tests in SPSS for a dissertation or thesis, so the student understands and can defend every result. That is the plain definition. SPSS itself stands for Statistical Package for the Social Sciences, a software product built by IBM and used across nearly every quantitative dissertation today.
Good SPSS dissertation statistics help centres on exactly this kind of understanding, not just a finished output file.
Coaching versus doing it for you
While researching this topic, I went through a dozen freelance SPSS gigs on Fiverr and similar platforms. Most of them read like a shopping list. Descriptives, correlation, regression, ANOVA, delivered in 48 hours, confidentiality guaranteed. Not one of them mentioned checking test assumptions, and not one explained how the student would understand their own results afterward.
A rushed, anonymous, done-for-you output might get you past a deadline. It leaves you unable to answer a single follow-up question from your supervisor or panel. That counts as a shortcut with a delay timer built into it.
Where I draw the line
In my practice, dissertation statistics consultation means I sit with the student, explain why a test fits their research question, run it together or review their run, and make sure they can explain it in their own words. This definition centres on guidance and understanding, not on someone else producing your dissertation for you.
Why So Many Dissertation Students Get Stuck at the SPSS Stage
Most students who come looking for SPSS dissertation help are not weak researchers. They are strong in their subject area, nursing, education, business, psychology, and genuinely weak in statistics, because nobody taught them this properly before they needed it.
Common reasons students get stuck
- No statistics background at all, especially in MBA and professional doctorate programmes
- Supervisor feedback that says “this test does not fit” without saying which one would
- A fixed viva or submission date that is not moving regardless of where the analysis stands
- Data that looks fine in Excel but fails every assumption check the moment it hits SPSS
- Panic after seeing a non-significant p-value, assuming the whole dissertation has failed
A quick YouTube tutorial can show you which buttons to click in SPSS. It cannot tell you whether a paired t-test or a repeated measures ANOVA actually fits your pre-post design, and that choice depends entirely on your research question and how many time points you collected. I have written a separate comparison of paired t-test versus repeated measures ANOVA for pre-post data if this is exactly where you are stuck.
Turning Your Research Questions Into Testable Hypotheses
This is the step most students rush through, and it is the step that decides everything downstream in your dissertation SPSS analysis. This step sits at the centre of any quantitative dissertation analysis help worth paying for, since every test and every result downstream depends on getting it right.
Your research question is not yet a hypothesis. A hypothesis is a specific, testable statement derived from that question, tied to measurable variables. Here is a quick example.
- Research question – Does remote work affect employee engagement?
- Hypothesis – There is a significant difference in mean engagement scores between remote and in-office employees.
- Variables – Engagement score, continuous and dependent, work location, categorical and independent.
Your research design also shapes which hypothesis makes sense in the first place. A question about change over time needs a different design than a question about a single snapshot, and I break this down in cross-sectional versus longitudinal design.
The six-step process from research question to final result
- Define your research question clearly
- Convert it into one or more testable hypotheses
- Identify your variable types, categorical, continuous, ordinal
- Select the statistical test that matches your design and data type
- Clean your data and check test assumptions before running anything
- Run the analysis, interpret the output, and write it up against your original question
A quick word on sample size
Before any test runs well, your sample size needs to support it. A regression with six predictors and thirty respondents will never produce a stable model, no matter how carefully you pick the test. Running your numbers through a sample size calculator before data collection saves you from this problem entirely, rather than discovering it after the fact.
Skip step two and three above, and you will pick the wrong test in step four, every single time.
Stuck with dissertation SPSS analysis?
Get practical assistance reviewing your research questions and statistical test selection.
Plan My SPSS Analysis on WhatsAppChoosing the Right Statistical Test for Your Dissertation
This is where I see the most SPSS analysis for dissertation work go sideways. Students either copy whatever test their senior used, or run every test SPSS offers and keep whichever one gives a significant result. Both practices are weak, and both get flagged by sharp supervisors.
A simple way to think about dissertation statistical analysis SPSS test selection.
| Your question type | Data type | Likely test |
|---|---|---|
| Difference between two groups | Continuous DV | Independent samples t-test |
| Difference between 3+ groups | Continuous DV | One-way ANOVA |
| Relationship between two variables | Continuous, continuous | Pearson correlation |
| Relationship, non-normal data | Ordinal or skewed | Spearman correlation |
| Predicting an outcome | Continuous DV, multiple IVs | Multiple regression |
| Association between categories | Categorical, categorical | Chi-square |
If your data is not normally distributed, or is ordinal like Likert scales, Pearson correlation becomes the wrong choice and Spearman usually becomes the safer one. I have gone deeper into exactly when to pick each in my Pearson versus Spearman correlation guide.
Parametric versus non-parametric, and why assumptions decide this
Every parametric test, t-test, ANOVA, Pearson correlation, assumes certain things about your data, mainly normal distribution and, for some tests, equal variance across groups. Ignore these assumptions and your p-value loses its meaning, no matter how clean your SPSS output looks.
Running the Analysis: Data Prep to SPSS Output
Descriptive statistics summarise your sample data through measures like means, frequencies and standard deviations, while inferential statistics use that sample data to draw conclusions about a wider population. Every dissertation needs both, but inferential statistics are what your hypotheses actually rest on.
Before any test selection means anything, your data has to be in a fit state for analysis.
Steps I walk students through for SPSS research data analysis help
- Coding variables correctly, reverse-coding, categorical labels, missing value codes
- Screening for outliers and data entry errors
- Deciding how to handle missing data, since listwise deletion is not always the right call
- Checking normality, usually with a Shapiro-Wilk test for smaller samples
- Checking multicollinearity before trusting any regression model
Once your data is cleaned and analysed, interpretation becomes the next real test of your understanding. I wrote a dedicated piece on reading a Shapiro-Wilk test for normality because this single check decides whether half your planned tests are even usable.
A short case from practice. A nursing PhD candidate once came to me convinced her entire regression model was broken because SPSS kept flagging a warning. Two of her predictor variables turned out to be almost perfectly correlated with each other, a classic multicollinearity problem that a quick check of the variance inflation factor solved in ten minutes. Once that was fixed, I also had her check the Durbin-Watson statistic for autocorrelation in the residuals, since one regression diagnostic rarely tells the whole story on its own. The analysis itself had been fine all along, she had simply never been taught to check for this.
Interpreting SPSS Output Without Panicking Over a Non-Significant Result
A non-significant p-value still answers your research question, and it deserves honest reporting rather than panic. PhD SPSS data analysis help, done properly, includes teaching students to report what the data actually showed.
What matters in your output
- The significance value, p, measured against your chosen alpha, usually 0.05
- Effect size, which tells you how meaningful the difference actually is, beyond significant or not
- Confidence intervals, which show the range your true population value likely falls in
Effect size measures the strength of a relationship or difference, independent of sample size, and it often tells a more useful story than the p-value alone. A small sample can produce a non-significant result even when a real, meaningful effect exists in the population.
Writing Up Chapter 4: From SPSS Tables to a Results Narrative
Chapter 4 of a dissertation presents the statistical results of your study, organised around each research question or hypothesis, without yet moving into discussion or interpretation of broader meaning. This is where SPSS thesis data analysis turns from raw numbers into an actual chapter.
The APA Publication Manual, seventh edition, sets the standard format for reporting statistical results in tables and in-text citations. My own criticism of how students apply this manual is specific. Most focus only on table formatting and skip the manual’s clear instruction to report exact p-values rather than simply writing “significant” or “not significant.”
A clean Chapter 4 organises every result around its matching hypothesis, presents the test used along with the key statistic and exact p-value in APA format, and explains what the result means in plain language rather than only in statistical jargon. Getting this organisation right from the start saves you weeks of rework later, and I lay out a full approach in my dissertation organising guide.
A poorly formatted results chapter does real damage beyond the SPSS stage itself. I covered this in more depth in my piece on poorly formatted dissertations, and examiners notice this immediately, as do recruiters who later ask for writing samples.
AI Tools and Your SPSS Dissertation Analysis
A newer worry has entered this space over the last couple of years. Students run their SPSS output through ChatGPT or similar tools to help write the interpretation paragraphs, then get flagged by their supervisor for sounding artificial.
AI detection tools look for patterns that human reviewers may not immediately recognise, and these patterns show up easily in results chapters because statistical write-ups already follow a repetitive structure. If this has already happened to you, I have written specific guidance on what to do when your supervisor says your dissertation sounds like AI and on handling a direct accusation of AI use in your dissertation.
My advice before you submit anything is simple. Verify your AI-generated analysis yourself against the actual SPSS output, line by line, before it goes anywhere near your supervisor.
Getting SPSS Dissertation Help Without Getting Burned
Since this space is full of anonymous gig listings, here is how I tell students to vet SPSS dissertation help before paying anyone.
Red flags I would personally walk away from
- No mention of checking test assumptions anywhere in their process
- A quote given before they have even seen your research questions
- Promises to guarantee significant results
- No willingness to explain the analysis back to you afterward
What to prepare before reaching out for dissertation statistics consultation
- Your research questions and hypotheses, even in draft form
- Your raw dataset or questionnaire structure
- Your university’s required format or style guide
- Your actual deadline, not a padded one
Your raw data stays confidential throughout this process and is never shared beyond the consultation itself. This entire process runs online, through video calls and shared screens, so your location in the USA, UK, or anywhere else does not change how the support works. If you are still unsure whether you even need outside help at this stage, I wrote a straightforward checklist in how to know if you need a dissertation expert.
Need expert help with dissertation SPSS analysis?
Get guidance on test assumptions, SPSS output and Chapter 4 reporting.
Review My Dissertation Analysis on WhatsAppDefending Your Results at Your Viva
Whatever help you take along the way, you alone sit in the viva. Every test, every assumption check, every number needs to be something you can explain without reading from a script. Treat every meeting with your statistics helper as practice for your actual defence, not a replacement for it.
About This Guidance
I hold an MBA in Finance and an M.Tech, and I have spent over twenty years in analytics consulting across R, Python, SPSS, and Stata, with the last twelve focused specifically on dissertation and thesis support. Statssy grew directly out of that work, built around the same coaching-first approach described throughout this article.
FAQ
Is getting SPSS dissertation help considered cheating?
Coaching on test selection, assumption checks, and interpretation counts as standard academic support at most universities. Paying someone to produce analysis you cannot explain yourself crosses into academic misconduct territory.
How much does SPSS dissertation data analysis help cost?
Costs vary widely by scope, from a single consultation session to full chapter support. Treat a quote given before anyone has looked at your actual research questions or data with real suspicion.
Can I do my own SPSS analysis without hiring a statistician?
Yes, if you are willing to learn test selection logic and assumption checking properly. Many students manage this with structured guidance rather than someone else running the whole analysis.
How long does SPSS dissertation analysis take?
A straightforward analysis with clean data can take a few days. Messy data, assumption violations, or unclear hypotheses can stretch this to a few weeks.
What if I don’t have SPSS, can I use Excel or R instead?
Excel handles basic descriptive statistics but struggles with most inferential tests dissertations require. R can do everything SPSS does and more, though it carries a steeper learning curve for non-technical students.
What happens if my SPSS results are not statistically significant?
A non-significant result counts as a legitimate finding, one that should be reported honestly rather than hidden or manipulated to appear significant.
Can SPSS help also prepare me to defend my results at the viva?
Good SPSS dissertation help always includes this. A service unwilling to explain the analysis back to you in plain language gives you a clear sign to look elsewhere.