
Theoretical Framework to Hypothesis Dissertation, A Guide to Building Your Statistical Model
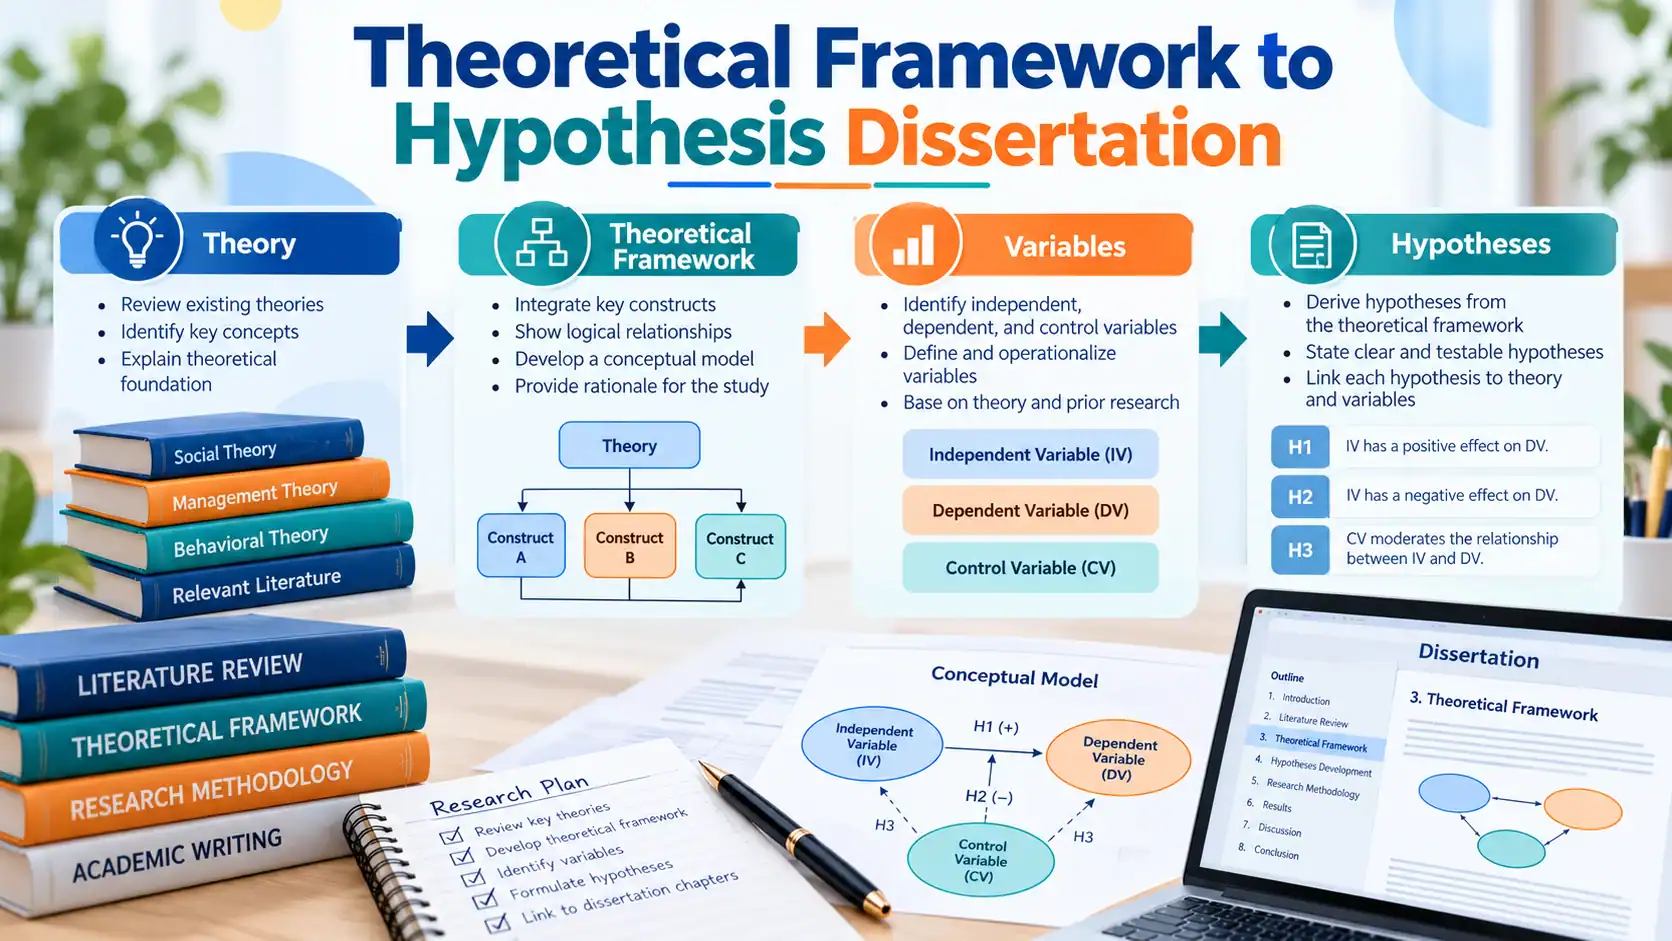
If you are stuck trying to move from theoretical framework to hypothesis dissertation writing, you are in the right place. Most of my clients land exactly here, after twelve years of helping people through this stage.
I have reviewed hundreds of dissertation proposals by now, and the pattern repeats itself across business, education, nursing, and psychology. A framework gets built, admired, and then quietly abandoned the moment it is time to write a hypothesis. This guide fixes that gap, with a real worked example at the end so you can see the full path from framework to a finished SPSS regression model.
This matters because the chain actually runs in one direction. Your literature review surfaces where existing studies disagree or fall short. That gap becomes your research problem, your research problem points you toward a theory that explains it, and that theory becomes your framework. Skipping any one of those links is what leaves students with a framework that looks finished but cannot produce a testable hypothesis.
Why Theoretical Framework to Hypothesis Dissertation Writing Breaks Down
Turning a theoretical framework into a hypothesis means converting each arrow in your framework diagram into one directional, testable statement about two measurable variables. You then confirm that statement can actually be analysed with the statistical test your design allows. A framework works like a map. It becomes useful to your statistics chapter only once you convert it into a testable claim.
The Gap Between Having a Framework and Having Something SPSS Can Test
Most guides online stop at explaining what a framework is. They never show you the next step, which is turning each relationship in that diagram into a sentence your statistics software can actually evaluate.
Here is what that step looks like in practice. If your framework shows an arrow from perceived usefulness to intention to use, your job is to turn that arrow into a sentence like perceived usefulness is positively related to intention to use, and then into two measurable variables SPSS can run a test on.
What Committees Actually Reject This For
In my experience, committees rarely reject a framework for being wrong. They reject the hypothesis section because it does not match the framework, or because the hypothesis cannot actually be tested with the data the student is collecting.
I have seen students propose a mediation hypothesis in Chapter 1 and then run a simple correlation in Chapter 4, because nobody told them these are not interchangeable. That mismatch alone has sent people back for a full rewrite.
Theoretical Framework vs Conceptual Framework (Stop Confusing These)
These two terms get used interchangeably in casual conversation, and that habit causes real damage once you are deep into conceptual framework quantitative research design.
Theoretical framework is the existing theory or combination of theories you are borrowing from the literature to explain your research problem. It comes from someone else’s published work, and you are applying it to your own study.
Conceptual framework is the specific model you build for your own study, showing the exact variables and relationships you intend to test. It is built by you, using the theoretical framework as its foundation.
| Aspect | Theoretical Framework | Conceptual Framework |
|---|---|---|
| Origin | Borrowed from existing theory | Built by the researcher |
| Purpose | Explains why the phenomenon occurs | Maps the specific variables of this study |
| Source | Published literature | Your own research design |
| Example | Technology Acceptance Model (Davis, 1989) | Your version of TAM applied to mobile banking adoption in Tier 2 Indian cities |
I will be honest about something most guides will not say directly. A lot of published frameworks get cited without being properly understood. Students borrow the Technology Acceptance Model because it is popular, and they skip reading Davis’s original 1989 study, where perceived usefulness and perceived ease of use were defined and tested for the first time. Read the source before you borrow it, because your committee will ask you to defend your choice.
From Constructs to Variables, Operationalising Your Framework
Operationalisation means turning an abstract concept from your framework into something you can actually measure with numbers. If your framework talks about job satisfaction, operationalisation is the process of deciding exactly how you will measure that satisfaction, usually through a validated survey scale with a defined scoring method.
This is the step most dissertation guides skip, and it is exactly where operationalizing variables for SPSS becomes a real, practical task rather than a theory exercise.
Reading Independent and Dependent Variables Off Your Framework Diagram
Every arrow in your framework diagram has a direction, and that direction tells you which variable is independent and which is dependent. The variable at the tail of the arrow is your independent variable (IV), the one you believe causes or predicts a change. The variable at the arrowhead is your dependent variable (DV), the outcome you are measuring.
Once you label every arrow this way, your hypotheses almost write themselves. Each arrow becomes one hypothesis, with the tail construct as the IV and the head construct as the DV.
Need help with theoretical framework and hypotheses?
Get practical support with turning constructs into measurable variables and testable hypotheses.
Review My Research Framework on WhatsAppFive Steps to Operationalize Any Construct From Your Framework
- Pull every construct out of your framework diagram and list them separately.
- Find an existing validated scale for each construct wherever possible, rather than inventing your own items.
- Decide the measurement level for each variable, nominal, ordinal, interval, or ratio, because this decision controls which statistical test you can run later.
- Assign each variable a name and type inside SPSS Variable View, matching the scale you chose.
- Write a one line operational definition for each variable, stating exactly how it was measured and scored.
Here is a quick example. Customer loyalty as a construct becomes composite score on a 10 item, 5 point Likert scale drawn from a validated customer loyalty instrument in the services marketing literature, measured as a continuous variable from 10 to 50. That single sentence is your operational definition, and it belongs in Chapter 3 word for word.
Once your scale is finalised, run a reliability check using Cronbach’s alpha before you collect your main data. A value above 0.70 is generally considered acceptable for a dissertation level instrument, and reporting this number in your methodology chapter is a basic expectation most committees look for.
Writing Hypotheses That Are Actually Testable
A hypothesis is a directional, testable statement about the relationship between two or more of your operationalized variables, written as a specific claim rather than a question or a vague expectation.
Null and Alternative Hypothesis Format
Every testable hypothesis needs two versions. The null hypothesis, H0, states there is no relationship or no difference. The alternative hypothesis, H1, states the relationship you actually expect, based on your theoretical framework.
For example, the null hypothesis states there is no significant relationship between perceived usefulness and intention to use, written as H0. The alternative hypothesis states perceived usefulness has a significant positive relationship with intention to use, written as H1.
Mistakes I See Most Often
Students write hypotheses that are not directional when their framework clearly predicts a direction. They also write hypotheses using variables that were never properly operationalized, which means there is nothing concrete for SPSS to test.
My honest opinion here, most hypothesis writing problems are not statistics problems. They are framework problems that never got caught early enough.
Matching Your Hypothesis to the Right SPSS Test
Your hypothesis structure tells you which test to run. Get this wrong and your entire results chapter falls apart, even if your data collection was perfect.
A mediating variable explains the mechanism sitting on the causal path between your IV and DV. A moderating variable changes the strength or direction of that relationship without sitting on the path itself, for example, a user’s age might moderate the usefulness to intention link without being caused by usefulness.
You do not need a statistics background to do this. SPSS Variable View works like a spreadsheet, and running most of these tests is a matter of selecting the right menu option once your variables are set up correctly.
| Hypothesis Structure | Number of Variables | SPSS Test |
|---|---|---|
| Relationship between two continuous variables | 2 | Correlation, Pearson vs Spearman depending on normality |
| One or more IVs predicting one continuous DV | 2 or more | Linear or multiple regression |
| Difference between two or more groups | 2 or more groups | ANOVA or t-test |
| One variable’s effect on DV through a third variable | 3 | Mediation analysis |
| Relationship strengthened or weakened by a third variable | 3 | Moderation analysis |
Before you trust any regression output, run your data through basic diagnostic checks. A Shapiro-Wilk normality check tells you whether your residuals are distributed the way regression assumes. A Durbin-Watson test checks for autocorrelation in your residuals, and a VIF check tells you whether your independent variables are too correlated with each other to trust the individual coefficients.
I have reviewed results chapters where none of these three checks were run. The regression numbers looked fine on the surface, but the model itself was not valid. Do not skip this part to save time, because your examiner will ask about it.
Once your model involves more than one layer of mediation or moderation stacked together, standard regression stops being enough, and Structural Equation Modelling (SEM) becomes the more appropriate choice.
Case Study, One Framework From Start to Finish
A client of mine, name changed for privacy, was studying mobile banking adoption among retail customers in a Tier 2 Indian city, for an MBA dissertation. He chose the Technology Acceptance Model as his theoretical framework.
Step 1, The Framework
His conceptual framework had three constructs, Perceived Usefulness (PU), Perceived Ease of Use (PEOU), and Intention to Use (ITU) the mobile banking app. The arrows in his diagram showed PU and PEOU both pointing toward ITU, with PEOU also pointing toward PU.
Step 2, Operationalizing the Variables
He adapted Davis’s original 1989 scale items for each construct, using a 6 item, 5 point Likert scale for PU, a 6 item scale for PEOU, and a 3 item scale for ITU. Each construct became a composite mean score, entered into SPSS as a continuous scale variable. Before distributing the survey, he used Statssy’s sample size calculator to confirm a minimum of 150 responses for adequate power in a three construct regression model.
Step 3, Writing the Hypotheses
H1 proposes PU is positively related to ITU. H2 proposes PEOU is positively related to ITU. H3 proposes PEOU is positively related to PU.
Need help with theoretical framework and hypotheses?
Get practical support with checking alignment between hypotheses, variables and your statistical model.
Check My Hypothesis Plan on WhatsAppStep 4, Running and Reading the Model
He ran a multiple regression with ITU as the dependent variable and PU and PEOU as independent variables, after confirming normality and checking VIF values were below 3.
The model showed PU had a significant positive effect on ITU. PEOU had a smaller but still significant effect, and the combined model explained a reasonable share of the variance in intention to use.
That is the entire path. Framework, operational definition, hypothesis, SPSS test, and a defensible result, all tracing back to the original diagram he built in Chapter 2.
Once hypotheses are confirmed or rejected, the next hurdle is reporting results the way your committee expects. Interpreting the regression output correctly and writing it up in APA format, including beta coefficients, R squared, and significance values, is what turns a working model into a defensible results chapter, and it is usually where students get the most questions during their viva.
Common Mistakes That Get Hypotheses Rejected
- Framework-hypothesis mismatch. The hypothesis tests a relationship your framework never actually proposed.
- Vague or untestable wording. Phrases like may influence or could be related to are not directional and do not commit to a testable claim.
- Wrong test for the hypothesis type. Running a correlation when your hypothesis actually describes mediation.
- Skipping assumption checks. Submitting regression results without confirming normality, multicollinearity, or autocorrelation.
- Borrowing a framework without reading the source. Citing a theory because it is popular, not because it fits the research problem.
If this list feels overwhelming while you are also trying to finish data collection, that is normal, and it is exactly the stage where a second pair of expert eyes saves the most time.
Frequently Asked Questions
How many hypotheses should a dissertation have?
There is no fixed number. Most quantitative dissertations have between two and six hypotheses, matching the number of relationships shown in the conceptual framework. More than that usually signals the framework is trying to do too much.
What is the difference between a research question and a hypothesis?
A research question is open ended and exploratory. A hypothesis is a specific, directional, testable prediction about the relationship between variables, written before data collection begins.
How do you write a null and alternative hypothesis?
The null hypothesis, H0, states no relationship or no difference exists. The alternative hypothesis, H1, states the specific relationship your framework predicts, usually written in a positive or negative direction.
Can a dissertation use more than one theoretical framework?
Yes, combine frameworks when they explain different parts of the same phenomenon. Integrate them into one coherent model and state clearly how they connect.
What if my hypothesis isn’t supported by the data?
An unsupported hypothesis is still a valid result. Report it honestly, discuss possible reasons in your discussion chapter, and resist the urge to change your hypothesis after seeing the results.
Can I change my hypothesis after collecting data?
No. Disclose it if you do. Changing a hypothesis after seeing results is a validity and ethics issue known as HARKing, hypothesizing after results are known, and most committees flag it when they notice the mismatch between your proposal and your final document.
Written by Siddharth Gupta, dissertation and statistics consultant with 12 years of research guidance experience across business, education, nursing, and psychology dissertations. Connect on LinkedIn.