
What is Tabular Data? (Definition & Example)
What is tabular data? It is the question most students ask me in our first session, after their professor has scribbled “present this in tabular form” on a draft. In twelve years of guiding dissertation and coursework students, I have noticed the confusion is never about the maths. It is about this one basic term nobody bothered to explain properly.
So let us fix that today, in plain language, with an example you can actually picture.
What Is Tabular Data? (Quick Definition)
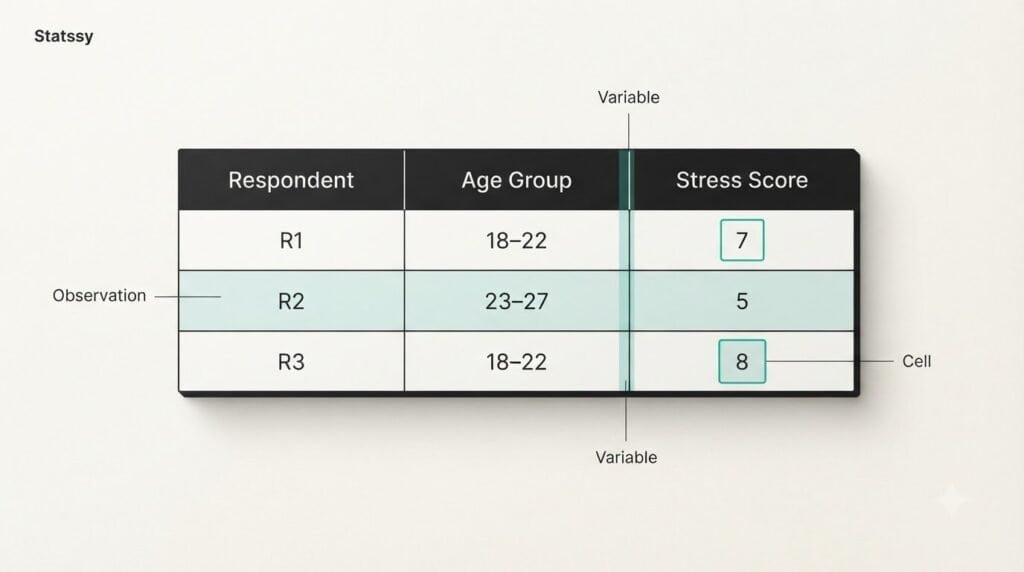
Tabular data is information organised into rows and columns, where each row represents one observation and each column represents one variable.
That is the whole idea. Some students ask what does data table mean, and it is the same thing, just a different name for the same layout. Others write it as tabular form data or a table of data. All of these point to one thing: your information sitting neatly in a grid instead of scattered across a paragraph.
You will also find this searched a few different ways, like what is table of data or what is table in data. Some students type what is data table used for, what is a table data, or what is the tabular data. School textbooks sometimes phrase it as what is mean by tabular data instead. Whichever way you typed it, the answer is the same rows-and-columns idea explained above.
Rows = Observations, Columns = Variables
Think of a row as one person, one event, or one response in your dataset. Think of a column as one piece of information you collected about that person, event, or response. Where a row and a column meet is called a cell, and that single cell is the smallest unit of tabular data. When rows and columns line up cleanly like this, you have tabular data.
Example of Tabular Data
Let us look at a few tabular data examples you will recognise from your own coursework, starting with a survey-based project.
A Simple Survey Dataset
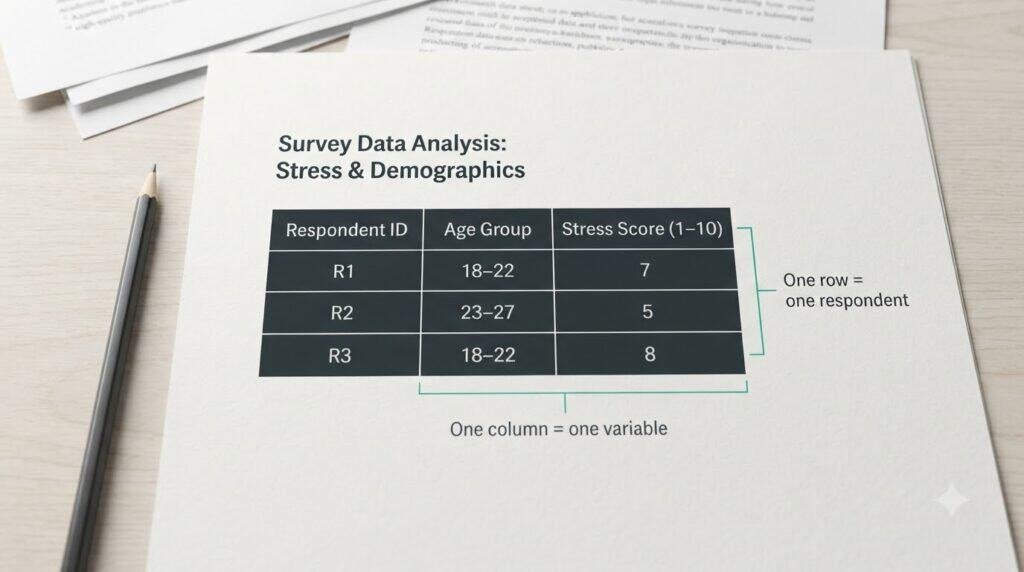
Say you ran a short survey for your dissertation on student stress levels. Here’s what that looks like once it’s laid out properly.
| Respondent ID | Age Group | Stress Score (1-10) |
|---|---|---|
| R1 | 18-22 | 7 |
| R2 | 23-27 | 5 |
| R3 | 18-22 | 8 |
Each row is one student. Each column is one variable you measured. This is tabular data in its most honest form, no jargon needed.
How the Same Data Looks in Excel or SPSS
Open the same dataset in Excel and you will see the identical grid, just with more rows once your sample size grows. In SPSS, this becomes your Data View, with variables defined separately in Variable View. I walk students through exactly this setup in my SPSS data analysis tutoring sessions. Half the panic before submission comes from not knowing which view to trust.
Tabular Data vs Non-Tabular Data
What Is Non-Tabular Data?
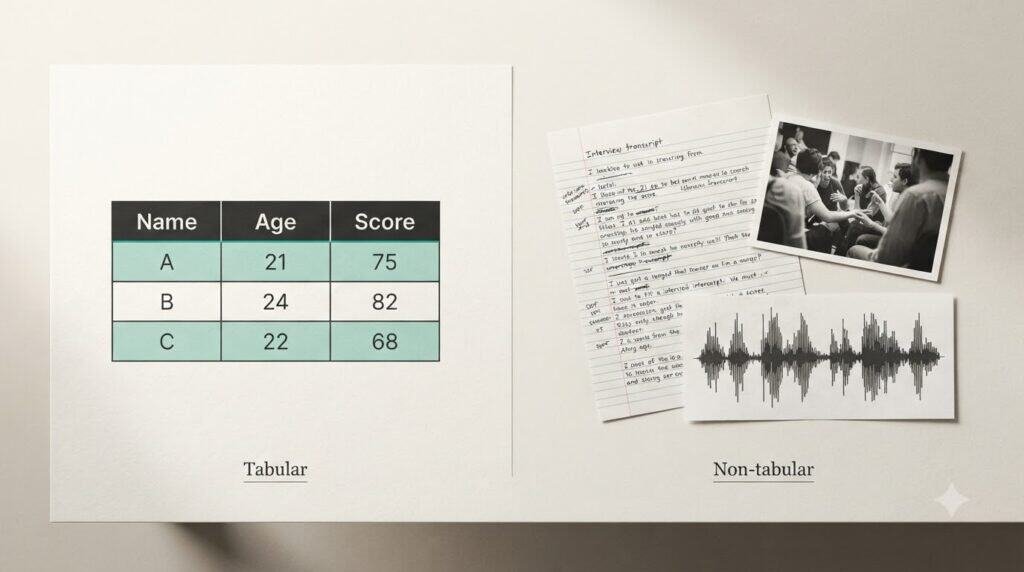
Non-tabular data is anything that does not fit neatly into rows and columns without extra work. Interview transcripts, open-ended survey answers, images, and audio recordings are common examples in academic research. You can eventually convert some of this into tabular form through coding, but in its raw state it resists the grid.
Quick Comparison
- Tabular data: structured, rows and columns, easy to sort and filter
- Non-tabular data: unstructured or semi-structured, needs processing before analysis
- Table data view: in tools like SQL databases or Power BI, this is literally what the structured grid layout is called, as opposed to a chart or graph view
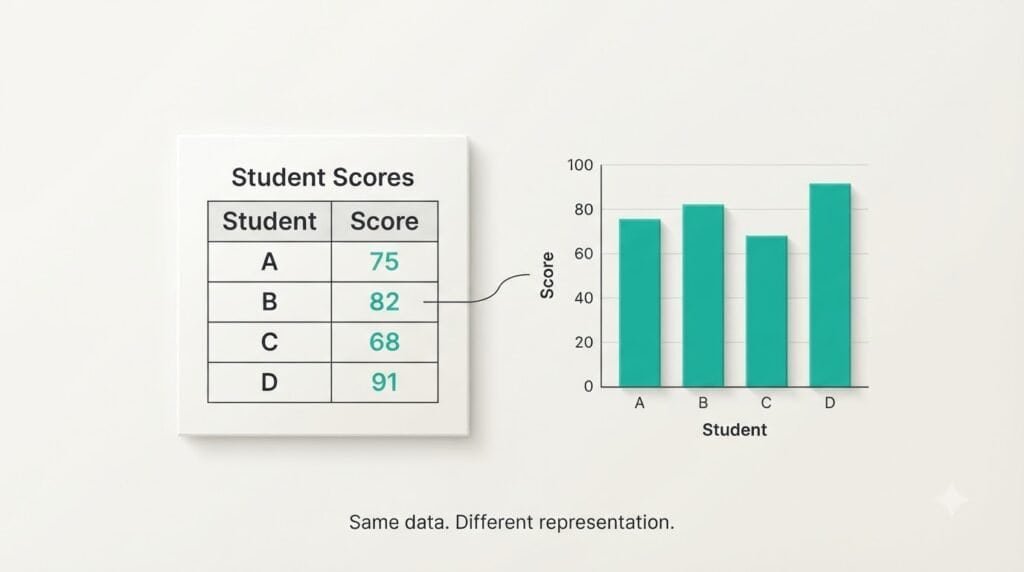
Once your table is clean, you will often need to turn it into a chart for your results chapter or a presentation. The underlying data does not change, only the display does, since a chart is just a visual read of the same rows and columns. If you build these often, Power BI tutoring makes that conversion faster than redoing it by hand in Excel each time.
Types of Tabulation
Once your raw data is collected, it gets organised through a process called tabulation. There are a few standard types you will run into.
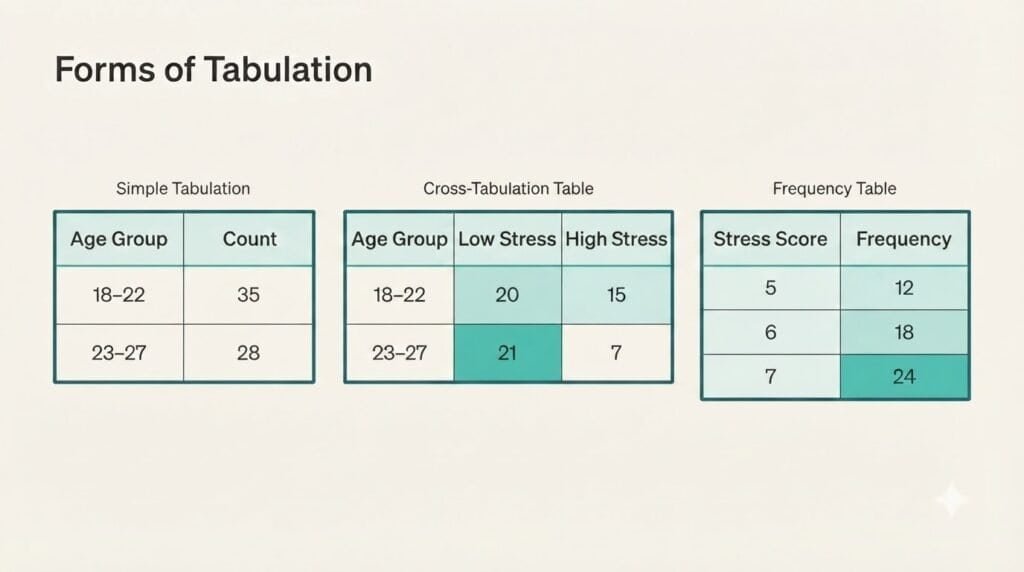
Simple Tabulation
This covers one variable at a time. For example, a count of how many respondents fall into each age group.
Cross Tabulation
Also called complex tabulation, this shows two or more variables together. Researchers often call this a contingency table, especially in a results chapter or a published paper. For instance, age group against stress score, so you can see patterns across both at once.
Frequency Tables
A data frequency table is a specific type of simple tabulation that shows how many times each value appears in your dataset. If you are asking what is data frequency table, this is your answer. It is one of the first tables most students build in their results chapter.
Why Tabular Data Matters for Research and Dissertations
Examiners and journal reviewers expect data in tabular form because it is faster to verify and compare than a wall of text. The APA Publication Manual, which most dissertation committees follow, treats a properly labelled table as a formal exhibit rather than a visual add-on. That is why every table needs a number, a title, and consistent formatting throughout your document.
A well-built table also protects you from vague claims, since every number is traceable to a specific row and column. I cover formatting rules like this in more depth in my dissertation organising guide.
Here is a straightforward process I give every student who is starting from a messy spreadsheet.
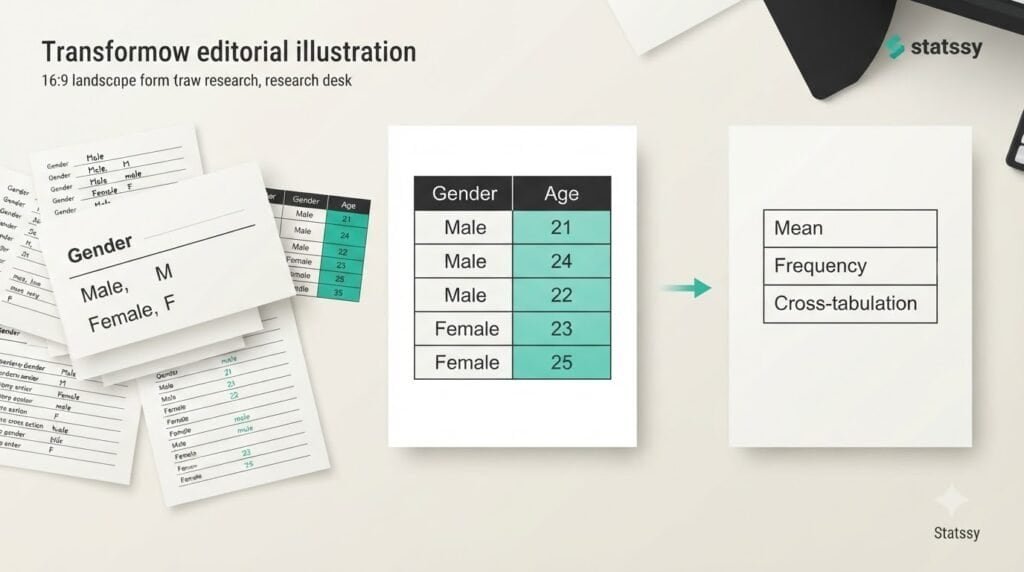
- Collect your raw responses in whatever format they arrive
- Assign one column per variable you actually plan to analyse
- Assign one row per respondent or observation, no exceptions
- Clean and code categorical answers so they are consistent (for example, “Yes/yes/YES” should become one value)
- Format the final table for your chosen software before running any statistics
Common Tools That Create Tabular Data
Most academic work runs through a small set of tools, and each one handles tabular data slightly differently.
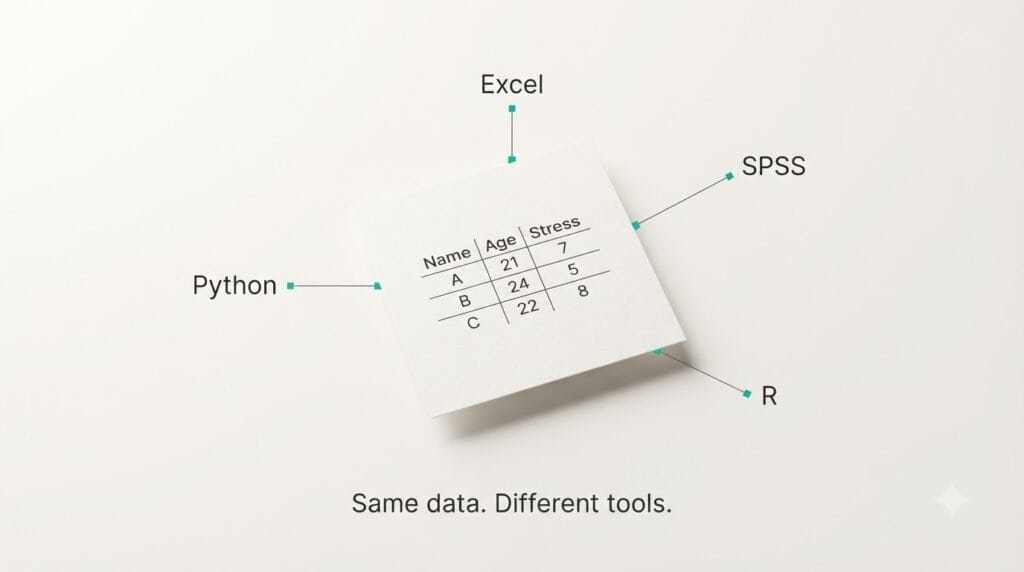
- Excel is where most students start, and it is fine for smaller datasets. My Excel statistics tutoring sessions focus on getting this stage right before you move to statistical software.
- SPSS separates your data grid from your variable definitions, which trips up a lot of first-time users.
- Stata treats tabular data as the default input format for almost every command you will run, and my Stata tutor sessions usually start by cleaning exactly this kind of table.
- R works the same way, reading your dataset in as a structured table before any analysis begins, which is where my R programming tutor sessions pick up.
- Python (pandas) stores tabular data as a DataFrame, where the index behaves like your row labels and each column is a named variable. My Python data analysis tutoring sessions cover this exact shift from spreadsheet thinking to DataFrame thinking, which trips up most beginners in their first week.
- Google Sheets works well for live, shared data collection before you export to your main tool.
Common Mistakes Students Make With Tabular Data
I see the same errors on repeat, regardless of whether the student is doing a bachelor’s project or a PhD chapter.
- Merging two variables into one column, such as combining age and gender into a single cell
- Using inconsistent categories across rows, so “Male” and “M” are treated as different values
- Losing the one-row-per-observation rule, especially when data is copied from multiple survey exports
- Assuming “a table data” and “the tabular data” are two different concepts, when they are just the same layout described with slightly different grammar
A Pattern I See Constantly
Here is a scenario I run into often, drawn from real coaching sessions rather than one single case. A student collects survey responses through several different Google Forms links, then merges them by hand. The columns rarely match across sheets, so what looks like one table is actually a few half-tables stitched together. Once we realign the variables and rows properly, the cross-tabulation finally works, and the table was always the problem, never the maths.
FAQ
What does data table mean?
A data table means the same thing as tabular data, information arranged in rows and columns so each row is one record and each column is one variable.
What is meant by tabular data?
It means data that is structured into a grid format rather than left as loose text, numbers, or notes.
What is non tabular data?
Non-tabular data is information that does not fit directly into rows and columns, such as interview text, images, or audio, until it is coded or transformed.
Is a frequency table the same as tabular data?
Yes. A frequency table is one specific type of tabular data that shows how often each value occurs in your dataset.
Is Excel data considered tabular data?
Yes, as long as it follows the rows-as-observations, columns-as-variables structure. A messy Excel sheet with merged cells or mixed categories is not properly tabular yet.
What is tabular form data?
This is another name for the same concept, data presented in the form of a table with rows and columns instead of continuous text.
What is table data view?
In software like SQL databases or business intelligence tools, table data view refers to the structured grid display of your data, as opposed to a chart or dashboard view.
What is a table of data used for?
A table of data is used to organise, compare, and analyse information systematically, which is exactly why dissertation examiners expect your results presented this way.
How is tabular data different from tabulated data?
Tabular data describes the format itself, information sitting in rows and columns. Tabulated data describes the outcome of a process, raw information that has been cleaned, grouped, or summarised into that format. Once your raw data is tabulated, it becomes tabular data.
Need Help Getting Your Own Data Into Shape?
This is the exact stage where most of my students get stuck, not the statistics itself but the mess before it. I have worked as an online statistics tutor for over a decade. My statistics tutoring online sessions start with cleaning up your raw data before we touch a single test. That is really what separates a real statistics tutor online from a scripted course.
I also run AP statistics tutoring online for school-level learners who are just meeting frequency tables for the first time. Postgraduate students get a different track: online statistics tutoring built around their actual dissertation dataset, not a generic syllabus. This is also where online tutoring for statistics support becomes ongoing, since a dissertation usually needs more than one sitting to get right.
A lot of students search for a free statistics tutor online before paying for lessons. That is why I keep a short intro call free of charge.
If you want a one-off session, my one-on-one statistics tutoring page has the details. For end-to-end support with tables, tests, and write-ups, I also offer full data analysis tutoring. For more foundational terms like this one, see my essential data terminology guide.
Author: Siddharth Gupta, Independent Statistics and Dissertation Analyst, 12+ years of research and data analysis experience
LinkedIn: https://www.linkedin.com/in/siddharth-gupta-independent-analyst/