
Why Simple Linear Regression Matters in Real World
Hey there, welcome to Statssy! So, you’ve probably heard the term “Simple Linear Regression” thrown around like confetti at a New Year’s Eve party. But what’s the big deal?
What’s the Big Deal About Simple Linear Regression?
Simple Linear Regression is like the GPS for your business or project. It helps you understand the relationship between two things. For example, how your sales go up when you spend more on advertising. It’s all about finding that sweet connection!
List of Cool Things Simple Linear Regression Can Do:
- Predict Future Sales
- Understand Customer Behavior
- Optimize Marketing Strategies
- Improve Product Features
- And so much more!
Why Messing It Up Can Be a Total Vibe Killer for Businesses
Imagine you’re planning a road trip using your GPS, but it keeps leading you to dead-ends. Frustrating, right? That’s what happens when Simple Linear Regression goes wrong. Your business could make some seriously bad moves, like investing in the wrong product or targeting the wrong audience. Ouch!
List of Not-So-Cool Things That Happen When You Mess It Up:
- Wasted Money
- Lost Time
- Poor Business Decisions
- Unhappy Customers
- A Damaged Reputation
Slope & Intercept: The Dynamic Duo of Data
Alright, let’s get into the superheroes of Simple Linear Regression: Slope and Intercept! These two are like Batman and Robin for your data, always there to save the day.
Slope: Your Business’ Mood Ring
The slope is basically the vibe checker for your business. It tells you how one variable (like ad spend) affects another (like sales). A positive slope? Your business is vibing high! A negative slope? Time to check what’s up.
What Different Slopes Mean:
- Positive Slope: More investment in ads = More sales
- Negative Slope: More time spent on customer service = Fewer complaints
- Zero Slope: No matter what you do, things stay the same
- Undefined Slope: Your data is all over the place, and you can’t make heads or tails of it
Intercept: The Starting Line of Your Business Race
Think of the intercept as the “GO!” signal in your Mario Kart race. It’s where your data starts its journey. If you’re looking at sales and ad spend, the intercept is like your base sales when you’re not spending on ads. It’s your starting point, and from there, you either speed up or hit a banana peel.
List of What the Intercept Tells You:
- Positive Intercept: You’re starting strong, even without extra effort!
- Negative Intercept: You’ve got some work to do before things pick up.
- Zero Intercept: You’re starting from scratch, and that’s okay!
So, now you know that the slope and intercept are the dynamic duo your business needs. They help you understand where you’re going and where you’re starting from.
Outliers: The Plot Twists You Didn’t See Coming
Just when you thought you had your data all figured out, BAM! Outliers enter the scene like an unexpected plot twist in a thriller movie. They’re the data points that don’t quite fit in with the rest, and they can either make your story intriguing or turn it into a full-blown horror movie. Let’s dig in and find out why!
How Outliers Can Turn Your Business Story Into a Horror Movie
Imagine you’re running a hip online clothing store, “StyleGenix,” that’s all about sustainable fashion. Your sales have been steadily climbing—until one day, you see a massive spike in your data. You’re ecstatic and think, “Wow, we’ve gone viral!” But hold on a second!
This spike is actually an outlier caused by a celebrity accidentally tagging your brand in a social media post. While it’s tempting to think you’ve hit the jackpot, this outlier can distort your sales forecast and lead you to make risky business decisions, like overstocking inventory. And we all know how overstocking can turn into a clearance sale nightmare, damaging your brand’s exclusive image.
List of Horror Movie Scenarios Caused by Outliers:
- Overstocking Inventory: Thinking the sales spike will continue, leading to wasted resources.
- Misallocated Marketing Budget: Redirecting funds to campaigns that aren’t actually effective.
- Skewed Customer Insights: Believing that a new customer segment is interested when they’re not.
- Operational Chaos: Overstaffing or understaffing based on incorrect data.
- Strategic Blunders: Entering new markets or exiting existing ones based on misleading information.
Outliers: Friends or Foes? – How They Can Make or Break Your Data
| Scenario | Friend | Foe |
|---|---|---|
| Sales Forecasting | Can indicate untapped markets or seasonal trends. | Can lead to overestimating future sales. |
| Customer Behavior | Can reveal niche customer needs or preferences. | Can distort the average behavior, making it look abnormal. |
| Product Reviews | Can highlight exceptional features or flaws. | Can skew overall ratings, either too high or too low. |
| Marketing ROI | Can show the impact of a viral campaign. | Can make a failed campaign seem successful. |
| Operational Costs | Can flag unexpected costs for investigation. | Can make regular costs seem insignificant. |
The “Should I Stay or Should I Go?” Guide to Dealing with Outliers
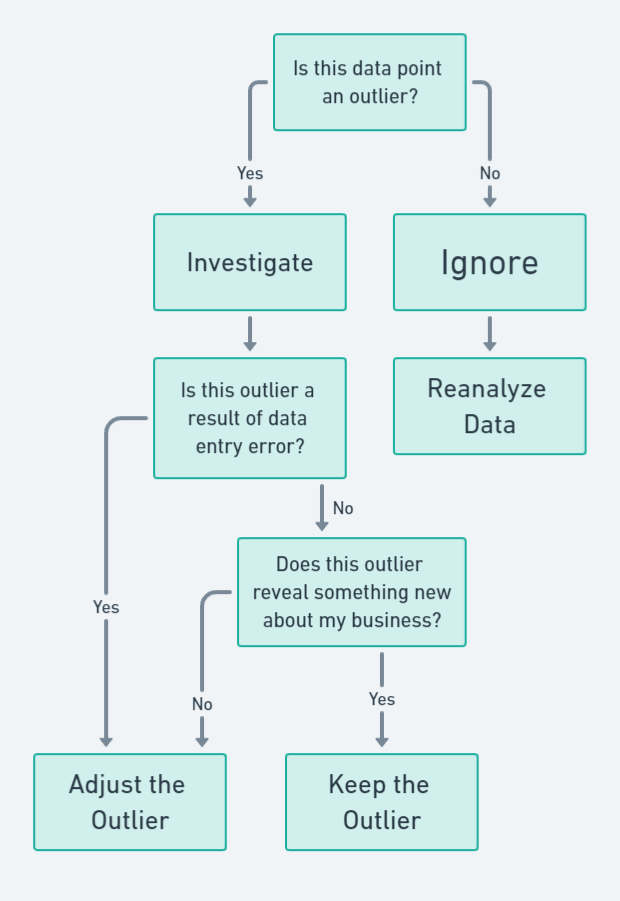
- Investigate: This path leads you through questions like, “Is this outlier a result of data entry error?” or “Does this outlier reveal something new about my business?” Depending on your answers, you’ll either keep the outlier or adjust it.
- Ignore: This path is a straight line to “Reanalyze Data,” reminding you that ignoring outliers should only be done when you’re absolutely sure they offer no valuable insights.
So, the next time you spot an outlier, don’t freak out! Use it as an opportunity to either uncover hidden gems in your business or as a cautionary tale to avoid potential pitfalls.
5 Epic Fails & Wins: Real-World Case Studies
Case Study 1: TrendyTech Inc.
The Problem: App Crashes & User Retention
Imagine you’re the data analyst at TrendyTech Inc., a company known for its cutting-edge mobile apps. You notice that the app crashes are increasing, and you’re concerned about how this could affect user retention. You decide to use simple linear regression to find out if there’s a relationship between the two.
Example Scenario:
- Week 1: 5 crashes, 95% retention
- Week 2: 10 crashes, 90% retention
- Week 3: 20 crashes, 85% retention
Based on this, you might think, “The more the app crashes, the lower the user retention. I’ve got to tell the team!” But wait, there’s more to the story.
How Bad Regression Led to Bad Decisions
Let’s say you starts with “Analyze Data” and ends with “Make Business Decision.” In between, you have steps like “Choose Variables,” “Run Regression,” and “Interpret Results.” The problem arises at the “Interpret Results” step, where you mistakenly conclude that app crashes are the sole reason for low user retention.
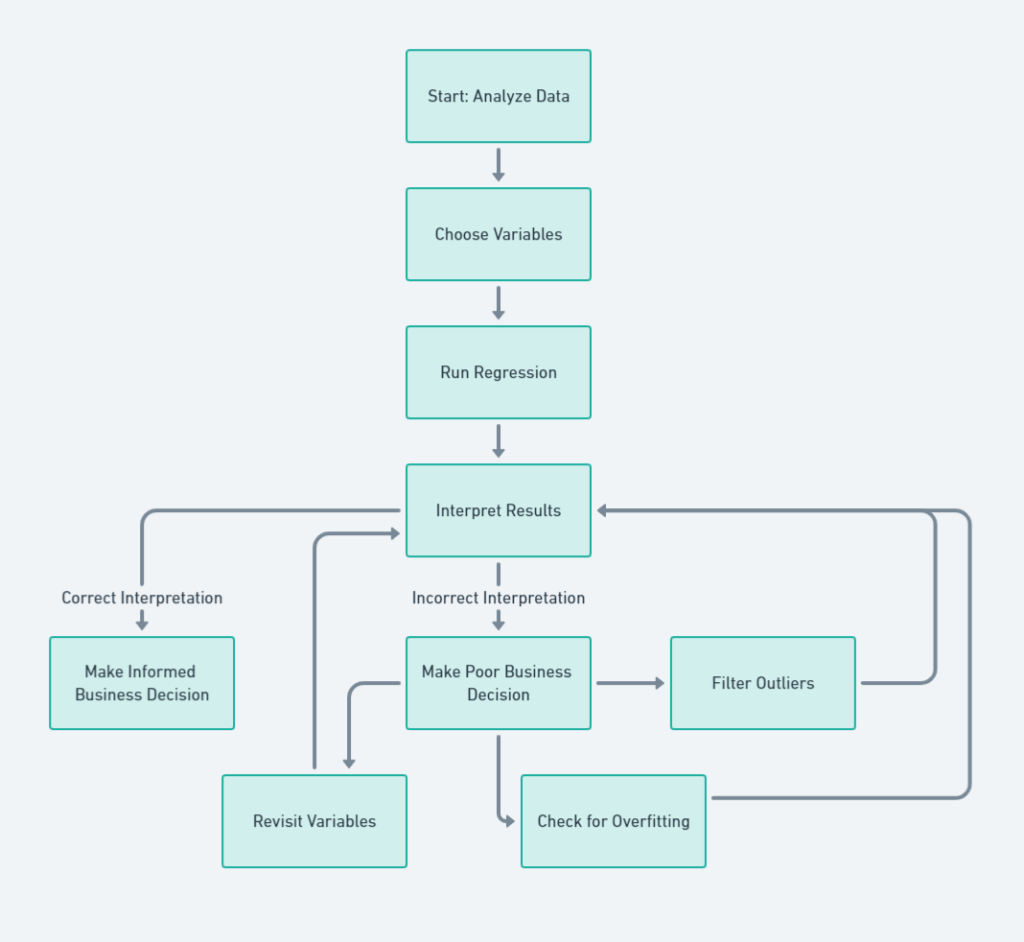
The Assumptions That Led Them Astray
- Ignoring Other Factors: You didn’t consider other variables like app updates, server downtime, or marketing campaigns that could also affect user retention.
- Overfitting the Model: You used a complex model for a simple problem, making your results less reliable.
- Not Checking for Outliers: Maybe one week had an unusually high number of crashes due to a bug, but you didn’t filter that out.
In the end, the company focused all its resources on reducing app crashes but ignored other crucial aspects like user experience and feature updates. A few months down the line, the app is stable but boring, and users are leaving.
Case Study 2: FoodieFusion
The Problem: Menu Changes & Customer Satisfaction
You’re the manager at FoodieFusion, a trendy fusion restaurant that’s the talk of the town. You notice that some items on the menu aren’t selling as well as others. Naturally, you think, “Let’s revamp the menu!” 🍽️
Example Scenario:
- Week 1: Sushi Tacos sell 50 units, Customer Satisfaction at 90%
- Week 2: Sushi Tacos sell 40 units, Customer Satisfaction at 85%
- Week 3: Sushi Tacos sell 30 units, Customer Satisfaction at 80%
You decide to use simple linear regression to find out if the declining sales of Sushi Tacos are affecting overall customer satisfaction. The data seems to suggest that as Sushi Taco sales go down, so does customer satisfaction. Time to sound the alarm, right? Not so fast!
How Wrong Regression Messed Up the Menu
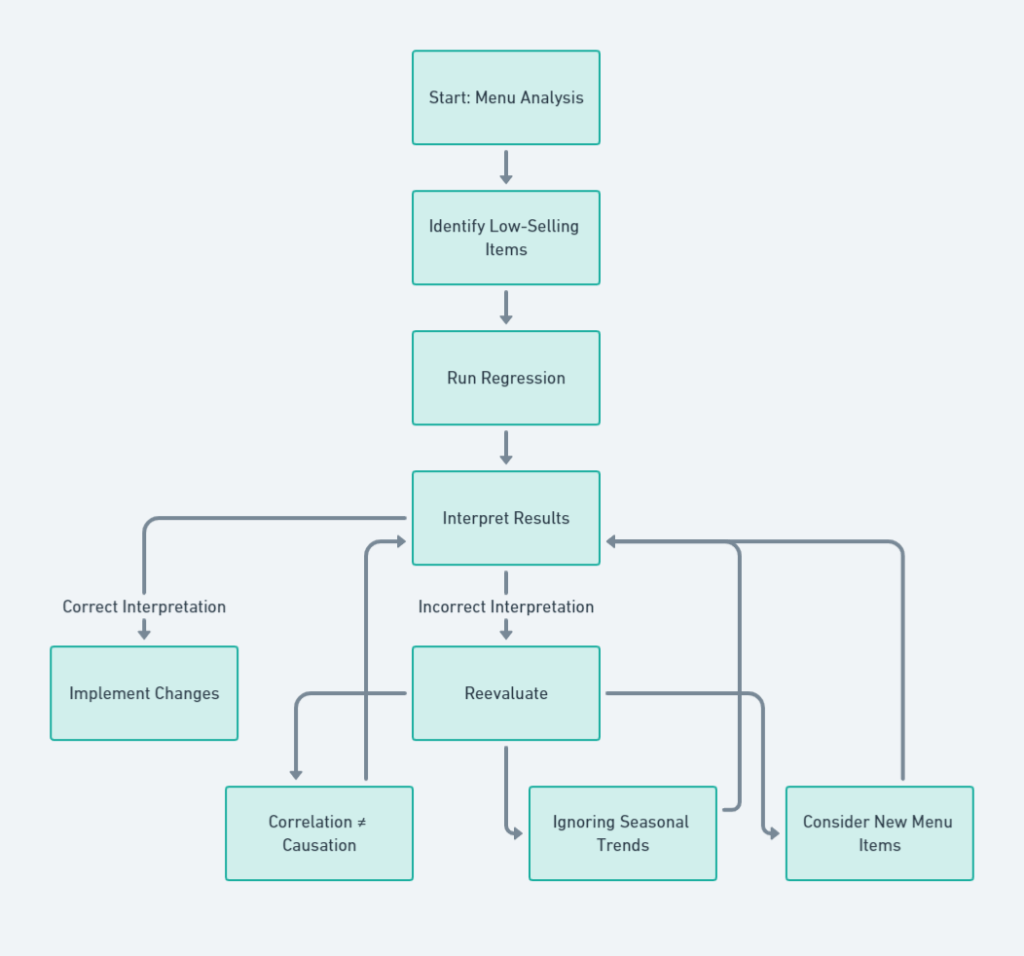
You start with “Menu Analysis” and ends with “Implement Changes.” In between, you have steps like “Identify Low-Selling Items,” “Run Regression,” and “Interpret Results.” You reach the “Interpret Results” step and conclude that Sushi Tacos are the linchpin of customer satisfaction.
The Assumptions That Spoiled the Dish
- Correlation ≠ Causation: Just because Sushi Taco sales and customer satisfaction are both declining doesn’t mean one is causing the other.
- Ignoring Seasonal Trends: Maybe Sushi Tacos are a summer favorite, and it’s now winter.
- Not Considering New Menu Items: You recently introduced Ramen Burgers, which could be stealing the spotlight from Sushi Tacos.
So, what happens next? You double down on promoting Sushi Tacos, even offering discounts. Meanwhile, the real issue—perhaps the quality of new dishes or service speed—is ignored. A month later, you find that customer satisfaction has plummeted, despite Sushi Taco sales going up.
Case Study 3: StreamKing
The Problem: Subscription Plans & Viewer Engagement
You’re the head of analytics at StreamKing, a popular streaming service. You’ve got a range of subscription plans, from basic to premium, and you’re curious about how these plans affect viewer engagement. You think, “Let’s dig into the data!”
Example Scenario:
- Month 1: 1000 Basic Subscriptions, 80% Viewer Engagement
- Month 2: 900 Basic Subscriptions, 75% Viewer Engagement
- Month 3: 800 Basic Subscriptions, 70% Viewer Engagement
You decide to use simple linear regression to investigate if the decline in basic subscriptions is causing a drop in viewer engagement. The data seems to indicate a pattern: fewer basic subscriptions lead to lower viewer engagement. Time to ring the alarm bells, right? Hold on a sec!
How Poor Regression Led to a Content Crisis
You start with “Analyze Subscription Data” and ends with “Strategic Decision-Making.” In between, you have steps like “Identify Subscription Trends,” “Run Regression,” and “Interpret Results.” You get to the “Interpret Results” step and conclude that basic subscriptions are the lifeblood of viewer engagement.
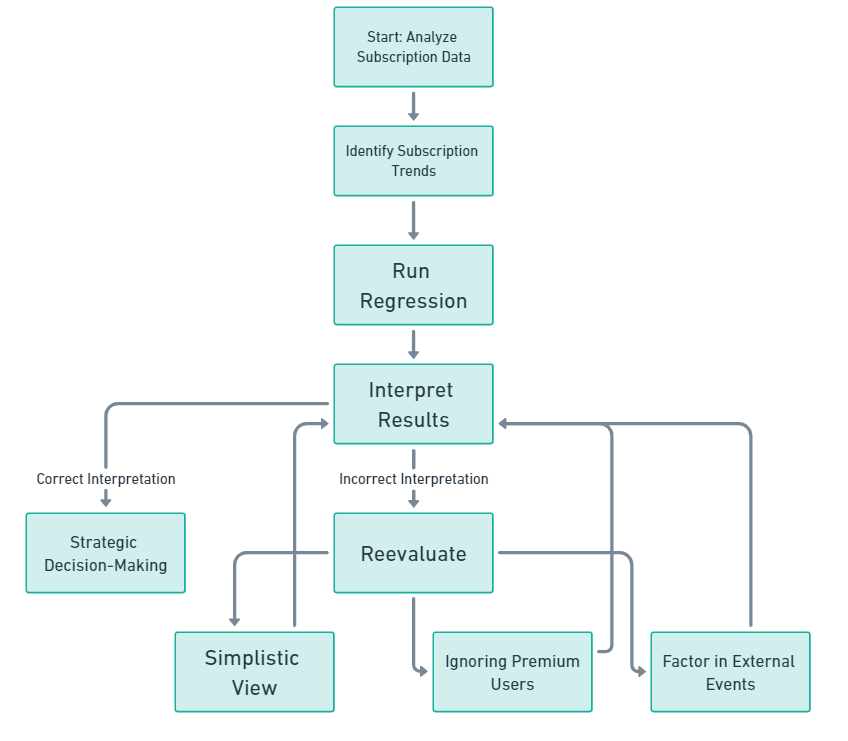
The Assumptions That Were Off-Script
- Simplistic View: You assumed that only basic subscriptions affect viewer engagement, ignoring other factors like content quality or user interface.
- Ignoring Premium Users: Maybe your premium users are super engaged but are fewer in number.
- Not Factoring in External Events: What if a popular show just ended its season, affecting overall engagement?
So, what’s the fallout? You decide to push hard on promoting the basic subscription plan, offering all sorts of deals and discounts. Meanwhile, you neglect to improve the content library or the user experience. A few months later, you find that viewer engagement hasn’t improved, and now you’re stuck with a bunch of unhappy basic subscribers.
Case Study 4: GreenEarth
The Problem: Eco-Friendly Products & Sales
You’re the sustainability officer at GreenEarth, a company that’s all about eco-friendly products. You’ve noticed that sales of your reusable water bottles have been declining, and you’re worried about the impact on the company’s eco-mission. Time to crunch some numbers!
Example Scenario:
- Quarter 1: 2000 Reusable Water Bottles sold, 95% Positive Customer Reviews
- Quarter 2: 1800 Reusable Water Bottles sold, 90% Positive Customer Reviews
- Quarter 3: 1600 Reusable Water Bottles sold, 85% Positive Customer Reviews
You opt for simple linear regression to see if the declining sales of reusable water bottles are affecting customer perception of your brand. The data seems to suggest a correlation: as sales go down, so do positive reviews. Time to hit the panic button, right? Wait a minute!
How Misguided Regression Hurt the Planet
You start with “Product Sales Analysis” and ends with “Sustainability Strategy.” In between, you have steps like “Identify Low-Selling Products,” “Run Regression,” and “Interpret Results.” You arrive at the “Interpret Results” step and conclude that reusable water bottles are the cornerstone of your brand’s image.
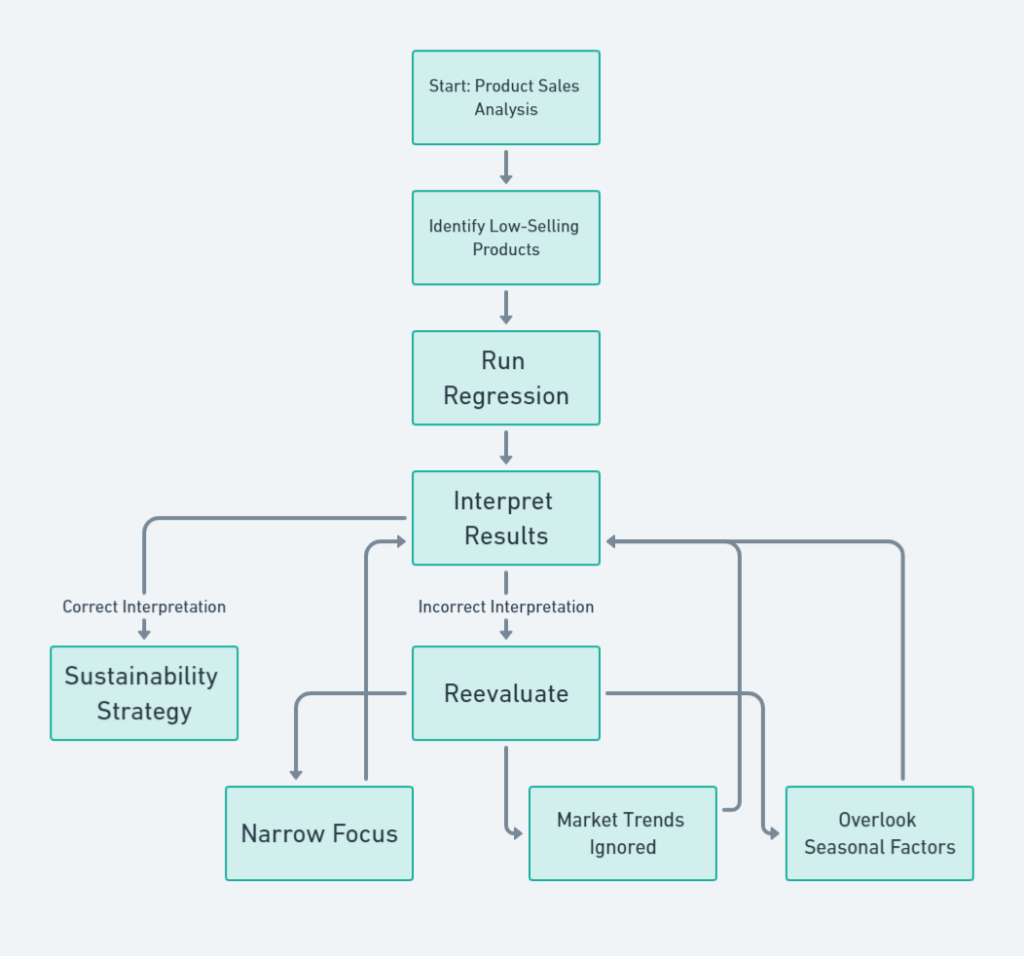
The Assumptions That Weren’t So Green
- Narrow Focus: You only looked at water bottles and ignored other eco-friendly products that might be affecting brand perception.
- Market Trends Ignored: Maybe reusable water bottles are out, and compostable cutlery is in. 🍴
- Overlooking Seasonal Factors: Perhaps it’s winter, and people aren’t buying water bottles as much.
So, what’s the aftermath? You go all-in on marketing reusable water bottles, offering bundle deals and launching new designs. Meanwhile, you neglect other eco-friendly initiatives and products that could have had a more significant impact. A few months later, you find that your brand’s eco-friendly image has suffered, despite a slight uptick in water bottle sales.
Case Study 5: FitLife
The Problem: New Gym Equipment & Membership Renewals
You’re the operations manager at FitLife, a gym that’s all about promoting a healthy lifestyle. You’ve recently invested in some state-of-the-art gym equipment, but you notice that membership renewals are not picking up as expected. Time to break out the spreadsheets!
Example Scenario:
- Month 1: 10 New Treadmills, 90% Membership Renewals
- Month 2: 20 New Treadmills, 85% Membership Renewals
- Month 3: 30 New Treadmills, 80% Membership Renewals
You decide to use simple linear regression to investigate if the increase in new treadmills is affecting membership renewals. The data seems to suggest a trend: the more new treadmills, the fewer membership renewals. Time to sound the alarm, right? Hold your horses!
How Wrong Regression Led to an Empty Gym
You start with with “Equipment Upgrade” and ends with “Membership Strategy.” In between, you have steps like “Analyze Equipment Data,” “Run Regression,” and “Interpret Results.” You get to the “Interpret Results” step and conclude that new treadmills are driving members away.
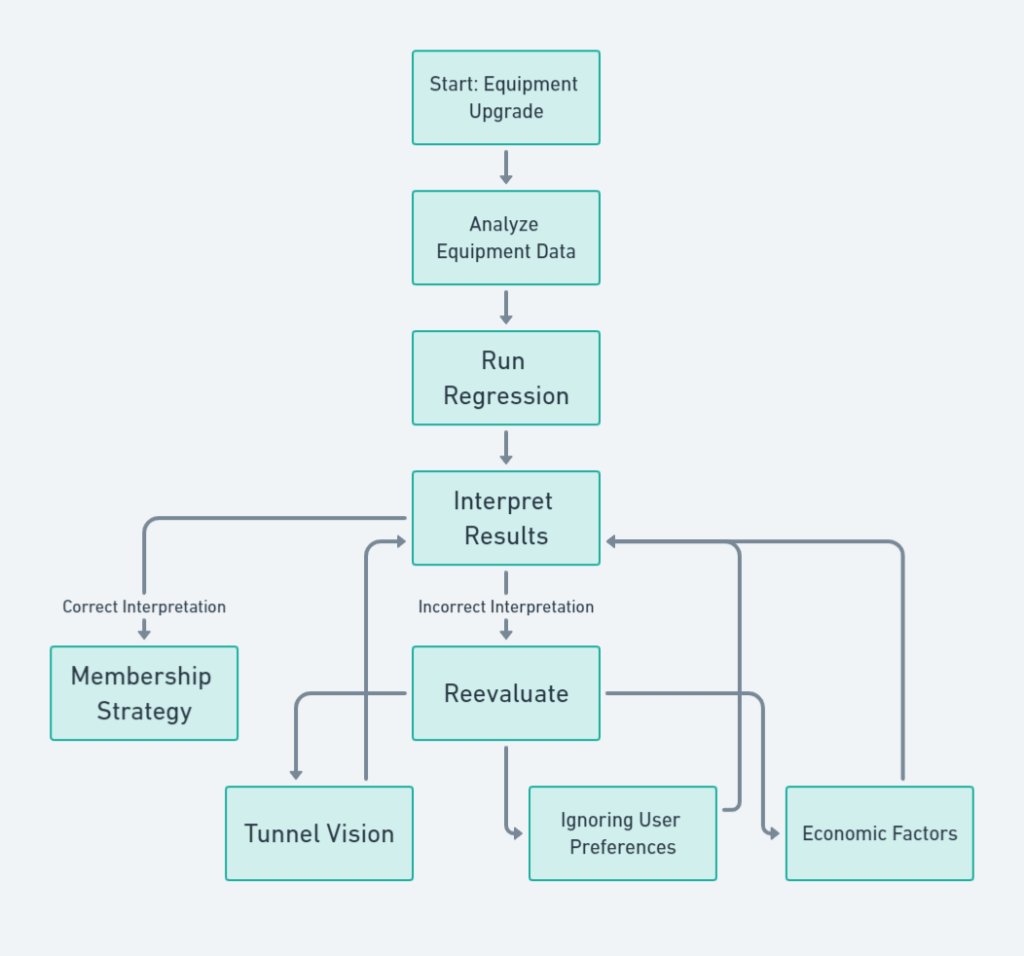
The Assumptions That Didn’t Work Out
- Tunnel Vision: You focused solely on treadmills, ignoring other factors like gym classes, cleanliness, or customer service.
- Ignoring User Preferences: Maybe your members prefer weightlifting over cardio, and the new treadmills don’t excite them.
- Economic Factors: Perhaps there’s an economic downturn, and people are cutting back on gym memberships to save money.
So, what’s the endgame? You decide to halt any further treadmill purchases and even consider selling some. Meanwhile, you neglect other aspects like improving gym classes or offering membership discounts. A few months later, you find that the gym is emptier than ever, and it’s not just because of the treadmills.
That wraps up our series of case studies! Each one highlights the pitfalls of misusing simple linear regression in different business scenarios. Would you like to move on to the next section, or is there something specific you’d like to discuss further?
Small Businesses, Listen Up: Don’t Make These Mistakes!
Are you a business owner or planning to start your own startup! I get it, your are or you will be juggling a lot of hats—CEO, marketer, accountant, and sometimes even janitor. But when it comes to data analysis, especially simple linear regression, you can’t afford to mess this up. Why? Because one wrong move can cost you big time—both in money and reputation.
Why Startups Businesses Can’t Afford to Mess This Up
Let’s break it down. Startups often operate on razor-thin margins. You don’t have the luxury of a massive budget to cushion your mistakes. A wrong decision based on incorrect data interpretation can lead to:
- Wasted marketing dollars
- Lost customers
- Poor inventory management
- And even potential closure
So, when you’re using simple linear regression to make business decisions, you’ve got to get it right the first time. No do-overs!
Top 5 Pitfalls Startups Should Avoid
- Ignoring Other Variables: Don’t just focus on one variable and assume it’s the end-all-be-all. For example, if you’re looking at how price affects sales, don’t forget to consider other factors like seasonality, competition, and market trends.
- Overfitting the Model: Keep it simple, especially if you’re new to this. An overly complex model can give you results that look good on paper but are practically useless.
- Not Checking for Outliers: Always scan your data for anomalies. One outlier can skew your entire analysis and lead you down the wrong path.
- Ignoring Assumptions: Every regression model comes with assumptions. Make sure you understand them and validate that they hold for your specific case.
- Lack of Expert Consultation: If you’re not a data whiz, it’s okay to ask for help. Consult with a data analyst or use reliable software to ensure you’re making informed decisions.
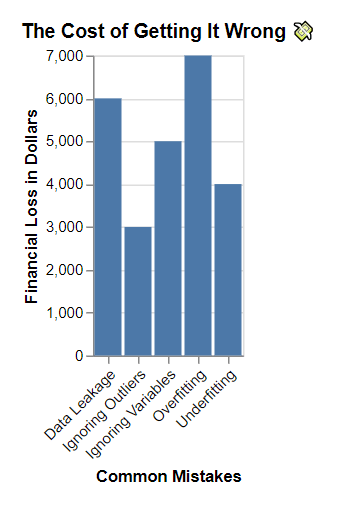
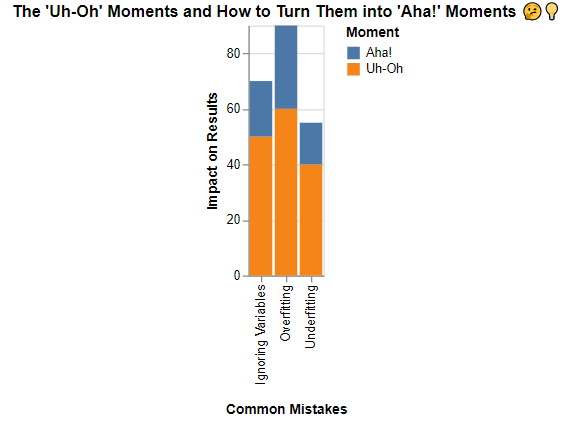
This chart will serve as a stark reminder that mistakes in simple linear regression can be costly, especially for small businesses operating on tight budgets. So, make sure you’re doing it right to avoid a financial fiasco!
So, small business peeps, are you ready to rock simple linear regression without any hiccups?
Newbies, We Got You: Avoid These Traps
A Step-by-Step Guide to Avoiding Common Mistakes in Simple Linear Regression
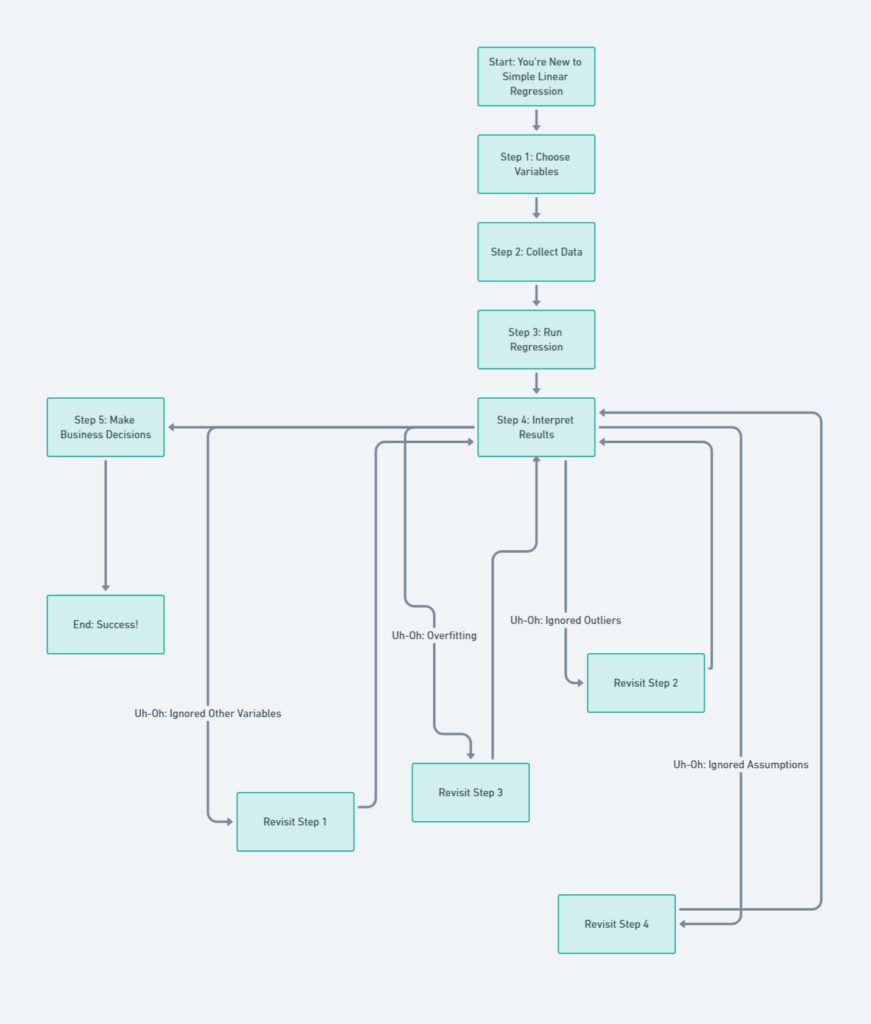
This flowchart is your ultimate cheat sheet! It starts with you being new to simple linear regression and takes you through all the steps, from choosing variables to making business decisions. But wait, there’s more! See those “Uh-Oh” moments? Those are the traps you could fall into. The flowchart guides you back to the step you need to revisit. So, it’s like a GPS for your data journey!
Here’s a table that breaks down each step of the flowchart for a more in-depth understanding. This is like your playbook for avoiding rookie mistakes in simple linear regression!
| Step Number | Description | What to Do | Uh-Oh Moments | How to Fix Uh-Oh Moments |
|---|---|---|---|---|
| Step 1 | Choose Variables | Decide which variables you want to analyze. For example, you might want to look at how advertising spend affects sales. | Ignored Other Variables | Go back to this step and consider other variables that might also affect your outcome. For instance, seasonality or competitor activity could also impact sales. |
| Step 2 | Collect Data | Gather all the data you need for the variables you’ve chosen. Make sure it’s clean and accurate. | Ignored Outliers | Revisit your data and check for any outliers that could skew your results. Filter them out or understand why they exist. |
| Step 3 | Run Regression | Use statistical software to run the regression analysis on your data. | Overfitting the Model | Go back to this step and simplify your model. Overfitting makes your model less reliable for future predictions. |
| Step 4 | Interpret Results | Look at the output of your regression analysis. Pay attention to the slope and intercept, as well as any p-values or confidence intervals. | Ignored Assumptions | Revisit this step and make sure you’ve considered all the assumptions of linear regression, like linearity, independence, and normality. |
| Step 5 | Make Business Decisions | Use your interpreted results to make informed business decisions. | N/A | N/A |
| End | Success! | Congratulations, you’ve successfully navigated the maze of simple linear regression! | N/A | N/A |
Each “Uh-Oh Moment” is a potential pitfall that could throw off your entire analysis. The “How to Fix Uh-Oh Moments” column guides you on how to correct these mistakes and get back on track.
That’s a Wrap: You’re Now a Savvy Simple Linear Regression User!
Hey there, future data whiz! You’ve made it to the end of this rollercoaster ride through the world of simple linear regression. Trust us, this is one skill you don’t want to sleep on.
Quick Recap of Simple Linear Regression: Why You Can’t Afford to Ignore This
- Business Decisions: Understanding the slope and intercept can literally make or break your business.
- Data Literacy: In today’s data-driven world, not knowing how to interpret simple linear regression is like not knowing how to read.
- Avoid Pitfalls: We’ve shown you the traps and how to avoid them. No more excuses for messing up!
- Real-World Applications: From our epic case studies, you’ve seen how this stuff applies to actual businesses, big and small.
- Empowerment: Knowledge is power, and you’ve just leveled up!
So, what are you waiting for? Go out there and conquer the world with your newfound knowledge! And remember, in the world of data, you’re either riding the wave or wiping out. Make sure you’re doing the former.
Further Reading
If you’re keen on diving deeper into the world of business intelligence and data science, there’s a wealth of information waiting for you in my other articles. For a hands-on guide to understanding the intricacies of simple linear regression, don’t miss this Excel tutorial on interpreting slope and intercept. To grasp how correlation impacts business decisions, you’ll find this article on the practical significance of the correlation coefficient in business particularly enlightening.
For those who prefer manual calculations, this step-by-step guide on how to calculate simple linear regression and residuals by hand is a must-read. If R is more your speed, this easy-to-follow guide to simple linear regression in R has got you covered. Python enthusiasts can learn how to create and interpret histograms, how to craft boxplots, and even how to kick off your first data analysis project.
Feel free to bookmark these resources as your go-to guides for becoming a pro in data analytics.