
How to create and interpret histogram in Python – A Step-by-step tutorial for Beginners in Business Analytics

Hey there, data enthusiasts! Welcome to Statssy! In this tutorial, we will learn to build and interpret histograms in Python programming language
Ever wondered how to make sense of a bunch of numbers without getting lost in complex calculations? Well, you’re in luck! Creating a histogram is like taking a snapshot of your data’s “personality.” It gives you a quick and easy way to see what’s going on in your dataset. And guess what? You don’t have to be a math whiz to get it!
So, what’s a histogram, you ask? Imagine you have a bunch of containers, or “bins” as we like to call them. A histogram sorts your data into these bins based on how big or small the numbers are. It’s like organizing your sock drawer by color, but for numbers!
Ready to roll up your sleeves and dive into some Python code? First things first, let’s grab the tools we need by importing the necessary libraries.
#import the libraries
from matplotlib import pyplot as plt
import numpy as np
Alright, so we’ve got two best friends joining us on this data adventure: Matplotlib and NumPy.
Matplotlib is like the artist of Python libraries; it helps us draw all sorts of cool charts. NumPy, on the other hand, is the brainiac that loves crunching numbers and doing all the heavy lifting in the background. Don’t sweat it if these names sound like Greek to you; just think of them as your trusty sidekicks for this project!
So, when we say import matplotlib.pyplot as plt, we’re basically telling Python, “Hey, we’re going to use Matplotlib’s ‘pyplot’ to make some awesome charts, and let’s just call it ‘plt’ to keep things simple.” The same goes for NumPy, which we’re nicknaming ‘np’.
Now, let’s get real and see why histograms are such a big deal. Imagine you’re curious about the daily temperatures in Chicago for a whole month. You know, to decide whether you need to pack your winter coat or your flip-flops.
To do this, we’ll create an array of daily temperatures using a special command. Ready to find out how?
Distribution for Chicago
chicago_temp = np.array([72,77,81,72,77,75,66,66,77,75,75,68,86,97,95,93,86,73,81,71,78,90,84,90,77,81,77,86,84,90])
Okay, so we’ve got this variable called chicago_temp that’s going to be our personal temperature diary for Chicago. Think of it as a bucket where we’ll dump all the daily temperatures for the month.
To make this bucket, or “array” in tech-speak, we use this nifty little command np.array. That’s NumPy’s way of saying, “Alright, let’s organize these temperatures in a neat row!”
Now, hold onto your hats because we’re about to turn that array into a beautiful histogram!
Let’s see the code.
plt.hist(chicago_temp)
Alright, remember our buddy ‘plt’ from earlier? Well, it’s showtime for him! When we use plt.hist, we’re basically telling Python, “Hey plt, let’s make a histogram with the data we’ve got!”
The formula is super simple, almost like a secret handshake:
libraryname.charttype(data)
So in our case, it’s plt.hist(chicago_temp). Easy-peasy, right?
And voilà! Just like that, you’ve got yourself a histogram that tells you all about Chicago’s weather.

Okay, so you’ve got your shiny new histogram in front of you. But what’s it actually telling you? Let’s break it down!
First off, you’ll notice two lines crisscrossing like an “X” on your chart. The horizontal one is all about temperatures, and the vertical one is like a popularity contest for those temperatures.
For example, see that bar hanging out under the 70 mark? It’s got a height of 3. That means we had 3 chilly days where the temperature was below 70. Brrr!
Here’s a quick rundown:
- 3 days were between 70 and 72.5 degrees.
- 4 days were between 72.5 and 75 degrees.
- 6 days were between 75 and 77.5 degrees.
So what’s the takeaway? Most days are hanging out in the 75 to 77.5-degree range. That’s what we call the “modal value,” or the temperature that shows up the most. (Don’t worry, we’ll dig deeper into this later!)
Now, put on your detective hat . Notice how there are more days below 80 degrees and fewer above? That means our data is “skewed to the right” or “positively skewed.”
Why Should You Care?
Well, this histogram is more than just pretty bars; it’s telling you that Chicago tends to be on the cooler side. So if you’re planning a trip, maybe pack an extra sweater instead of those beach shorts.
Alright, pack your bags, we’re going on a virtual trip! Next stop: New Delhi, India! 🇮🇳
This time, we’ve got a new variable in town called delhi_temp. Think of it as our temperature journal for New Delhi, capturing the highs and lows for an entire month.
Just like we did for Chicago, we’ll use our trusty NumPy array to store these temperatures. And you guessed it, we’re going to turn that data into another eye-catching histogram!
Distribution for Delhi
delhi_temp = np.array([102,102,104,106,106,106,108,108,108,108,109,109,109,102,108,100,91,93,88,90,90,95,97,99,100,102,104,106,108,84])
plt.hist(delhi_temp)
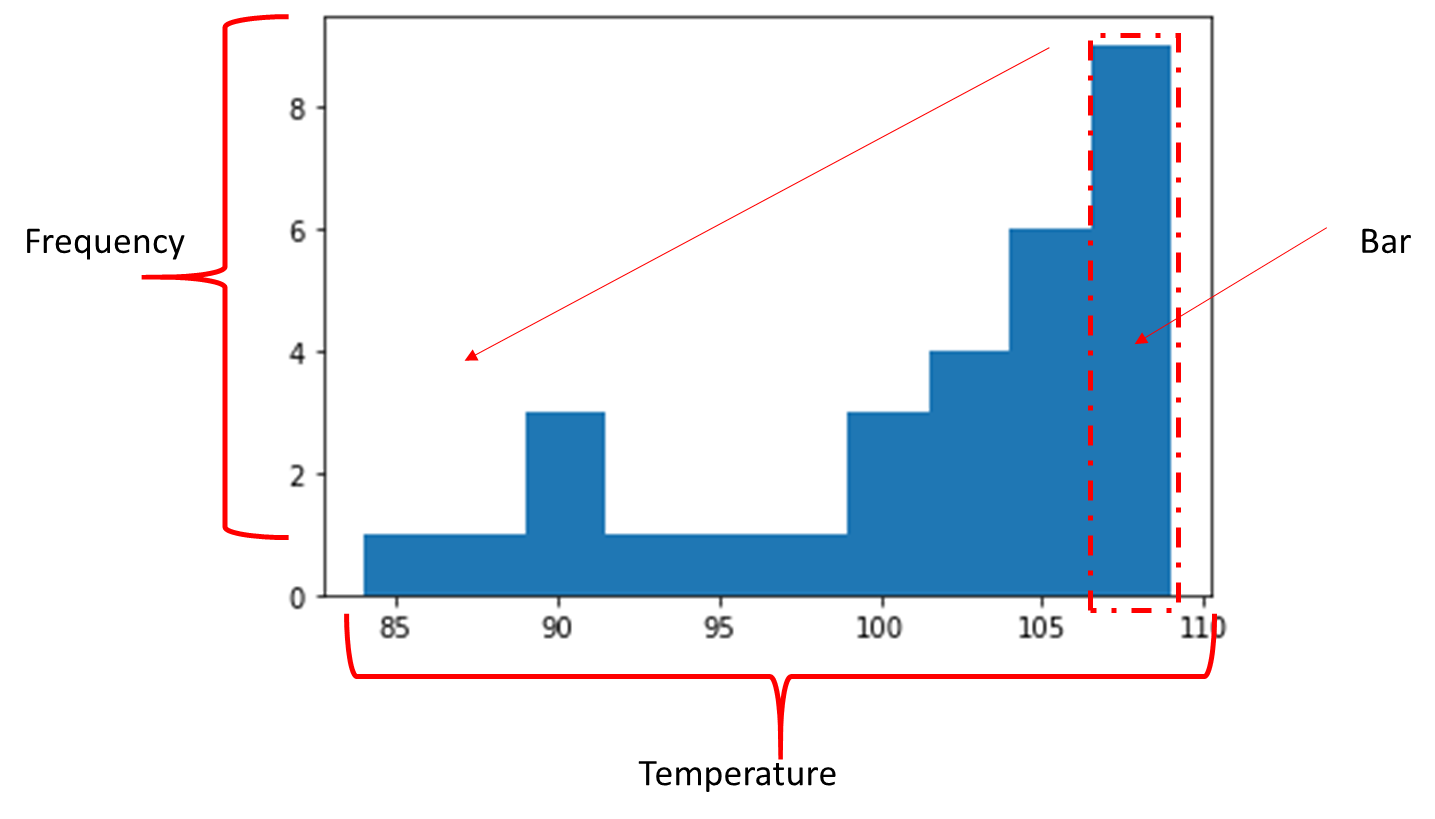
Okay, time to put on your data detective hat again! Let’s decode what New Delhi’s temperatures are telling us.
First off, the temperatures in New Delhi are sizzling between 85 and 110 degrees! Remember Chicago’s range? If you forgot, no worries—just scroll up and take a peek at that previous graph.
Did you see it? Chicago’s temperatures were playing between 65 and 95 degrees. So, give yourself a high-five because you just figured out that New Delhi is a whole lot toastier than Chicago!
Now, let’s dig into New Delhi’s weather story:
The hottest days are between 107.5 and 110 degrees. That’s our modal value, the temperature that shows up the most.
Notice how there are only a few days under 100 degrees? Yep, most days are scorching above 100!
And guess what? This time our data is “skewed to the left” or “negatively skewed.”
Ready for another adventure? Next, we’re flying to Khabarovsk, Russia! 🇷🇺 We’ve got a new variable, khabarovsk_temp, to keep track of the daily temperatures there. Just like before, we’ll use a NumPy array and create another awesome histogram.
Distribution for Khabarovsk: interpret histogram in Python – A Step-by-step tutorial
khabarovsk_temp = np.array([57,63,59,55,66,73,79,75,57,63,68,75,76,71,81,79,77,68,68,68,68,79,69,66,64,66,75,72,76,84])
plt.hist(khabarovsk_temp)

Alright, folks, last stop on our temperature tour: Khabarovsk, Russia! 🇷🇺 Let’s take a look at that horizontal axis, shall we?
Temperatures here are chilling between 55 and 85 degrees. Yep, you guessed it—Khabarovsk is cooler than both Chicago and New Delhi.
Here’s what the Russian weather is whispering to us: histogram in Python
The most common temperatures are snuggled between 67.5 and 70 degrees. That’s our modal value for Khabarovsk.
Unlike Chicago and New Delhi, Khabarovsk doesn’t have any wild temperature swings. It’s pretty consistent!
And here’s the kicker: the temperature distribution in Khabarovsk is what we call “approximately normal.” That means it’s pretty balanced, not leaning too hot or too cold.
And there you have it! You’ve just learned how histograms can give you real-world insights, whether you’re planning a trip or just satisfying your weather curiosity.
Got questions? A bit puzzled? Drop a comment below, and I’ll be more than happy to help you out.
For more weather adventures, check out temperatures from other cities right here.
Conclusion
Wow, what a journey we’ve been on, right? From the windy streets of Chicago to the scorching heat of New Delhi, and finally to the balanced climes of Khabarovsk, histograms have been our trusty guide. But these aren’t just academic exercises or fun facts for your next trivia night. Understanding weather patterns through histograms has real-world business implications, particularly for supply chain management.
Supply Chain Smarts
Imagine you’re a clothing retailer with stores in all three cities we discussed. Knowing the modal temperatures can help you stock the right mix of clothing. Too many winter coats in New Delhi? That’s a supply chain nightmare waiting to happen. Similarly, understanding that Khabarovsk has a more balanced, “normal” temperature distribution can help you maintain a more consistent inventory there.
Risk Mitigation
Weather patterns can also impact the logistics side of your business. For example, if you know that Chicago tends to be cooler, you might plan for potential delays due to snow or ice. This proactive planning can save you not just time but also significant operational costs.
Data-Driven Decisions
Histograms can serve as a quick yet insightful tool for data analysis, enabling you to make informed decisions. Whether it’s deciding where to build your next warehouse, how to optimize shipping routes, or when to launch a seasonal promotion, data is king.
Final Thoughts
So there you have it! Histograms are more than just a data visualization tool; they’re a window into understanding trends, making smarter business decisions, and optimizing your supply chain. If you’ve got any questions or need further clarification, feel free to drop a comment. I’m here to help! histogram in Python
Further Reading
If you enjoyed this article and are eager to dive deeper into the world of Python and data analytics, here are some handpicked articles to expand your knowledge:
For the Chart Enthusiasts
- How to Create a Boxplot in Python: If histograms have you hooked, wait until you see what boxplots can reveal about your data!
For the Numbers Geeks
- How to Calculate the Coefficient of Variation (CV) in Python: Learn how to measure data variability like a pro.
For Aspiring Data Analysts
- Your First Project in Data Analysis Using Python: Analyzing the Most Famous Songs of 2023 and Generate Analytics Report: Ready for a real-world project? Dive into this step-by-step guide to analyze the hits of 2023!