
Super Chill Guide to Interpreting Slope and Intercept of Simple Linear Regression using Excel for Business Analytics
Hey There, Future Data Whiz! Welcome to Statssy. Today we will learn the business interpretation of slope and intercept of simple linear regression.
So, you’ve decided to dip your toes into the fascinating world of data, huh? Trust me, you’re about to embark on an adventure that’s as thrilling as any battle royale game.
Now, you might be wondering, “Why should I care about something as nerdy as slope and intercept in regression?” Well, let me spill the tea . Understanding the slope and intercept in regression analysis is like stumbling upon the ultimate cheat codes in a video game. Seriously, it’s the key to levelling up your data skills and becoming the go-to guru for all things numbers.
Imagine being the person who can predict the next viral TikTok trend or forecast sales for a startup. Sounds pretty dope, right? That’s the kind of wizardry we’re talking about here. 🧙♂️
So, buckle up! We’re about to dive deep into the world of slope regression in statistics, and I promise it’s going to be a ride you won’t want to miss.
Why Simple Linear Regression?
Don’t worry! I know you are starting your journey in data analysis and you are on very first step. So let me give you an idea how your journey will going to be in future.
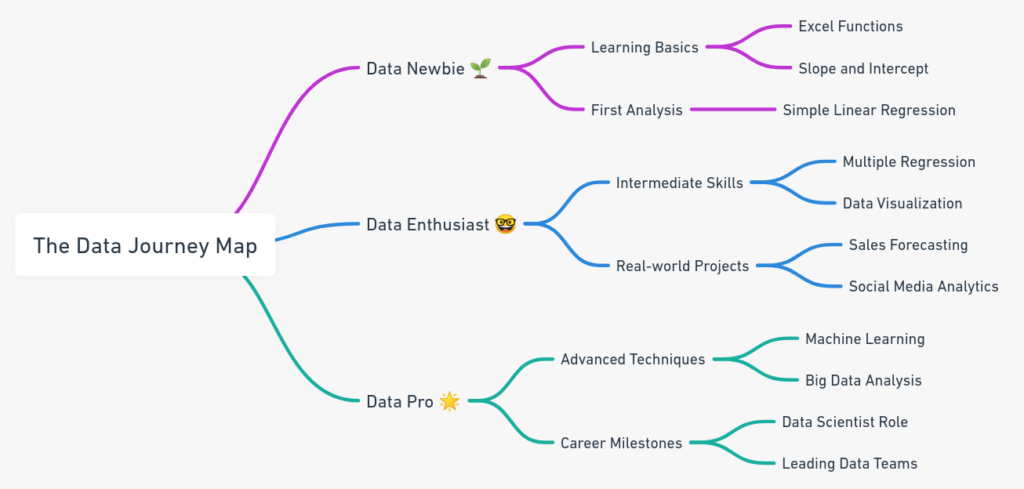
The Data Newbie
First up, you’re a “Data Newbie.” Think of this as the tutorial level of a game. You’ll start by learning the basics like Excel functions. This is where you’ll first encounter the magical world of slope and intercept in regression analysis. You’ll run your first analysis, probably something like a simple linear regression to predict your grades or maybe even the outcome of the next big esports tournament.
The Data Enthusiast
Next, you level up to a “Data Enthusiast.” You’ve got some XP (experience points) now. You’ll start learning intermediate skills like multiple regression and data visualization. You’ll also start working on real-world projects. Imagine being the one to forecast sales for a hot new startup or analyze social media trends.
The Data Pro
Finally, you reach the boss level: “Data Pro.” You’ll unlock advanced techniques like machine learning and big data analysis. This is where you start landing roles like Data Scientist and even leading data teams. You’ll be the Tony Stark of data, creating models that can do everything from predicting stock market trends to figuring out the best strategies for competitive gaming.
So, that’s your journey from zero to hero in the world of data. Excited yet? You should be!
Why Should You Even Care about Simple Linear Regression?
Alright, let’s get real for a second. You might be thinking, “Why should I even care about slope and intercept in regression analysis?” I get it, math topics can sometimes feel like a snooze fest. But trust me, this is different. This isn’t just about crunching numbers; it’s about unlocking insights that can literally change the game.
The Game-Changer: Slope in Regression Analysis
First off, let’s talk about the slope of a regression line. The slope isn’t just a number; it’s a storyteller. It tells you how one variable changes when another variable changes. In business terms, it could mean understanding how your sales go up when you increase your advertising budget. Or in social media lingo, how many more followers you gain for every extra post you make. The slope of the regression line indicates the strength and direction of this relationship.
The Unsung Hero: Intercept
Now, what about the intercept? The intercept is like your baseline, your starting point. It’s what you can expect when all other variables are zero. For example, the intercept could represent the basic revenue you’d make without any advertising. It’s not just a number; it’s a business strategy.
Be the Tony Stark of Data Analysis
Understanding the significance of the slope of regression and the intercept can make you the Tony Stark of data analysis. You’ll be able to make predictions, strategize, and turn data into actionable insights. Imagine walking into a meeting and dropping knowledge bombs that can steer the company’s future. That’s the power we’re talking about here.
So, if you’re still wondering what is the significance of the slope in a regression analysis or what does the slope of a regression line mean, just know that it’s your ticket to becoming a data superhero.
Importance of Simple Linear Regression in Business
When it comes to business analytics, simple linear regression is more than just a fancy term; it’s a game-changing tool. Whether you’re into forecasting, financial analysis, or just trying to understand how different variables interact, this technique has got you covered. For instance, ever wondered how a shift in GDP could shake up your sales? Simple linear regression can help you make those predictions.
But it’s not just about forecasting; it’s about understanding the very fabric of your business data. This method allows you to dig deep into the relationship between variables, offering valuable insights that can guide your business strategy. You’ll get a clear picture of how well your data fits the model, which is crucial for analyzing historical trends and making future projections.
And let’s not forget, this isn’t just for the math whizzes out there. With popular business software like Microsoft Excel, you can easily perform all the necessary calculations. But don’t just rely on the software; understanding the nuts and bolts of simple linear regression can give you a significant edge.
So, if you’re looking to turn data into actionable insights and make informed decisions, simple linear regression is your go-to tool. For a deeper dive into this topic, check out this comprehensive guide on regression analysis.
Just to give you a perspective, that’s how simple linear regression is important.
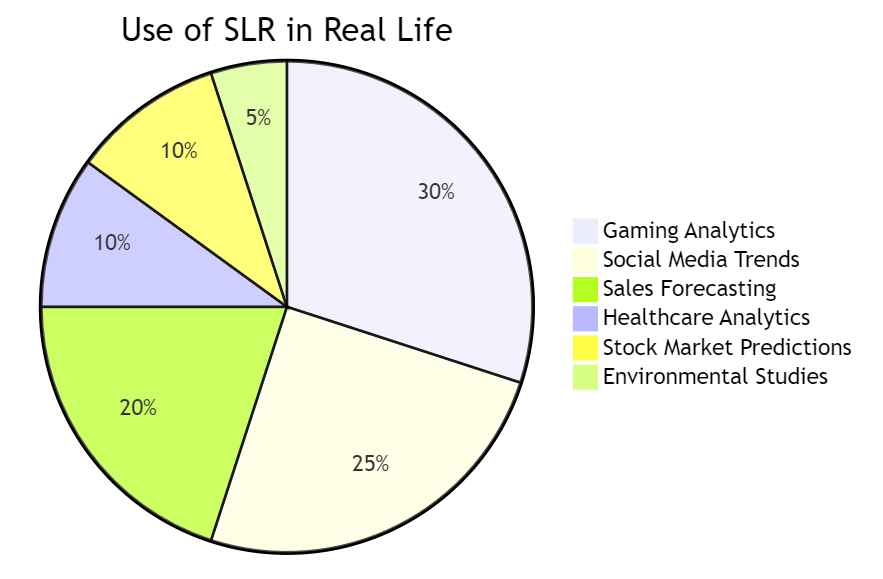
Check out this pie chart! It shows the different fields where regression analysis is super useful. From gaming analytics to social media trends , and even stock market predictions , the applications are endless! So, the next time someone asks you why you’re so obsessed with slopes and intercepts, just show them this chart.
Excel for Data Analysis: Your New Superpower
Alright, let’s talk about Excel, the Swiss Army knife for anyone diving into the world of data. Seriously, if data analysis were a video game, Excel would be that all-in-one weapon you can’t wait to unlock.
Why Excel is the Swiss Army Knife of Data
First things first, why is Excel such a big deal? Well, it’s incredibly versatile. You can use it for everything from basic calculations to advanced data modeling. And yes, it’s perfect for running simple linear regression. With Excel, you can easily find the slope of a regression line and understand the slope regression in statistics like a pro. It’s like having a multi-tool in your data analysis toolkit.
Making Complex Things Super Simple
But what makes Excel truly magical is its ability to make complex things super simple. Want to know how to find the slope of a regression line in Excel? Easy peasy! Just a few clicks and you’ve got your answer. Curious about what the slope of a regression line indicates? Excel’s got you covered with its intuitive charts and graphs.
Excel for Business Analytics
And let’s not forget, Excel is a staple in the field of business analytics. Whether you’re trying to forecast sales, analyze social media trends, or understand the significance of the slope of regression in a business context, Excel is your go-to tool.
So, if you’re wondering how to find the slope of a regression line or what is the significance of the slope in a regression analysis, look no further. Excel is your new superpower, making you the Tony Stark of data analysis.
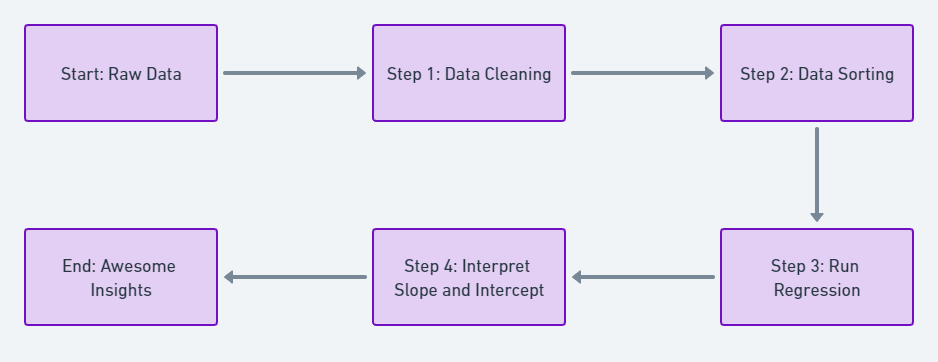
To put things in perspective, let me give you steps that you have to follow for performing data analysis in excel.
Let’s get back to topic.
The ABCs of Slope and Intercept
Hey, don’t sweat it if terms like “slope for regression line” or “intercept” sound like a foreign language to you. We’re here to break down the jargon into plain English so you can become the data whiz you’re destined to be!
Breaking Down the Jargon
First up, let’s talk about the slope in regression analysis. When we say “slope,” we’re basically talking about the rate at which one variable changes in relation to another. In simpler terms, the slope of a regression line indicates how much y (the dependent variable) will change when x (the independent variable) changes. It’s like the speedometer of your data car, telling you how fast you’re going!
What Does the Slope Tell Us?
The slope of a regression line is super telling. It can indicate whether there’s a positive or negative relationship between the variables. For example, if you’re looking at sales data, a positive slope could mean that as advertising spending increases, so do sales. In business terms, this is golden information for actionable insights.
And What About the Intercept?
Now, let’s not forget the intercept. The intercept is the value of y when x is zero. In other words, it’s your starting point. If you’re wondering what is the significance of the slope of regression, then the intercept is equally significant. It gives you the baseline data, like the minimum sales you can expect without any advertising spend. 🛒
What Does the Intercept Tell Us?
The intercept is like your safety net. It tells you where you’ll land if all other variables are zero. In a business context, understanding the intercept can help you set realistic expectations and benchmarks.
So, the next time you’re puzzled about how to find the slope of a regression line or what the slope and intercept of a regression line actually mean, just remember these ABCs. They’re your cheat codes for understanding data and making it work for you!
Confused by all the technical jargon? Don’t worry, we’ve got you covered with this Jargon Buster table! From understanding the climb rate of the slope for the regression line to knowing your starting point with the intercept, this table translates all those complicated terms into slang that you can vibe with. So the next time you’re diving into regression analysis, you’ll know exactly what’s up!
| Statistical Jargon | How you can remember it? | What does it mean? |
|---|---|---|
| Slope | The Climb Rate | The slope tells you how fast one variable changes in relation to another. Think of it like climbing a hill; the steeper the hill (or slope), the faster you’ll see changes. “The Climb Rate” is a just way to remember this because it gives you an idea of how quickly you’re “climbing” towards your goal or outcome. |
| Intercept | The Launch Pad | The intercept is where your data starts on the graph, specifically where the line crosses the y-axis. It’s like the starting point in a race or a launch pad for a rocket. “The Launch Pad” captures this idea, making it clear that this is where your data journey kicks off. |
Let’s Get Hands-On: Excel Time! “
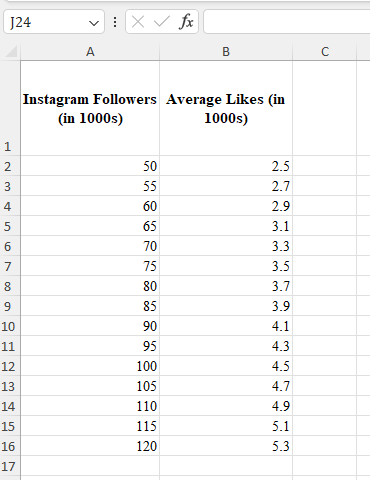
Dataset: “Instagram Followers vs. Average Likes “
Here’s a dataset that tracks the number of Instagram followers and the average likes per post for 15 different Instagram influencers. We will try to predict how many likes on average an influencer will get based on their followers.
| Instagram Followers (in 1000s) | Average Likes (in 1000s) |
|---|---|
| 50 | 2.5 |
| 55 | 2.7 |
| 60 | 2.9 |
| 65 | 3.1 |
| 70 | 3.3 |
| 75 | 3.5 |
| 80 | 3.7 |
| 85 | 3.9 |
| 90 | 4.1 |
| 95 | 4.3 |
| 100 | 4.5 |
| 105 | 4.7 |
| 110 | 4.9 |
| 115 | 5.1 |
| 120 | 5.3 |
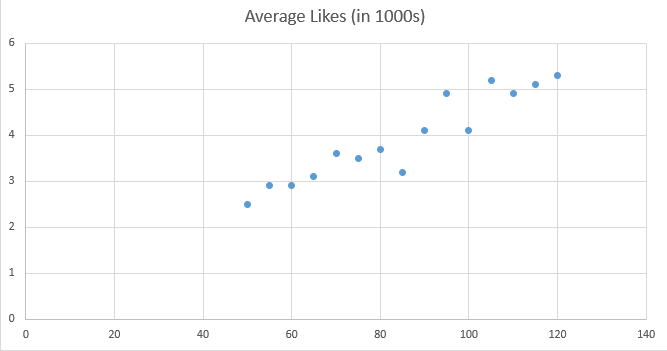
Chart: Instagram Followers vs. Average Likes
Before we jump into Excel, let’s visualize this data with a scatter plot. It’ll give you a quick idea of how the number of followers might influence the average likes.
Steps to Find Slope and Intercept in Excel
Open Excel and Input Data
Open a new Excel sheet and input the dataset in two columns: one for Instagram followers and another for average likes.
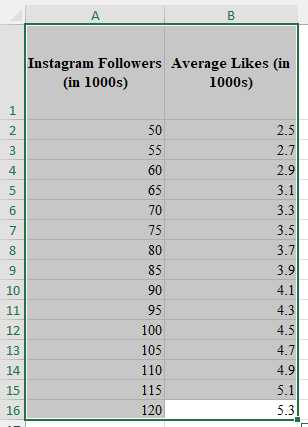
Highlight Data
Highlight the dataset. This will set you up for the next steps.
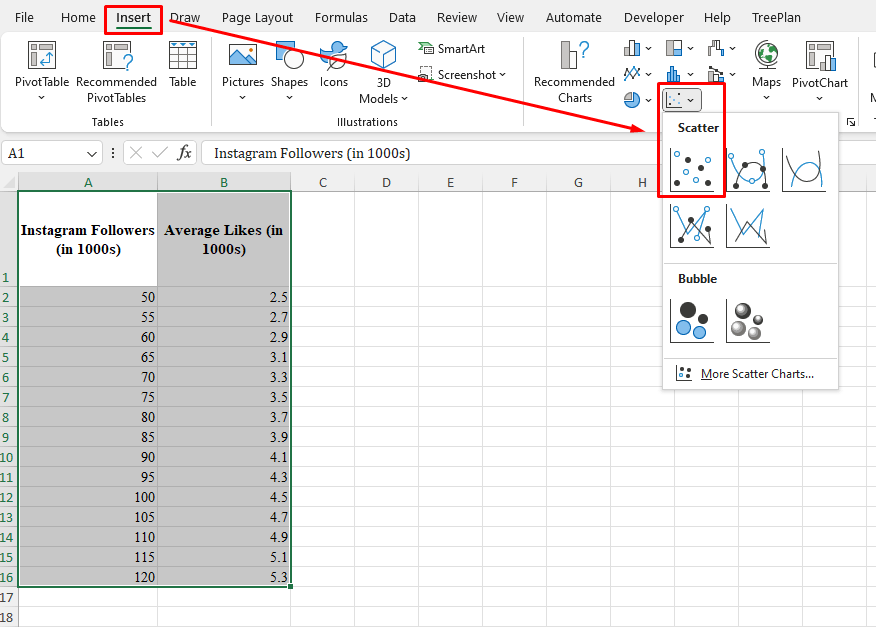
Insert Scatter Plot
Navigate to the ‘Insert’ tab and choose a scatter plot. This will plot your data points.
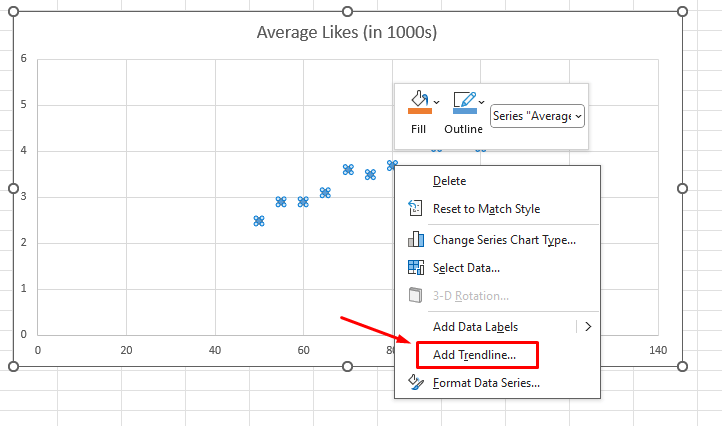
Add Trendline
Click on any data point in the scatter plot, right-click, and choose ‘Add Trendline.’
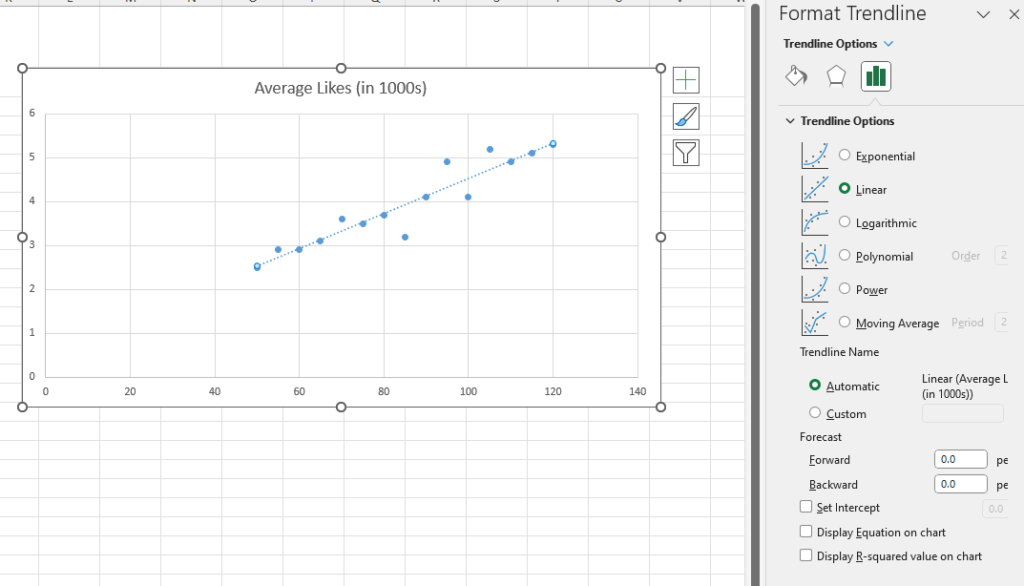
Display Equation
In the trendline options, check the box that says ‘Display Equation on Chart.’ This equation will give you the slope and intercept, helping you understand the relationship between followers and likes.
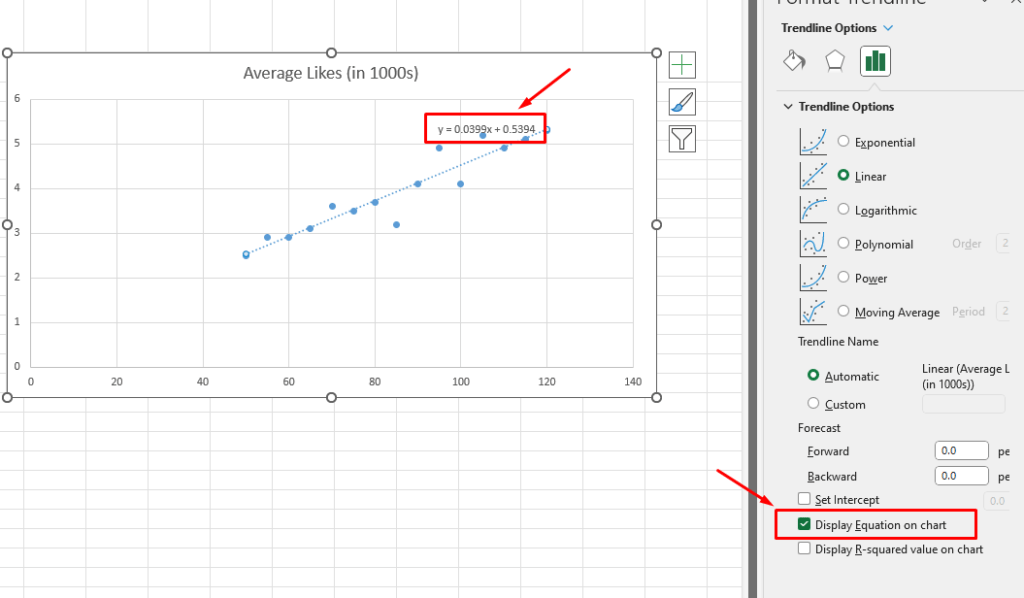
So our simple linear regression shows the equation in terms of y and x.
y = 0.0399x + 0.5394
Now we already know that y means the number of likes and x means the number of followers. So let’s write it that way.
Number of Likes = 0.0399 (Number of Followers) + 0.5394
What’s the Slope Got to Do With It?
Equation: ( y = 0.0399x + 0.5394 )
Alright, let’s get down to the nitty-gritty of what this equation actually means for your Instagram game.
The Slope: Your Instagram Growth Multiplier
The slope in our equation is 0.0399. In Insta-terms, this means for every additional 1000 followers you gain, you can expect an increase of about 39.9 likes on your average post. So, if you’re sitting at 50,000 followers and you jump up to 51,000 followers, your average likes per post would go from around 2,500 to approximately 2,539.9. That’s almost 40 more likes just by gaining 1000 new followers!
Setting Goals: The 100K Milestone
Let’s say your next big goal is to hit 100,000 followers. With the slope of 0.0399, you can expect your average likes to be:
Average Likes = (0.0399 × 100) + 0.5394 = 4.5394 (in thousands)
That’s approximately 4,539 likes per post when you hit that 100K follower milestone!
Real Talk: Quality Over Quantity
While it’s super tempting to focus solely on the numbers, remember that engagement quality also matters. A higher slope doesn’t just mean more likes; it could also mean more meaningful interactions, comments, and shares, which are golden in the Instagram world.
So, the slope isn’t just a number; it’s a practical tool to gauge how your Instagram engagement grows as your follower count rises. Use it wisely!
So to make it clear, imagine you have got some different value of slope. Then what you would be able to conclude? Lets say if slope is 0.01 or 0.05 or 0.1 then what will happen?
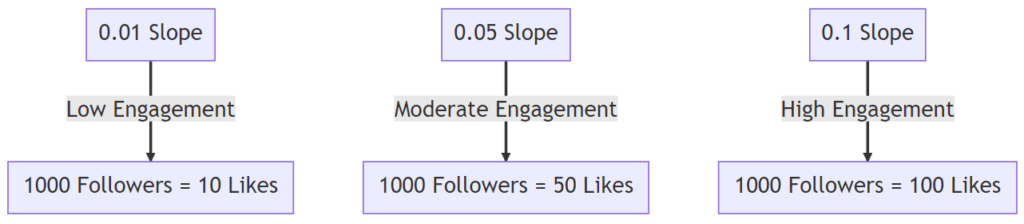
- 0.01 Slope (Low Engagement): With 1000 new followers, you’d only get about 10 more likes.
- 0.05 Slope (Moderate Engagement): With 1000 new followers, you’d get around 50 more likes.
- 0.1 Slope (High Engagement): With 1000 new followers, you’d get a whopping 100 more likes!
Why You Should Care About the Intercept
Equation: ( y = 0.0399x + 0.5394 )
Let’s not forget the other star of the show—the intercept, which in our equation is 0.5394. In real-life terms, think of the intercept as your “baseline vibe” or your “starting point” on Instagram.
The Intercept: Your Baseline Vibe
The intercept is like your Instagram profile’s base level of likes, even if you had zero followers. In our case, the intercept of 0.5394 means that even without any followers, you’d still get around 539 likes on an average post. It’s like your guaranteed minimum number of likes, your safety net!
Real-World Scenario: The Influencer’s Life
Imagine you’re an aspiring influencer. You’ve just created your Instagram account, and you’re starting from scratch. With an intercept of 0.5394, you already know that your posts have a “baseline vibe” of around 539 likes. This is super useful for setting expectations and planning your content strategy.
Why It Matters
The intercept is crucial because it gives you a starting point. Knowing your baseline vibe helps you understand what you’re working with before you even start gaining followers. It’s like knowing the minimum amount you’ll earn at a new job before bonuses.
So, the next time you look at a regression equation, don’t just focus on the slope. The intercept is your secret weapon for setting a strong foundation for growth!
Now imagine if the intercept is different. Means if there are no followers, how many likes you can get? Now that will decide the quality of your content.
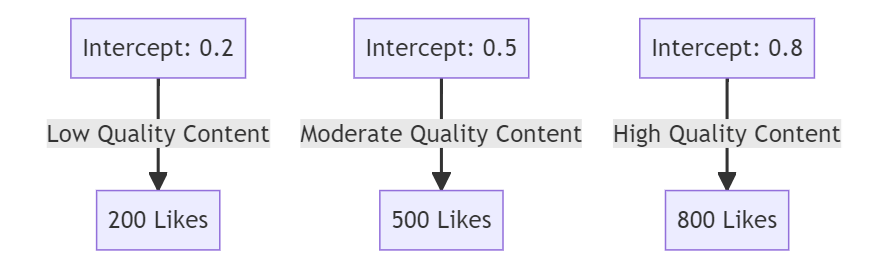
- 0.2 Intercept (Low Baseline): Even without followers, you’d start with 200 likes. It’s like your content is decent but not yet eye-catching.
- 0.5 Intercept (Moderate Baseline): With no followers, you’d still get 500 likes. Your content is already resonating with people!
- 0.8 Intercept (High Baseline): Zero followers but 800 likes? Wow, your content must be super engaging!
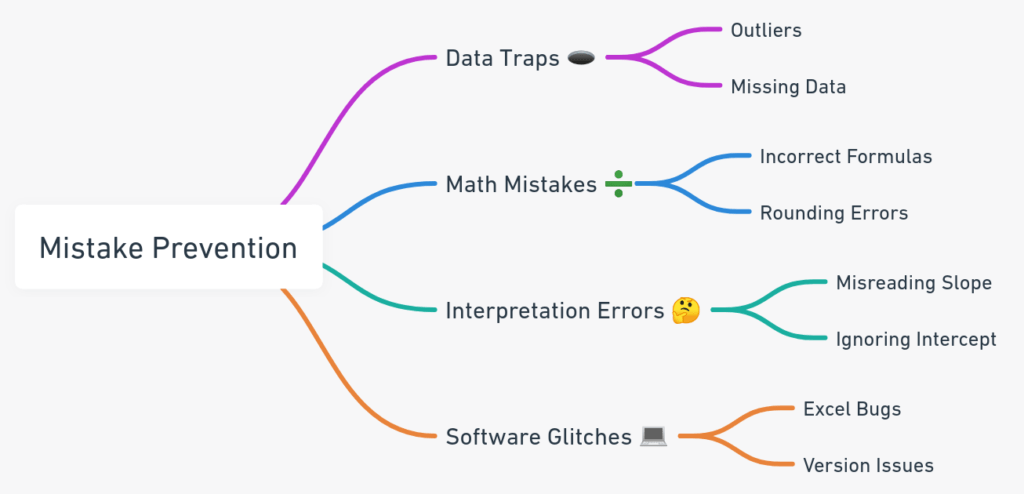
Oops! Watch Out for These

Common Mistakes in Regression Analysis
- Ignoring Outliers: One rogue data point can skew your entire analysis. Imagine one post going viral and getting 10,000 likes—it’s an outlier that can mess up your slope and intercept.
- Wrong Variables: Picking irrelevant variables can lead to misleading results. For example, using the number of posts instead of followers to predict likes might not give you accurate insights.
- Overfitting the Model: If your model is too complex, it might perform well on your sample data but fail miserably on new data. Keep it simple, especially when you’re just starting out.
- Ignoring the Residuals: Residuals are the differences between the observed and predicted values. If these are not randomly distributed, your model might not be the best fit.
How to Avoid These Mistakes
- Data Cleaning: Make sure to remove or adjust for outliers. This will give you a more accurate slope and intercept.
- Variable Selection: Stick to variables that logically should have an impact on what you’re trying to predict. In our case, the number of followers is a good predictor for the number of likes.
- Keep It Simple: Don’t add unnecessary complexities to your model. A simple linear regression is often enough, especially for beginners.
- Check Residuals: Plot the residuals to see if they’re randomly distributed. If not, consider a different model or transformation.
So that the end of our discussion on slope and intercept of simple linear regression. I hope you enjoyed it.
If you’re just starting out in the world of data analysis, you might find some of the terminology a bit confusing. Don’t worry, this essential data terminology guide has got you covered. Once you’re familiar with the basics, you can dive into calculating simple linear regression and residuals by hand or explore the Pearson correlation coefficient. Understanding what residuals are in statistics and the different levels of measurement can also be super helpful. If you’re more into the nitty-gritty details, you might want to check out skewed distributions or the different types of statistical analysis techniques.
For those who are more software-savvy, there are comprehensive guides on how to perform simple linear regression in R and even mastering the alphabet in R programming. If you’re a Python enthusiast, you can learn how to create and interpret histograms or even generate random phone numbers using Python. And if you’re looking for a real-world project, why not try analyzing the most famous songs of 2023 using Python?