Hey there, ever wondered how Netflix just knows you’re going to binge-watch that new mystery series next? Or how TikTok always serves you videos that you can’t help but watch? Well!! to answer it you need to know about what are random variables.
Table of Contents
What’s a Random Variable, You Ask?
Okay, so first things first. A random variable isn’t some mysterious math thingy that you’ll never use. Nah, it’s actually a super cool concept that helps apps like Instagram and Snapchat figure out what content to show you.
Imagine you’re scrolling through your Insta feed; the type of posts you’ll see next is kinda like a random variable. It could be a cute dog pic, a travel vlog, or maybe even your friend’s lunch (because who doesn’t love a good food pic, right? ).
Need help with Statistics?
Connect on Whatsapp
Why Should You Even Care Random Variables?
So you might be thinking, “Cool, but why should I care about random variables?” Well, here’s the kicker: they’re literally everywhere! From YouTube recommending your next video to Snapchat deciding which stories pop up first , random variables are the behind-the-scenes MVPs making your online experience awesome.
And it’s not just social media. If you’re into gaming , random variables decide what kind of loot you get. If you’re into shopping , they help predict what products you might wanna buy next. They’re like the secret sauce that makes the digital world as addictive as it is. So whether you’re a future data scientist, a budding influencer, or just someone who loves to stay in the loop, understanding what random variables are can be a total game-changer.
So, ready to dive into the fascinating world of random variables in statistics and data science? Trust us; it’s gonna be a ride you won’t wanna miss!
So, What’s a Random Variable Anyway?
Alright, let’s get into it! You know when you put your playlist on shuffle and you’re not sure if the next track will be Billie Eilish or BTS? That’s kinda like a random variable.
In simple terms, a random variable is something that can have different outcomes, and you’re not 100% sure what you’re gonna get. It’s like rolling a dice ; you could get anything from a 1 to a 6.
Breaking It Down: Random Variable Definition
So, in statistics and data science, a random variable is a bit more formal. It’s a variable that can take on different values based on some sort of randomness. But let’s not get lost in the jargon. Think of it like this: a random variable is the DJ of your life’s playlist. It’s what decides whether you’ll get a pop song or a ballad next.
Why Should I Care about Random Variable?
Okay, so you get what a random variable is, but why is it such a big deal? Well, random variables are like the secret sauce in everything from gaming to social media algorithms .
Ever wonder how YouTube knows to recommend that perfect video that keeps you up way past your bedtime? Yep, you guessed it—random variables in action! They help YouTube’s algorithm figure out what you’re most likely to click on next.
Or how about when you’re gaming and you find a loot box? The kind of gear or goodies you get? That’s all determined by random variables too!
And let’s not forget Instagram. You know how your feed seems to magically show you posts you actually care about? That’s random variables working behind the scenes to make your scrolling as fun as possible.
So whether you’re into TikTok trends, Snapchat streaks, or Netflix binge-watching, random variables are the unsung heroes making your digital life lit.
Meme
Types of Vibes, I Mean, Variables
Alright, so now that we’re all on the same page about what a random variable is, let’s talk about the different flavors they come in. Yep, just like your fave ice cream, random variables have types too!
What are Discrete Random Variables : Your Digital BFF
First up, let’s chat about discrete random variables. These are like the Instagram likes or the number of Snaps you get in a day. They’re specific, countable things. You can’t have 3.5 likes on a post, right? It’s either 3 or 4, no in-betweens!
Imagine a cute pixel art or a sequence of emojis like to represent a discrete random variable. It’s like each pixel or emoji is a specific, countable ‘thing’—just like a discrete random variable!

Table: “Discrete vs. Continuous: What’s Your Style?”
| Feature | Discrete Random Variables | Continuous Random Variables |
|---|---|---|
| What it’s like | Counting Instagram likes | Your Spotify streaming time |
| Countable? | Yep, like 1, 2, 3… | Nah, it’s more like a flow like 1, 1.1, 1.2, …..2, 2.1 |
| Examples | Number of TikTok views | How long you binge Netflix |
| In Real Life | Snaps received per day | Time spent on YouTube |
| Why You Should Care | Helps in targeted ads | Makes your playlists lit |
So, discrete random variables are your digital BFFs . They’re straightforward, easy to count, and super useful when it comes to things like social media algorithms and gaming loot. Next time you count your likes or views, give a shoutout to your discrete random variable friends!
What are Continuous Random Variables: The Smooth Operators
Alright, fam, we’ve talked about discrete random variables, your countable digital BFFs . Now, let’s switch gears and meet their chill cousins: continuous random variables.
What’s a Continuous Random Variable?
Imagine you’re streaming your favorite playlist on Spotify. The music flows seamlessly, right? There’s no stopping and starting; it’s one smooth experience. That’s what continuous random variables are like. They can take on any value within a range and aren’t just limited to specific, countable numbers.
For example, think about how long you binge-watch Netflix. It could be 2 hours, 15 minutes, and 37 seconds—or any other time within a range. That’s a continuous random variable at work, making sure your streaming time is as unique as you are!

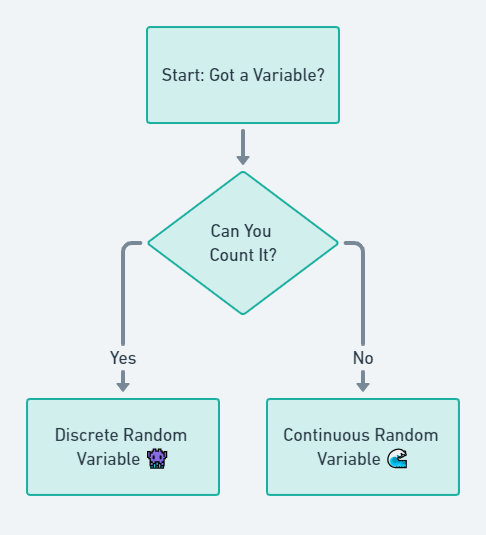
Flowchart: Is it Discrete or Continuous?
Wondering how to figure out if you’re dealing with a discrete or continuous random variable? Check out this flowchart to help you decide:

So, continuous random variables are the smooth operators of the random variable world. They’re all about flow and range, and they play a huge role in things like music streaming, video recommendations, and even how your GPS calculates the time to your destination .
Stay tuned as we explore more about these fascinating variables and how they make our digital lives so much better!
The Mixologists: When Discrete Meets Continuous
So, we’ve hung out with the discrete random variables, those countable, specific things like the number of likes on your latest TikTok video . We’ve also chilled with the continuous random variables, those smooth operators that flow like your endless Netflix binge sessions . But what if I told you there’s a third type that’s like the life of the party, mixing both discrete and continuous? Yep, meet the mixed random variables!
What’s a Mixed Random Variable, You Ask?
Imagine you’ve got a Spotify playlist that’s a blend of quick, 3-minute pop songs and in-depth, 2-hour podcasts. Some tracks are short and specific (discrete), while others can last for any length of time within a range (continuous). That’s a mixed random variable for you! It’s like having the best of both worlds in one playlist.
Not clear yet? Imagine you’re scrolling through Instagram. You see posts (discrete, because each post is countable) and then decide to watch IGTV videos that can be any length (continuous). Your total time on Instagram becomes a mixed random variable!
Still not clear? Think about a YouTube channel that offers both short, 5-minute tutorials and long, 1-hour documentaries. The number of videos you watch is discrete, but the total time you spend watching is continuous. Combine them, and you’ve got a mixed random variable!
I hope its clear now. But still let’s say you’re gaming. The number of levels you clear is discrete, but the time you spend on each level could vary, making it continuous. Your overall gaming experience? Yep, that’s a mixed random variable!
The Ultimate Showdown: Discrete vs. Continuous vs. Mixed
| Feature | Discrete Random Variables | Continuous Random Variables | Mixed Random Variables |
|---|---|---|---|
| What it’s like | Counting TikTok views | Your Netflix binge time | A Spotify playlist of songs & podcasts |
| Countable? | Absolutely, like 1, 2, 3… | Nope, it’s a flow | It’s complicated: sometimes yes, sometimes no |
| Real-World Examples | Snaps received per day | Time spent on YouTube | Gaming levels & playtime |
| More Examples | Instagram posts | Length of a Netflix movie | YouTube short clips & documentaries |
| Why You Should Care | Perfect for targeted ads | Makes your playlists awesome | Keeps life spicy and interesting! |
So, mixed random variables are like the DJs of the random variable world . They mix and match to give us a richer, more varied experience, whether we’re scrolling through social media, watching videos, or gaming. They make sure life online is never, ever boring.
Probability Distributions: The Recipe Book
Alright, so we’ve met our random variables—discrete, continuous, and mixed. But how do we make sense of them? Enter probability distributions! Think of them as the recipe book for understanding how random variables behave.
Discrete Random Variables: The Cookie Cutters
So, you know how every cookie recipe has specific measurements for ingredients? Like, “Add 1 cup of sugar, 2 cups of flour, etc.” That’s kinda like the Probability Mass Function (PMF) for discrete random variables.
The PMF tells you the probability of each specific outcome. For example, let’s say you post a TikTok video. The PMF would give you the probability of getting exactly 10 likes, 20 likes, 30 likes, and so on. It’s like saying, “There’s a 20% chance of getting 10 likes, a 15% chance of getting 20 likes,” etc.
Example 1: Imagine you’re playing a mobile game where you can earn gems . The PMF would tell you the probability of earning 1 gem, 2 gems, 3 gems, etc., in a single game session.
Example 2: Let’s say you’re tracking the number of snaps you receive per day on Snapchat . The PMF would tell you the probability of receiving exactly 5 snaps, 10 snaps, or 15 snaps in a day.
Example 3: Think about your Instagram posts. How many comments do you usually get? The PMF will tell you the probability of getting exactly 5, 10, or 20 comments.
So, the Probability Mass Function (PMF) is your go-to recipe book for understanding discrete random variables. It gives you the exact “measurements” or probabilities for each possible outcome, just like a cookie recipe tells you exactly how much of each ingredient to use.

Each bar in the graph represents the probability of getting a certain number of likes on a TikTok video. Just like different types of cookies in a cookie jar, each bar is a different “flavor” of outcome:
- 5 Likes: 20% chance
- 10 Likes: 15% chance
- 20 Likes: 30% chance
- 30 Likes: 35% chance
So, next time you post a TikTok video, think of your likes as cookies in a jar. Each type of cookie (or number of likes) has its own probability of being picked!
Stay tuned as we dive deeper into the world of probability distributions and explore how they shape our digital experiences!
Continuous Random Variables: The Smoothie Makers
Okay, so we’ve talked about discrete random variables and their Probability Mass Function (PMF), which is like a cookie recipe . Now, let’s get into continuous random variables and their Probability Density Function (PDF). Think of PDF like blending a smoothie.
When you blend a smoothie, you throw in a bunch of ingredients, and they all mix together into a continuous liquid, right? Similarly, the PDF gives you a smooth curve that shows the probabilities of all possible outcomes within a range. Unlike PMF, where you get the probability of specific, countable outcomes, PDF gives you a range of possibilities.
Example: Let’s say you’re binge-watching Netflix. The PDF would show you the probability density of watching for, say, 0-10 minutes, 11-20 minutes, 21-30 minutes, and so on.

The curve in the graph represents the probability density of spending a certain amount of time on a Netflix binge. Just like how a smoothie blends different ingredients into a continuous liquid, the PDF blends different probabilities into a smooth curve. Imagine this curve as the liquid in your blender, mixing all the probabilities together!
So, the next time you’re sipping on a smoothie or enjoying a Netflix binge, remember that continuous random variables and their PDFs are the smoothie makers of the statistical world. They blend everything into a continuous, flowing experience.
Mixed Random Variables: The MasterChefs
Alright, foodies and stats lovers, gather ’round! Ever watched a cooking show where the chef effortlessly combines different ingredients and cooking techniques to create a masterpiece? That’s what mixed random variables are all about. They’re the MasterChefs of the statistical world, blending both discrete and continuous elements.
Imagine you’re crafting the ultimate YouTube video. You have certain elements that are discrete, like the number of cuts or edits you’ll make. At the same time, you have continuous elements, like the background music that plays smoothly throughout the video.
Example: Let’s say you’re a TikTok creator. The number of videos you post in a week is a discrete random variable (you can’t post 2.5 videos, right?). Meanwhile, the length of each video is a continuous random variable (it could be 15.2 seconds, 30.7 seconds, etc.). When you look at your TikTok performance, both these variables come into play.
Table: The MasterChef’s Guide to PMF and PDF
| Ingredient (Variable) | Cooking Technique (Function) | Example | Best for |
|---|---|---|---|
| Discrete | PMF (Probability Mass Function) | Counting Instagram followers | When outcomes are specific and countable |
| Continuous | PDF (Probability Density Function) | Measuring time spent on Snapchat | When outcomes can be any value in a range |
| Mixed | Both PMF and PDF | Crafting a YouTube video | When you’ve got a mix of specific and range-based outcomes |
So, if you’re a MasterChef in the making or just someone who loves to mix and match, remember that mixed random variables let you have the best of both worlds. They’re like a well-balanced dish, combining the precision of PMF and the smoothness of PDF to create something truly unique.
Stay tuned as we continue to explore the fascinating world of random variables and how they shape our digital lives!
Measuring the Vibe: Expected Value and Variance of Random Variables
Okay, let’s get into the vibe check of statistics: Expectation and Variance!
What’s the Average Vibe?
First up, “Expectation.” Think of it like your Instagram engagement rate. You post pics, and you kinda know the average number of likes and comments you’ll get, right? That’s your “expectation”! It’s like the average vibe or mood you can expect from your posts.
Example: If you usually get around 200 likes on your Instagram posts, then your “expectation” is 200 likes. Simple, huh?
How Wild Can It Get?
Next, let’s talk about “Variance.” This is like the range of your TikTok views. Some videos might go super viral and get a million views, while others might just get a few hundred. Variance measures how spread out or “wild” these outcomes can get.
Example: If one TikTok video gets 100 views and another gets 10,000, the variance is high. It’s like saying, “Hey, anything can happen here!”

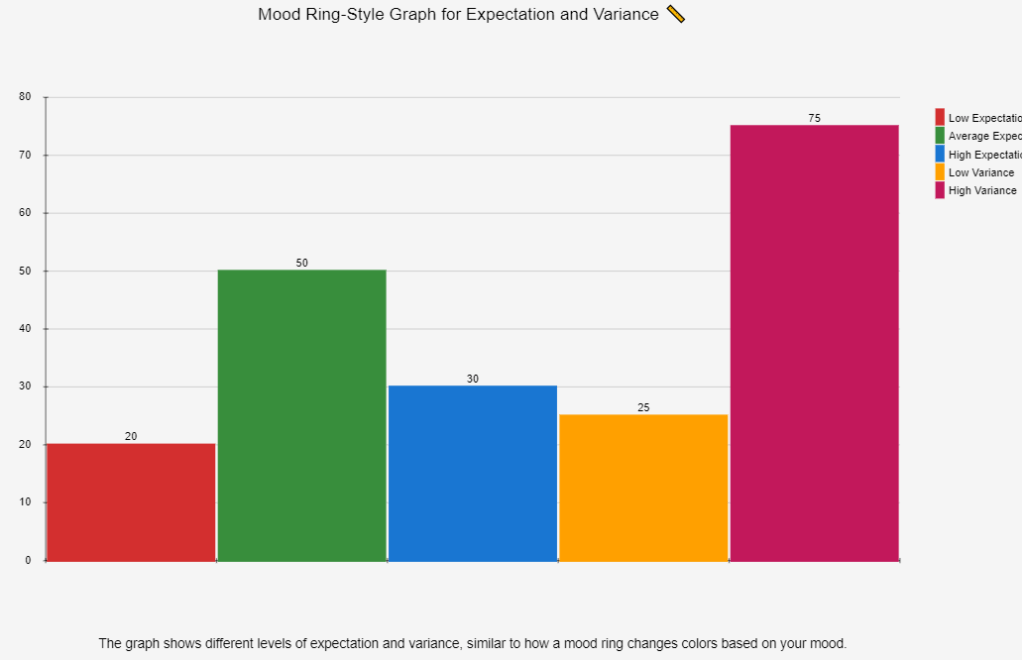
The graph above is like a mood ring for your stats. It shows different levels of expectation and variance:
- Low Expectation: 20% chance
- Average Expectation: 50% chance
- High Expectation: 30% chance
- Low Variance: 25% chance
- High Variance: 75% chance
So, whether you’re tracking your social media performance or just curious about how randomness works, understanding expectation and variance can give you some real insights. It’s all about knowing the vibe and how wild it can get!
Optional: The Brainy Stuff: Advanced Topics
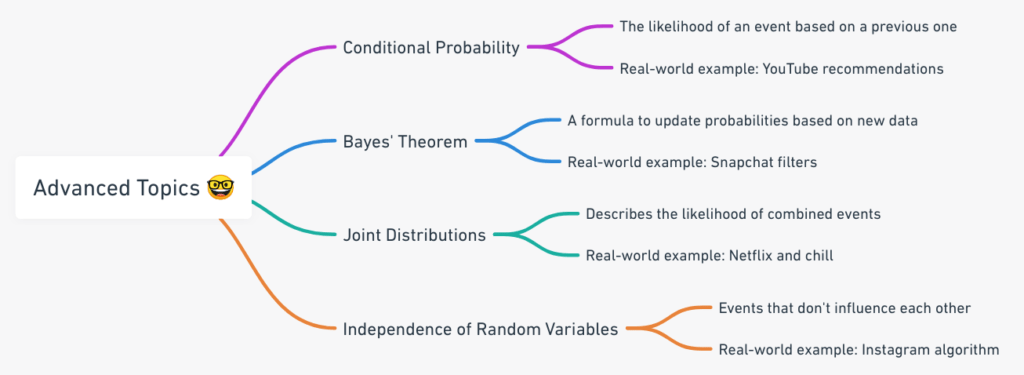
Feeling like a stats wizard and want to go deeper? Let’s get into some of the brainy stuff, like conditional probability and Bayes’ theorem. Don’t worry, we’ll keep it light and relatable!
Conditional Probability
This is like the algorithm behind your YouTube recommendations. Ever noticed how after watching one cat video, YouTube suddenly thinks you’re a cat person and starts recommending more? That’s conditional probability at work!
Bayes’ Theorem
Snapchat filters, anyone? Bayes’ theorem is the math behind those cute or quirky filters that know just where to place bunny ears on your head. It calculates the probability of a filter fitting you perfectly based on past data.
Joint Distributions
Think Netflix and chill, but make it statistical. Joint distributions help Netflix know that if you liked “Stranger Things,” you might also enjoy “The Witcher.” It’s like a matchmaker for your binge-watching habits.
Independence of Random Variables
This is the magic behind your Instagram feed. Instagram uses the concept of independent random variables to make sure your feed is a mix of posts from friends, ads, and celebs, all without repeating the same content.

So, if you’re feeling extra nerdy and want to dive deeper, these advanced topics are like the secret levels in a video game. They’re not necessary to understand the basics, but they sure make everything more interesting!
Real Talk: Why Should You Care?
So you’re probably wondering, “Why should I even bother learning about random variables?” Well, let me tell you, understanding this stuff can seriously level up your game, whether you’re aiming to be a data scientist, a gamer, or even an influencer.
Data Scientist
Optimize Algorithms
In the world of data science, random variables are like the secret ingredients in a recipe. Take Netflix, for example. When you finish watching a series, Netflix immediately suggests what you should watch next. How do they know? It’s all about algorithms that use random variables to analyze your watching habits, preferences, and even the time you usually watch.
These variables help the algorithm predict what you’re likely to enjoy next. So, if you’re a data scientist, you’re basically the chef who’s mixing these ingredients to serve the perfect binge-watching menu.
Data Analysis
Random variables also come into play when you’re sifting through massive amounts of data. Let’s say you’re analyzing YouTube views. The number of views a video gets can be a random variable affected by various factors like upload time, video quality, and viewer demographics. Understanding these variables can help you make sense of the data and even predict future trends.
Gamer
Game Mechanics
If you’re a gamer, you’ve probably encountered loot boxes or random rewards. Ever wonder how these are determined? Random variables! Game developers use them to make the gaming experience unpredictable and exciting. For example, in games like “Fortnite,” the items you find in loot boxes are determined by random variables, making each game a unique experience.
Winning Strategies
Understanding random variables can also help you develop winning strategies. In a game like “Among Us,” the tasks you get or the room you start in are random variables. Knowing how these work can give you an edge in the game. It’s like being able to predict the dealer’s hand in a game of poker.
Influencer
Content Strategy
As an influencer, your content is your currency. Random variables like posting time, hashtags, and even the color scheme can affect how many likes and shares you get. For example, posts uploaded at 7 PM might get more engagement than those uploaded at 2 AM. By understanding these variables, you can tailor your content strategy to maximize engagement.
Engagement Metrics
Understanding random variables can also help you dive into your engagement metrics. For instance, the number of people who swipe up on your Instagram story could be considered a random variable. It can vary based on the time you post, the type of content, and even current trends. By analyzing these variables, you can get a clearer picture of what your audience enjoys and how to keep them engaged.
So, are you convinced yet? Random variables are not just about numbers; they’re the building blocks of strategy, whether you’re a data scientist, a gamer, or an influencer.
Wrap It Up, Folks!
Alright, we’ve been on quite a journey, haven’t we? From Netflix recommendations to gaming loot boxes and Instagram likes, random variables are the behind-the-scenes stars that make our digital world tick.
Quick Recap
- Random Variables: They’re like your playlist on shuffle—sometimes predictable, sometimes a total surprise!
- Types: We’ve got discrete ones (think Instagram likes ) and continuous ones (like streaming music ), and even some that mix it up!
- Probability Distributions: These are the rulebooks that random variables follow. Think of them as recipes for cookies or smoothies .
- Real-world Applications: Whether you’re a data scientist, a gamer, or an influencer, understanding random variables can be your secret weapon.
TL;DR Table
| Topic | What’s It About? | Why Should You Care? |
|---|---|---|
| Random Variables | Your digital life’s playlist on shuffle | They’re the secret sauce in algorithms |
| Types of Random Variables | Discrete, Continuous, Mixed | Helps you understand data and make predictions |
| Probability Distributions | Rulebooks for random variables | Essential for data analysis and strategy |
| Real-world Applications | Data Science, Gaming, Influencing | Makes you awesome at what you do |
So, that’s a wrap! Hope you had as much fun learning about random variables as we did explaining them. Trust us, this stuff is more than just numbers; it’s the key to understanding our unpredictable, exciting digital world.
Wanna Learn More?
So you’re hooked and want to dive deeper into the world of stats and data? Awesome! If you’re keen on mastering business analytics lingo, check out this guide on essential data terminology for business analytics. And hey, if you’re curious about how to make sense of data trends, you’ll love this step-by-step tutorial on how to calculate simple linear regression and residuals by hand. There’s also a neat guide on Pearson correlation coefficient and understanding what residuals are in statistics.
But wait, there’s more! If you’re a software geek , you can learn how to create and interpret descriptive statistics in R or even calculate the coefficient of variation in R language. Python enthusiasts, we’ve got you covered too! Learn how to create and interpret a histogram in Python or even create a boxplot. And if you’re up for a challenge, why not tackle your first project in data analysis using Python? Happy learning!


