
Essential Data Terminology for Business Analytics 2025

Hey there, welcome to Statssy! We’re thrilled to have you here, especially if you’re just starting out in the fascinating world of data analytics and business intelligence.
Why You Should Stick Around
If you’ve ever felt overwhelmed by terms like “data-driven decision-making,” “business analytics,” or “data visualization,” you’re not alone. We get it; the jargon can be intimidating. But here’s the thing: understanding these terms is more than just learning a new language. It’s about gaining the skills to make smarter business decisions and, let’s be real, to thrive in today’s competitive landscape.
Did You Know?
- Companies that are data-driven are 23 times more likely to acquire customers.
- A whopping 62% of retailers say that data analytics gives them a competitive edge.
- More than half of the companies surveyed said that data analytics led to faster and more effective decision-making.
Job Opportunities Are Booming
If you’re worried about job prospects, don’t be. The field has seen a 16% growth in jobs since 2013. In India alone, there are 97,000 data analytics job openings, with cities like Bengaluru and Delhi leading the way.
Challenges? We’ve Got You Covered
Entering a new field comes with its own set of challenges. From managing project deadlines to selecting the right analytics tool, we understand the hurdles you might face. That’s why we’re here to guide you every step of the way.
Why Trust Us?
We’ve trained over 1,500 students for roles like Data Analyst, Supply Chain Analyst, and Marketing Analysts. So, you’re in good hands.
So, are you ready to decode the essential data terminology for business analytics? Let’s dive in! 🌊
Decoding Data
Hey, ever wondered how Netflix knows exactly which shows to recommend or how Amazon seems to read your mind with product suggestions? Well, it’s all about data, my friend! But not all data is created equal. Let’s break it down into bite-sized pieces, shall we?
Structured Data
What Is It?
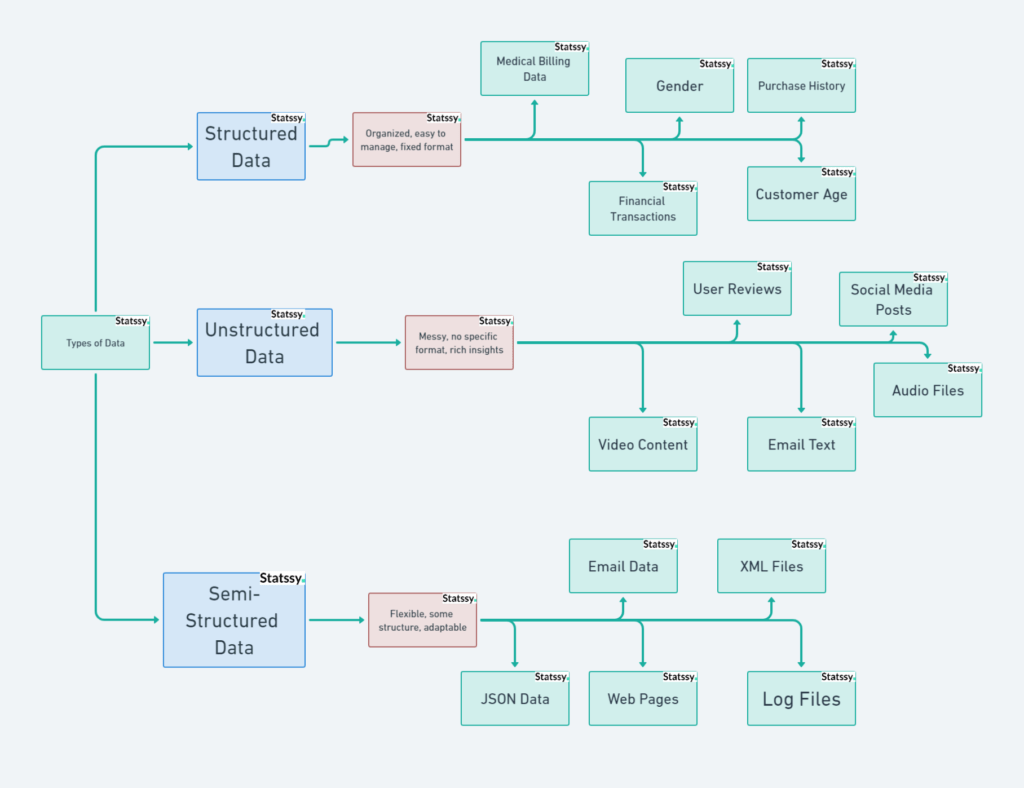
Structured data is like that neat freak friend who has a place for everything. It’s organized, easy to manage, and stored in a fixed format. Think of it like customer age, gender, and purchase history on an e-commerce platform.
Why Should You Care?
While only 20% of the data available to businesses is structured, it’s super important for quick and accurate decision-making. For example, healthcare businesses use structured data for patient forms and medical billing, while banking businesses use it for customer account data and transactions.
Key Takeaway: Structured data is your go-to for organized, easy-to-analyze information.
Unstructured Data
What Is It?
Unstructured data is like your junk drawer. It’s messy and doesn’t follow any specific format. Think of user reviews and comments on an e-commerce platform.
Why Should You Care?
Here’s the kicker: 80-90% of all new data being generated is unstructured. And guess what? Up to 90% of it is not even analyzed. But if you can tap into this goldmine, you can get rich insights into customer sentiments.
Key Takeaway: Unstructured data is a treasure trove of nuanced information, but you’ll need special tools to unlock its potential.
Semi-Structured Data
What Is It?
Semi-structured data is like your closet that’s half-organized, half-messy. It’s got some structure but also has room for flexibility. Email data is a classic example.
Why Should You Care?
Semi-structured data offers the best of both worlds. It’s flexible and adaptable, making it super useful for businesses that want to gain insights into their customer base.
Key Takeaway: Semi-structured data is your middle ground, offering both structure and flexibility.
To give you a comprehensive view, I have made a mind map for quick review
So, What’s the Big Deal?
Understanding these different types of data can help you make sense of the world around you. Whether you’re a business owner, a data enthusiast, or just curious, knowing your data types can be a game-changer.
Stay Tuned: Up next, we’re exploring the universe of databases. Got questions? Hit us up; we’re all ears!
The Database Universe
Navigating the world of data wouldn’t be possible without the proper tools, and in this case, those tools are databases. Think of databases as the treasure chests that store all the valuable data that organizations collect.
Relational Database
A relational database is a type of database that stores data in tables, and these tables are interconnected based on relations defined between them. For example, consider a school’s database that stores student data. Different tables may exist for students, courses, and grades, each with unique data but interconnected through shared attributes like student ID. This makes it easier to run queries and retrieve complex sets of data.
Key Takeaway: A relational database organizes data into interconnected tables, making it easier to manage complex data sets.
According to a survey by Progress Software, 55% of business and IT professionals said they or their customers were using SQL databases. Companies in the top third of their industry in the use of data-driven decision-making were, on average, 5% more productive and 6% more profitable than their competitors.
Non-Relational Database
Alternatively, a non-relational database, often referred to as NoSQL, is used for data that doesn’t fit neatly into tables. A prime example is a social media platform’s database that stores diverse user-generated data such as posts, likes, and comments. This kind of database is ideal for handling large volumes of rapidly changing, unstructured data.
Key Takeaway: Non-relational databases are ideal for managing large volumes of rapidly changing, unstructured data.
According to TDWI, 80% of enterprise data is now unstructured. The global non-relational databases market is forecast to reach $45.4 billion by 2026.
Table 1: Types of Databases
| Database Type | Key Features | Use Cases |
|---|---|---|
| Relational Database | – Stores data in tables – Interconnected through relations | – Customer Records – Inventory |
| Non-Relational | – Handles unstructured data – Rapidly changing data | – Social Media Posts – Sensor Data |
Data Tables and Data Frames
Within these databases, we encounter data tables and data frames. A data table could be a table storing a company’s sales data, while a data frame could be a construct in a data science project holding customer feedback and corresponding metrics.
Examples: Data tables and data frames are widely used in business analytics and data science projects. For example, in predictive analytics, machine learning, or neural networks, data frames and data tables are used to train models and make predictions.
Table 2: Data Tables vs Data Frames
| Data Table | Data Frame | |
|---|---|---|
| What | A table storing structured data | A construct in data science for holding data |
| Use | – Record-keeping – Data Retrieval | – Data Analysis – Data Visualization |
| Type | Structured | Can be Structured, Unstructured, or Semi-Structured |
Converting Data to Information : Data Terminology
Raw data on its own is not very useful. What truly adds value is the ability to transform this data into meaningful information that can be utilized to drive strategic decisions. For instance, a streaming platform might collect massive amounts of raw data on viewer habits, but the real value comes from analyzing this data to understand viewing patterns, popular genres, peak viewing times, and so on.
Key Takeaway: Data becomes valuable when it is processed and transformed into actionable information.
By 2022, 90% of corporate strategies will explicitly mention information as a critical enterprise asset. Data-driven organizations are now 23x more likely to acquire customers, 6x as likely to retain customers, and 19x more likely to be profitable, according to ImpactMyBiz.
Table 3: Converting Data to Information
| Stage | Description | Example |
|---|---|---|
| Raw Data | Unprocessed data collected | – Viewer habits on a streaming platform |
| Data Analysis | Processing and examining the raw data | – Identifying peak viewing times |
| Information | Actionable insights derived from the data analysis | – Recommending personalized content to viewers |
Metrics: Gauging Success
Metrics are quantifiable measures used to track and assess the status of a specific business process. They come in two main types: discrete and continuous.
Discrete Metrics: These can only take on distinct or separate values, like integers. They’re often categories or rankings. For example, the number of products sold in a day is a discrete metric.
Continuous Metrics: These can take on any value within a range. For example, the amount of time needed to complete a task or project is a continuous metric.
Key Takeaway: Metrics provide a data-driven foundation for decision-making, removing guesswork and subjectivity.
Table 4: Types of Metrics
| Metric Type | Characteristics | Examples |
|---|---|---|
| Discrete | – Distinct values – Often categorical | – Number of products sold – Customer visits |
| Continuous | – Any value within a range | – Time spent on a website – Revenue generated |
The Power of Measures: KPIs
Key Performance Indicators (KPIs) are like the heartbeat of a business. Imagine you’re at the doctor’s office. The doctor checks your blood pressure, heart rate, and temperature to see how healthy you are. Similarly, KPIs are measurements that tell you how well a business is doing.
Average Time Spent on a Page for a Digital Magazine
- What is this KPI?: This KPI tells you how long, on average, people are spending on a single page of your digital magazine. The longer they stay, the more likely it is that they find your content interesting!
- Industry Benchmarks: According to a Contentsquare report, the average time spent on a page across all industries is 54 seconds. Klipfolio suggests aiming for at least 60 seconds. So, if you’re running a digital magazine, you might want to aim for that 60-second mark to ensure you’re above average!
- Comparative Data: It’s crucial to track this KPI over time. For example, if you’ve recently started incorporating more interactive elements like quizzes or videos, you might expect the average time spent on a page to increase.
- Case Studies: One case study by Copywriters Now reported a 39% increase in average time spent on a page after tweaking the content. So, never underestimate the power of a good edit!
Monthly Active Users for a New Social Media App
- What is this KPI?: This KPI tells you how many unique users are actively using your app each month. The more, the merrier—and the more successful your app is likely to be!
- Growth Rate Statistics: For example, TikTok had a 100% user growth rate between 2020 and 2022. These are the kind of growth rates you might aspire to.
- Impact of Feature Releases: Tracking feature adoption rates can give you insights into what’s working and what’s not. For example, BeReal saw a 313% surge in growth after a feature update. So, keep those updates coming!
Churn Rate for a Subscription-Based Platform
- What is this KPI?: Churn rate tells you the percentage of customers who stopped using your service during a certain time frame. A high churn rate is a red flag that something might be wrong.
- Industry Averages: For instance, the SaaS industry has a monthly churn rate of 5-7%. If your rate is higher, it’s time to investigate.
- Impact of Customer Retention Strategies: According to Harvard Business School research, a 5% increase in customer retention can increase profits by at least 25%. So, a small change can make a big difference!
Now to give you a better perspective, lets summarize some common KPIs used in business analytics.
Essential Data Terminology for Business Analytics
| KPI Name | What It Measures | Why It’s Important | Good Benchmark |
|---|---|---|---|
| Average Time Spent on a Page | Duration a user stays on a specific webpage | Indicates user engagement and content quality | 52-60 seconds |
| Monthly Active Users (MAU) | Number of unique users active in a month | Shows app popularity and user retention | Varies by industry |
| Churn Rate | Percentage of customers leaving a service within a time frame | Helps in understanding customer satisfaction and indicates if retention strategies are needed | 5-7% for SaaS |
| Conversion Rate | Percentage of users completing a desired action | Measures the effectiveness of marketing campaigns | Varies by industry |
| Return on Investment (ROI) | Efficiency of an investment | Indicates profitability and scalability of a business model | Positive ROI |
| Customer Lifetime Value (CLV) | Total value a customer brings during their entire lifecycle | Helps in understanding how much value a customer brings and how much should be spent on customer acquisition | Varies by industry |
| Net Promoter Score (NPS) | Customer willingness to recommend your product/service | Indicates overall customer satisfaction and loyalty | Score of 70 or above |
| Cost Per Acquisition (CPA) | Cost to acquire a customer | Helps in budgeting and understanding the effectiveness of marketing strategies | Lower the better |
Conclusion
So, we’ve been talking a lot about how data is this superpower that businesses can’t afford to ignore, right? But let’s break it down in a way that’s as easy as pie. Data
Imagine you own a cool retail store. You’ve got all sorts of data coming in. Some of it is neat and tidy, like the sales records from your cash registers—that’s what we call structured data. Then you’ve got the messy stuff, like tweets or Instagram posts about your store—that’s unstructured data. And then there’s the in-between stuff, like emails, which we call semi-structured data.
You store all this info in special places called databases. Think of them as your store’s treasure chests. Some are super organized with little compartments (those are relational databases), and others are like a big ol’ toy box where you can toss anything in (non-relational databases).
Now, you’ve got to make sense of this treasure, right? That’s where data tables and frames come in. Imagine them as your data’s personal stylist, making everything look good and easy to understand.
But here’s the kicker: you’ve got to know what to look for. That’s where metrics and KPIs (Key Performance Indicators) come in. Metrics are like your store’s daily horoscope—they give you quick insights. KPIs, on the other hand, are like your store’s annual check-up, showing you the big picture.
So why should you care about all this jargon? Well, understanding these terms is like getting the cheat codes to a video game. You’ll know exactly what moves to make to level up your business.
Key Takeaway: Mastering this data lingo isn’t just for show; it’s your ticket to turning everyday numbers into epic wins.
Feeling pumped and want to dive deeper? You’re in luck! We’ve got some killer courses over at Statssy that’ll turn you into a data superhero in no time. Trust me, you won’t want to miss out!