
10+
Years Of Experience
1500+
Projects Delivered
3000+
Students Taught
20+
Training Sessions Taken
20+
Happy Clients
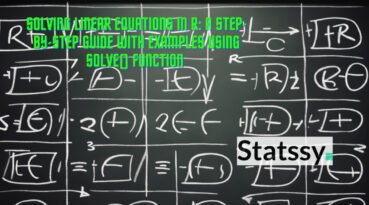
Solving Linear Equations in R: A Complete...
Solving linear equations is a crucial skill in many fields including engineering and finance to data analysis and machine learning....
Interactive Reporting: R Consulting with Markdown &...
Key Takeaways Feature Description What is Interactive Reporting? A method allowing data to be analyzed and reports configured in real-time....
Machine Learning with R: Power Your Business...
Key Takeaways Description Rise of ML in Business Machine learning is revolutionizing business analytics, and R is a prime tool...

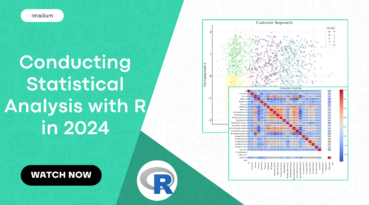
Conducting Statistical Analysis with R
We at Statssy believe in empowering businesses through data. Here’s how we guide you in using R for comprehensive statistical...
How to create and interpret the boxplot...
What is a Boxplot A boxplot is a graphical representation used to identify the distribution of a dataset. Boxplot is...
How to create and interpret descriptive statistics...
Hey there! Welcome to Statssy! Today we will learn how to calculate and interpret descriptive statistics in R. Let us...
How to Calculate Coefficient of Variation in...
Hey there, welcome to Statssy! What is Coefficient of Variation? Ever find yourself drowning in numbers and just wish there...
![How to Calculate Coefficient of Variation in R [With Code + Analysis + Interpretation] 2025](https://statssy.com/wp-content/uploads/2025/05/Coefficient-of-Variation-in-R-369x205.jpg)
How to create and interpret histogram in...
What is a histogram? A histogram is a graphical representation of the distribution of a variable. Distribution means a dataset...
Mastering the Alphabet: A Comprehensive Guide to...
Welcome to the vibrant world of R programming, where one can find hidden gems even in the simplest of features....

Trend Analysis in R using real world...
Introduction Recently I was searching for something interesting in Google trends and suddenly thought why not check how `ggplot` is...

Your First Project in Data Analysis using...
Hey there, aspiring data analysts! Ever wondered how your favourite songs of 2023 are performing across various platforms? Or maybe...
Mastering the Use of Dollar Sign ($)...
In the R programming language, the dollar sign ($) operator is a vital tool for data manipulation. R is a...
Process
Get your work done in 3 simple steps

Connect
Tell me what you need. Schedule a quick call or drop a message with your project goals.

Collaborate
We plan and execute. Get timelines, pricing, and strategy tailored to your requirements.

Deliver
Receive polished results. Track progress and receive your completed work, on time.