
Interactive Reporting in R Consulting with Markdown & Shiny
Key Takeaways
| Feature | Description |
|---|---|
| What is Interactive Reporting? | A method allowing data to be analyzed and reports configured in real-time. |
| R Markdown | An authoring framework for creating dynamic reports using R code. |
| Shiny | A package in R enabling the creation of interactive web apps for better report interaction. |
| Data Visualization | Using ggplot2 within R Markdown to create engaging graphics for the reports. |
| Publishing Reports | Various ways to share and publish R Markdown documents and Shiny apps. |
Introduction to Interactive Reporting
We at Statssy understand the essential role of interactive reporting in today’s data-driven world. Interactive reporting enables us and our clients to explore data and tailor reports in real-time, enhancing the decision-making process. Here’s why we rely on R, a versatile statistical tool, to make that happen.
Understanding R Markdown
R Markdown is more than just writing – it’s an authoring canvas for us to paint our data stories on. This powerful tool combines the simplicity of Markdown with the analytical prowess of R to craft reports that come alive as you interact with them.
Delving into Shiny for Interactive Web Apps
Imagine turning your static reports into an interactive exploration ground. That’s what Shiny does. It’s the secret sauce that turns our R analyses into dynamic web apps, making the insights we provide more actionable.
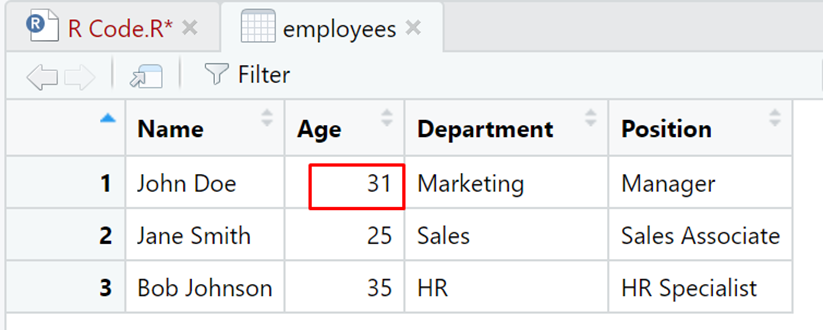
Creating Your First Markdown Document
Let’s walk through the basics of making your first R Markdown report. We’ll cover everything from inserting code chunks to the essential syntax to ensure you’re well on your way to self-sufficiency in report creation.
Incorporating Data Visualizations with ggplot2
A picture is worth a thousand words, especially when it comes to data. With ggplot2, we transform numbers into narratives by embedding stunning visualizations right within our R Markdown reports.
Advanced Shiny Features
For the more ambitious reports, Shiny’s advanced features let us add sophisticated UI elements, offering a more polished and responsive look that aligns with any brand’s identity.Interactive Reporting: R Consulting with Markdown & Shiny
Sharing and Publishing Your Reports
The journey doesn’t end with creation – it’s about sharing those insights. We have numerous avenues to publish and share interactive reports, from simple document formats to web-hosted Shiny apps.

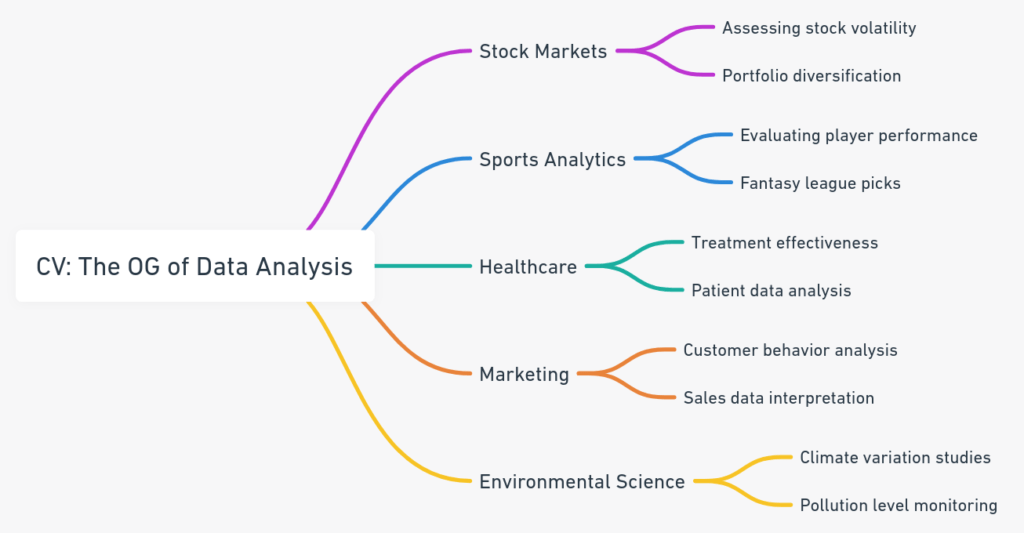
Real-world Applications and Case Studies
Real-world applications offer a glimpse into the transformative power of R Markdown and Shiny in various industries.
Discover how industries are leveraging R for business analytics
Conclusion and Future Directions
Using R with Markdown and Shiny, we’ve provided you with the capabilities for cutting-edge business analytics. The future promises even more interactivity, customization, and insights.
In this journey through interactive reporting with R, Markdown, and Shiny, we’re not just offering a service, but empowering decision-makers with the tools to see beyond the numbers. Welcome to the next level of business analytics consulting with Statssy.