
A Day in the Life of a Data Scientist for Hustlers
Hey, What’s Up Future Data Wizards? Welcome to Statssy!
Ever wondered how data scientists are like the wizards of the tech world?
Hey there, future data wizards! So, you’re curious about what a data scientist does all day, huh? Well, you’re in for a treat! Imagine being the Gandalf or Hermione Granger of the tech world, casting spells (aka algorithms) to unlock the secrets hidden in mountains of data. Sounds epic, right? Let’s jump into this magical journey and decode a day in the life of a data scientist!
What Do Data Scientists Do?: Imagine being a detective, but for numbers!
Okay, so let’s break it down. Imagine you’re a detective, but instead of solving crimes, you’re solving mysteries hidden in numbers, graphs, and spreadsheets. You’re the Sherlock Holmes of data, figuring out patterns and making sense of chaos.
You’ll be doing stuff like:
- Data Cleaning: Think of this as setting the stage before the big show.
- Model Building: This is where you become a fashion designer but for data. You’re creating the “look” that solves the problem.
- Exploratory Analysis: You’re the detective here, looking for clues in the data.
- Meetings: Yep, even wizards have to attend council meetings.
- Documentation: This is your magical book of spells, where you write down everything you’ve done.
Let’s see the range of tasks a data scientist does.
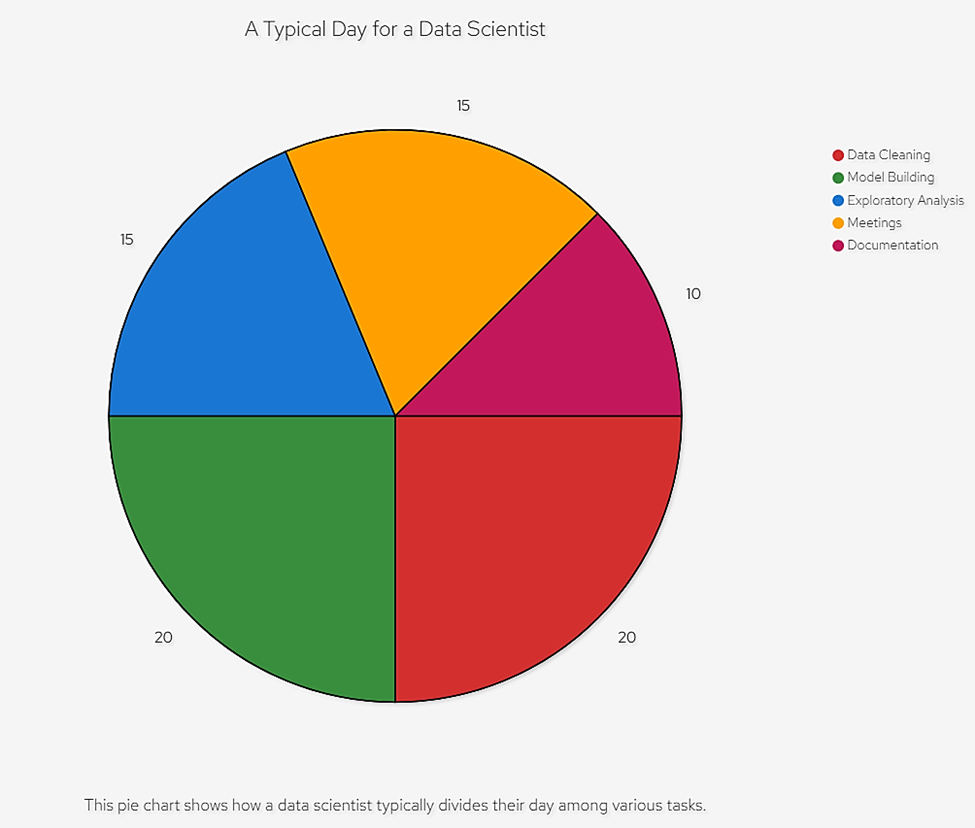
This pie chart is like your Marauder’s Map for a data scientist’s day. It shows you where most of the time goes. As you can see, it’s not all about needing out on numbers; there’s a whole lot of other cool stuff happening!
So, are you excited to dive deeper into this magical world? Trust me; it’s going to be a ride you won’t forget!
Morning Routine: “Rise and Shine, It’s Data Time!”
Morning Emails: Think of it as checking your DMs, but work-style.
Good morning, sunshine! First things first, let’s grab that phone and check those emails. No, it’s not as fun as scrolling through TikTok, but hey, it’s kinda like checking your DMs. You never know what exciting data quests await you! Maybe it’s a message from your boss about a new project, or perhaps it’s an update on that data set you’ve been waiting for.
Dashboard Review: It’s like your morning news but for data.
After you’re done with emails, it’s time to get updated on the data world. Open up those dashboards and see what’s popping. It’s like your morning news but way cooler because it’s all about data! You’ll see how your models are performing, what’s trending, and maybe even spot a few anomalies that need your wizardry.
Team Standup: Quick catch-up with the squad.
Next up, it’s time to huddle with your data fam! A quick standup meeting to catch up on who’s doing what. It’s like when you and your friends plan out your day at a festival. You’ll discuss ongoing projects, any roadblocks, and of course, who’s bringing the snacks for the day.
Coffee & Chill: Because who can start the day without some caffeine?
Alright, you’ve got the lowdown, and you’re all caught up. Now, for the most sacred ritual—coffee time! Whether you’re a latte lover or an espresso enthusiast, this is your moment to chill before diving into the data ocean. Maybe even sneak in a quick game of Among Us with your colleagues.
A flowchart of the ideal morning routine.
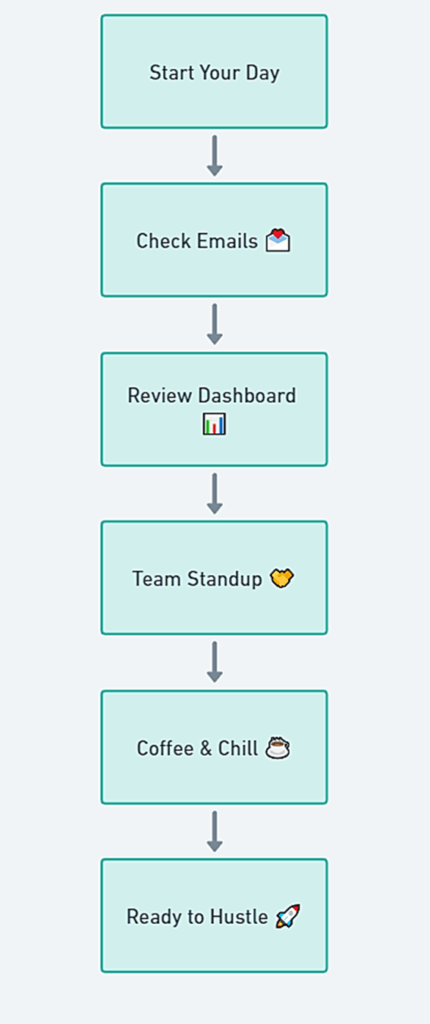
This flowchart is your ultimate guide to kickstarting your day like a data pro! Follow these steps, and you’ll be ready to hustle and make some data magic happen!
So, that’s how you kick off a day in the life of a data scientist! Ready to move on to the next magical chapter?
Data Cleaning: “The Pre-Party Cleanup”
SQL Magic: Think of SQL as the Google search for databases.
Alright, fam, let’s get this data party started! But wait, before we can jam to the data beats, we gotta make sure we’ve got the right tunes, right? That’s where SQL comes in. SQL (Structured Query Language) is like the Google search bar but for databases.
Imagine you’re looking for that perfect playlist on Spotify. You wouldn’t just play any random songs; you’d search for the ones that set the mood. Similarly, SQL helps you fetch just the right data you need for your project. You can ask for specific rows, filter out unnecessary info, and even join tables like you’re uniting two soulmate playlists.
Quality Check: Making sure the data isn’t lying to you.
Okay, so you’ve got your data, but can you trust it? Data can be sneaky; it can have missing values, duplicates, or even errors that can mess up your analysis. It’s like when you find a playlist but realize halfway that some of the songs are just not fitting the vibe.
So, what do you do? You perform a quality check! Go through the data, look for any inconsistencies, and clean them up. It’s like skipping the songs that don’t fit and adding the ones that make the playlist perfect.
Transform & Normalize: Making the data ready for the big show.
You’ve got your playlist, and you’ve made sure all the songs are bangers. Now it’s time to set the equalizer and get the sound just right. In data terms, this is called transforming and normalizing. You adjust the data so that it’s easier to work with and more meaningful for your analysis.
For example, if you have data in different currencies, you’d convert them all to a single currency. Or if you have ages ranging from 1 to 100, you might categorize them into age groups. It’s all about making the data ready for the big show!
Documentation: It’s like taking notes in class, but way more important.
You’ve picked your songs, set the equalizer, and now you’re ready to party. But wait, what if you want to share this epic playlist with your friends? You’d probably jot down the names of the songs or make a shareable playlist link, right?
Similarly, in data science, you document everything you’ve done so far. It’s like your recipe for the magic potion you’re about to brew. You write down the SQL queries you used, the cleaning steps you took, and the transformations you made. This way, anyone (or future you) can recreate your magic!
Table comparing good and bad data.
| Feature | Good Data | Bad Data |
| Completeness | No missing values | Missing or null values |
| Consistency | Uniform formats | Mixed formats |
| Accuracy | Data matches real-world scenario | Incorrect or false data |
| Timeliness | Recently updated | Outdated |
| Relevance | Pertinent to the analysis | Irrelevant or off-topic |
| Uniqueness | No duplicate records | Duplicate or redundant data |
| Integrity | Relationships between data are maintained | Broken links between data |
| Granularity | Data is at the right level of detail | Too vague or too detailed |
This table is your ultimate cheat sheet for distinguishing between the good and bad data. Keep this handy, and you’ll be a data cleaning pro in no time!
So, that’s your guide to the pre-party cleanup! Ready to move on to the actual party, aka data analysis? Let’s go!
Exploratory Data Analysis: “Becoming a Data Detective”
Stats & Correlations: Finding out which data points are BFFs.
Alright, the stage is set, and it’s time to dive into the real action! Welcome to the world of Exploratory Data Analysis (EDA), where you turn into a data detective. Your mission, should you choose to accept it, is to find out which data points are BFFs and which ones are just not vibing together.
Think of your data set as a high school cafeteria. You’ve got the jocks, the nerds, the artists, and so on. Now, you want to find out who hangs out with whom, who’s dating, and who’s frenemies. That’s what stats and correlations are all about! You’ll use statistical measures like mean, median, and standard deviation to get a feel for the data. Then, you’ll use correlation coefficients to see how different variables (or students, in our analogy) relate to each other.
For example, let’s say you’re looking at a data set about video game sales. You might find that games with higher advertising budgets tend to have higher sales. Bingo! You’ve found a correlation!
Feature Engineering: Creating new data attributes like a pro.
So, you’ve got the lay of the land, but what if you want to dig deeper? That’s where feature engineering comes in. Imagine you’re a chef, and you’ve got your basic ingredients like salt, pepper, and garlic. But to make your dish truly stand out, you’ll add some secret spices and maybe even a dash of truffle oil.
In the same way, feature engineering is about adding those “secret spices” to your data to make your analysis even more insightful. You might create new variables based on existing ones, like calculating the average spending per customer or creating a “health score” for a video game character based on multiple attributes.
This is your chance to get creative and think outside the box. The better your features, the more accurate and insightful your final model will be.
Visual: A table of common statistical measures.
| Statistical Measure | What It Tells You | Example Use Case |
| Mean | Average value of the data set | Average age of gamers |
| Median | Middle value when data is sorted | Median income of a neighborhood |
| Mode | Most frequently occurring value | Most played video game |
| Standard Deviation | How spread out the data is | Variability in game scores |
| Variance | Square of the standard deviation | Variability in customer reviews |
| Correlation Coefficient | Relationship between two variables | Correlation between ad budget and sales |
| Percentiles | Divides data into 100 equal parts | Top 10% of gamers by score |
| Skewness | Measure of data asymmetry | Skewness in product prices |
| Kurtosis | Measure of data “tailedness” | Kurtosis in weather patterns |
This table is your ultimate guide to understanding the common statistical measures you’ll use in EDA. Keep this by your side, and you’ll be solving data mysteries like Sherlock in no time!
So, are you ready to put on your detective hat and start solving some data mysteries? Let’s get to it!
Model Building: “The Data Fashion Show”
Training Models: Teaching your computer to think.
Welcome to the most glamorous part of data science—the Data Fashion Show! Here, we’re not dressing up models; we’re building them! The first step is training your model. Imagine you’re a coach, and your computer is an athlete. You’re going to train it to become the next data Olympian!
You’ll feed your computer a bunch of data and tell it what to look for. It’s like teaching a dog to fetch; you throw the ball (data) and tell the dog (computer) to go get it. Over time, your computer learns to make predictions or decisions based on new data. It’s like teaching your dog new tricks, but way cooler because it’s a computer!
Hyperparameter Tuning: Finding the perfect settings.
So, your model is trained, but how do you know it’s the best it can be? Time for some hyperparameter tuning! Think of this as adjusting the lighting, music, and runway before the fashion show starts. You’re tweaking the settings to make sure your model struts its stuff in the best possible way.
Hyperparameters are like the dials and knobs on a soundboard. You’ll adjust things like learning rate, the number of layers in a neural network, or the depth of a decision tree. The goal is to find the perfect combo that makes your model a superstar!
Into Production: Making your model the star of the app.
The lights are on, the runway is set, and now it’s showtime! Taking your model into production means integrating it into a real-world application. It’s like your model is the star of its own movie or the lead singer of a band.
Whether it’s recommending songs on Spotify, predicting weather, or even helping doctors diagnose diseases, this is where your model becomes a real-world hero.
Monitoring: Keeping an eye on your star model.
Alright, the show’s over, but the work isn’t done. Just like a celebrity has a manager who keeps an eye on their career, your model needs monitoring. You’ll track its performance, see how it’s affecting the user experience, and make sure it’s not throwing any diva tantrums.
If something’s off, you’ll go back to the training or tuning stage, just like a singer goes back to vocal training. It’s a never-ending cycle of stardom!
The model-building process of a Data Scientist
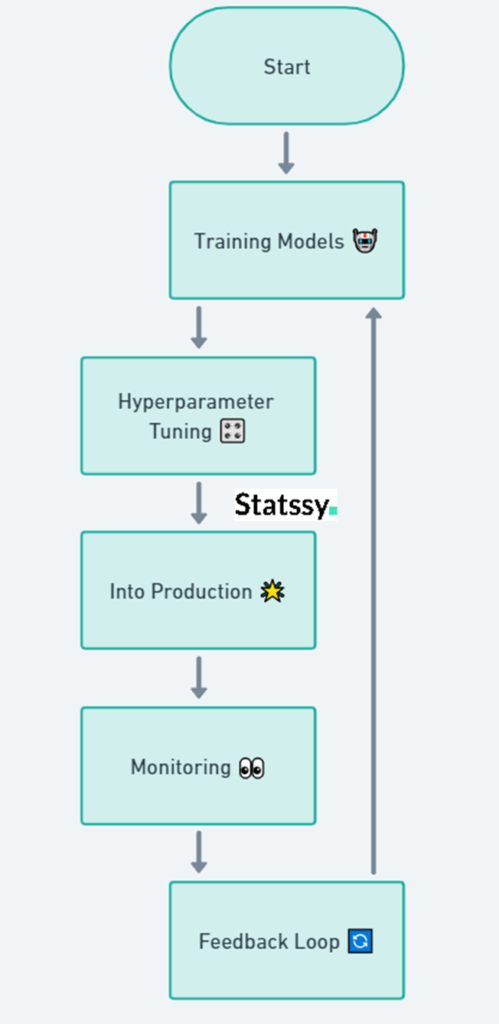
This flowchart is your VIP backstage pass to the model-building process. From training to monitoring, it’s all here! Keep this handy as you work your way through building your own data models.
So, are you ready to turn your data into a runway superstar? Let’s make it happen!
Meetings & Collabs: “Let’s Talk Data, Baby!”
Stakeholder Sync: It’s like explaining your game strategy to your team.
You’ve got your data, you’ve got your models, but now you need to get everyone on the same page. Think of this as a huddle in a video game where you’re laying out the game plan. You’ll meet with stakeholders—those are the people who have a vested interest in what you’re doing, like project managers, business analysts, and even customers.
You’ll break down the data science jargon into bite-sized pieces that everyone can understand. It’s like explaining the rules of a new game to your friends—no one needs to know the nitty-gritty details; they just want to know how to win!
Decision-Maker Presentation: Show and tell but make it corporate.
Alright, now it’s time to take it to the top! You’re going to present your findings to the decision-makers. These are the big bosses, the CEOs, the people who have the final say.
This is your moment to shine, so you better bring your A-game! Think of it as the final round in a game show where you’re showing off all the cool stuff you found. But remember, keep it snappy and to the point; these people are busy. It’s like giving the highlights reel instead of the full game.
Engineer Collab: Working with the techies to make magic happen.
You’ve got the data, you’ve got the plan, but you can’t do it alone. Time to team up with the data engineers, the tech wizards who can turn your data dreams into reality.
Think of this as a co-op mission in a video game. You’ve got the strategy, and they’ve got the technical skills. Together, you’re unstoppable! Whether it’s setting up databases, optimizing queries, or deploying models, these are your go-to peeps.
Brainstorming: Throwing around ideas like you’re in a rap battle.
Last but not least, it’s time to get those creative juices flowing! You’ll sit down with other data scientists and just throw ideas around. It’s like a freestyle rap battle, but for data.
Maybe you’ve hit a roadblock, or maybe you’re just looking for that next big idea. This is the time to bounce thoughts off each other and come up with something truly groundbreaking.
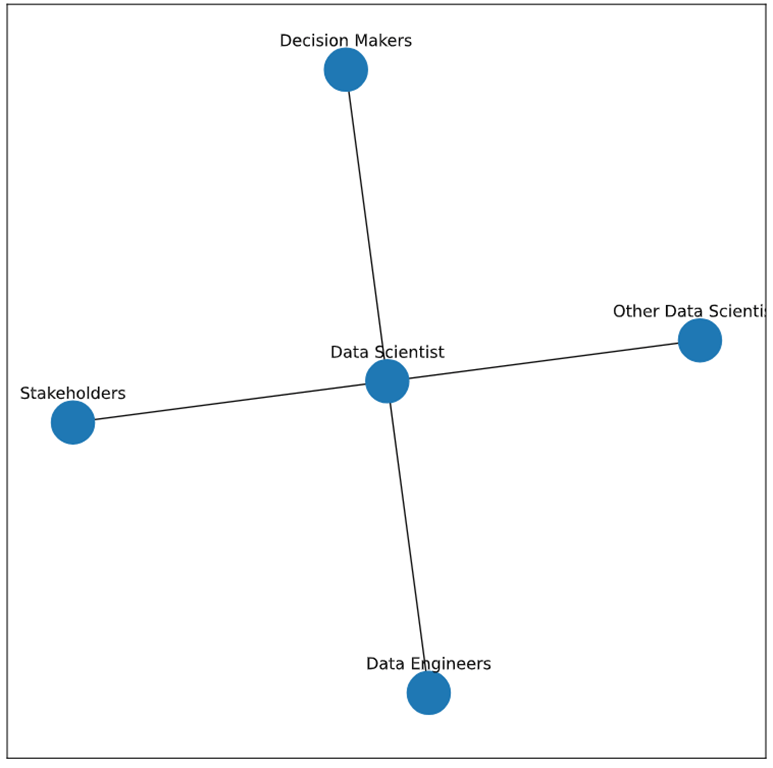
This network diagram shows how the data scientist is the central hub connecting with stakeholders, decision-makers, data engineers, and other data scientists. It’s like being the team captain in a multiplayer game, coordinating with everyone to achieve the ultimate goal.
So, ready to talk data and make some magic happen? Let’s get this collaboration party started!
Documentation & Wrap-Up: “The Afterparty”
Reporting: It’s like writing a diary entry about your day, but for work.
The party’s over, but before you hit the sack, there’s one last thing to do: the afterparty! And in the data science world, the afterparty is all about documentation. Think of it as writing a diary entry about your epic day, but make it work-related.
You’ll jot down what you did, what you found, and any issues you ran into. This isn’t just busywork; it’s crucial for future you and anyone else who might work on this project. Imagine jumping back into a video game after months and having no clue where you left off—that’s what poor documentation feels like.
Next Day Prep: Planning your next adventure.
Okay, you’ve documented today’s work, but what about tomorrow? Time to plan your next data adventure! You’ll prioritize tasks, set goals, and maybe even allocate some time for that cool new project you’ve been dreaming about.
It’s like setting up your inventory and game plan before a big quest in a video game. You want to be ready to hit the ground running!
Skill Up: Learning that new TikTok dance, but make it data science.
You’re never done learning in the world of data science. So, why not allocate some time to skill up? Maybe there’s a new programming language you’ve been wanting to learn, or perhaps you’re curious about the latest trends in machine learning.
Think of it as learning a new TikTok dance; it might not be essential, but it sure is fun and could come in handy someday! 🕺 Plus, staying updated is key to being a top player in the data game.
Long-Term Plans: Dreaming big for the future.
Last but not least, let’s talk about the future. Where do you see yourself in the next few months or years? Managing bigger projects? Leading a team? Creating your own data-driven startup?
Take a moment to dream big and set some long-term goals. It’s like planning your character’s development arc in a long RPG game. Where do you want to go, and what do you need to get there?
A Checklist for Effective Documentation
| Checklist Item | Why It’s Important | Pro Tip |
| Project Overview | Sets the stage for what the project is about | Keep it concise but informative |
| Data Sources | Explains where the data came from | Always include data retrieval dates |
| Methods & Algorithms Used | Details the technical aspects | Use bullet points for clarity |
| Findings & Insights | Highlights the key takeaways | Use visuals like charts or graphs |
| Challenges & Roadblocks | Discusses any issues faced | Be honest; it helps future troubleshooting |
| Next Steps | Outlines what’s coming up | Prioritize based on impact |
| References & Resources | Lists any external sources or tools used | Hyperlink when possible |
| Version History | Keeps track of changes | Include dates and contributors |
This checklist is your ultimate guide to wrapping up your data projects like a pro. Keep it handy, and you’ll be the life of the afterparty—data style!
Conclusion: “So, Ready to Be a Data Wizard?”
A quick flashback of your journey through data science land.
Wow, what a ride, right? We’ve gone through the nitty-gritty of a data scientist’s day, from the morning routine to the afterparty! You’ve seen how they’re part detective, part artist, and full-time wizard. They juggle numbers, create magical models, and even find time to learn new spells (or algorithms, if you will).
So, whether it’s sipping coffee, cleaning data, or building models, a data scientist’s day is never dull. It’s a rollercoaster of coding, problem-solving, and, most importantly, turning data into actionable insights.
Ready to jump in? Here’s how to get started!
Feeling inspired? Ready to don your wizard hat and join the ranks of data scientists? Well, you’re in luck! Becoming a data wizard isn’t a far-off dream; it’s a journey, and every journey starts with a single step.
Maybe you’re a total newbie, or perhaps you’ve dabbled in data before. Either way, there’s a path for you. Start by learning some basic programming, get your hands dirty with some data, and before you know it, you’ll be casting data spells like a pro!
A Roadmap to Becoming a Data Scientist
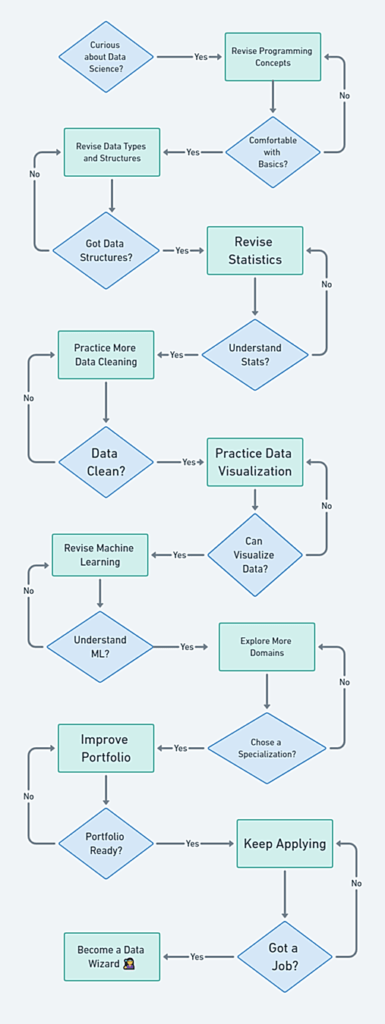
This roadmap is your ultimate guide to becoming a data wizard. From learning basic programming to continuous learning, it’s all here! Keep this roadmap handy as you embark on your data science journey.
So, are you ready to become the next data wizard? Grab your wand (or, you know, your keyboard), and let’s make some magic happen!
If you are interested to learn data science check out our courses which follow step by step process of entire data science workflow.