
Understanding Skewness
Skewness is a measure of the asymmetry of the probability distribution of a real-valued random variable about its mean. The skewness value can be positive or negative, or undefined, leading to three types of distributions:
Table of Contents
- Right-skewed distribution (Positive skewness)
- Left-skewed distribution (Negative skewness)
- Symmetrical distribution (No skewness)
We will focus on the first two types and compare left skewed vs right skewed distributions.
Right Skewed Distribution
A right-skewed distribution, often termed as positively skewed distribution, has a long tail on the right side. It represents an instance where the outliers stretch towards the right. It’s the larger numbers that are more spread out, leading to a ‘right skew’.
The significant characteristics of a right skewed distribution are:
- The mean is greater than the median, and both are larger than the mode: Mean > Median > Mode
- The tail on the right side of the distribution is longer or fatter.
- The mass of the distribution is concentrated on the left of the figure.

What is an example of a right skewed distribution, you might ask? Well, one common example is the distribution of income within a population. In most societies, there are relatively few high earners and a large number of low-to-medium earners, causing the distribution of incomes to be skewed to the right.
Left Skewed Distribution
In contrast, a left skewed distribution, also known as a negatively skewed distribution, has a long tail on the left side. The tail stretches towards the smaller numbers, or ‘left’, due to the presence of outliers in the negative direction.
The left skewed distribution characteristics are:
- The mean is less than the median, and both are smaller than the mode: Mean < Median < Mode
- The tail on the left side of the distribution is longer or fatter.
- The mass of the distribution is concentrated on the right of the figure.

An example of a left skewed distribution in real life could be the age at which people die in developed countries. In such countries, most people live to be older (into their 70s or 80s), but there are a few that die at younger ages (for example, due to accidents or diseases), causing the distribution to be skewed to the left.
Now that we have an understanding of the basics of right and left skewed distributions, we can delve deeper into the more intricate aspects of these distributions.
Understanding Skewness Through Mean, Median, and Mode
To further comprehend the right skewed vs left skewed distribution, let’s examine them through three statistical measures: mean, median, and mode.
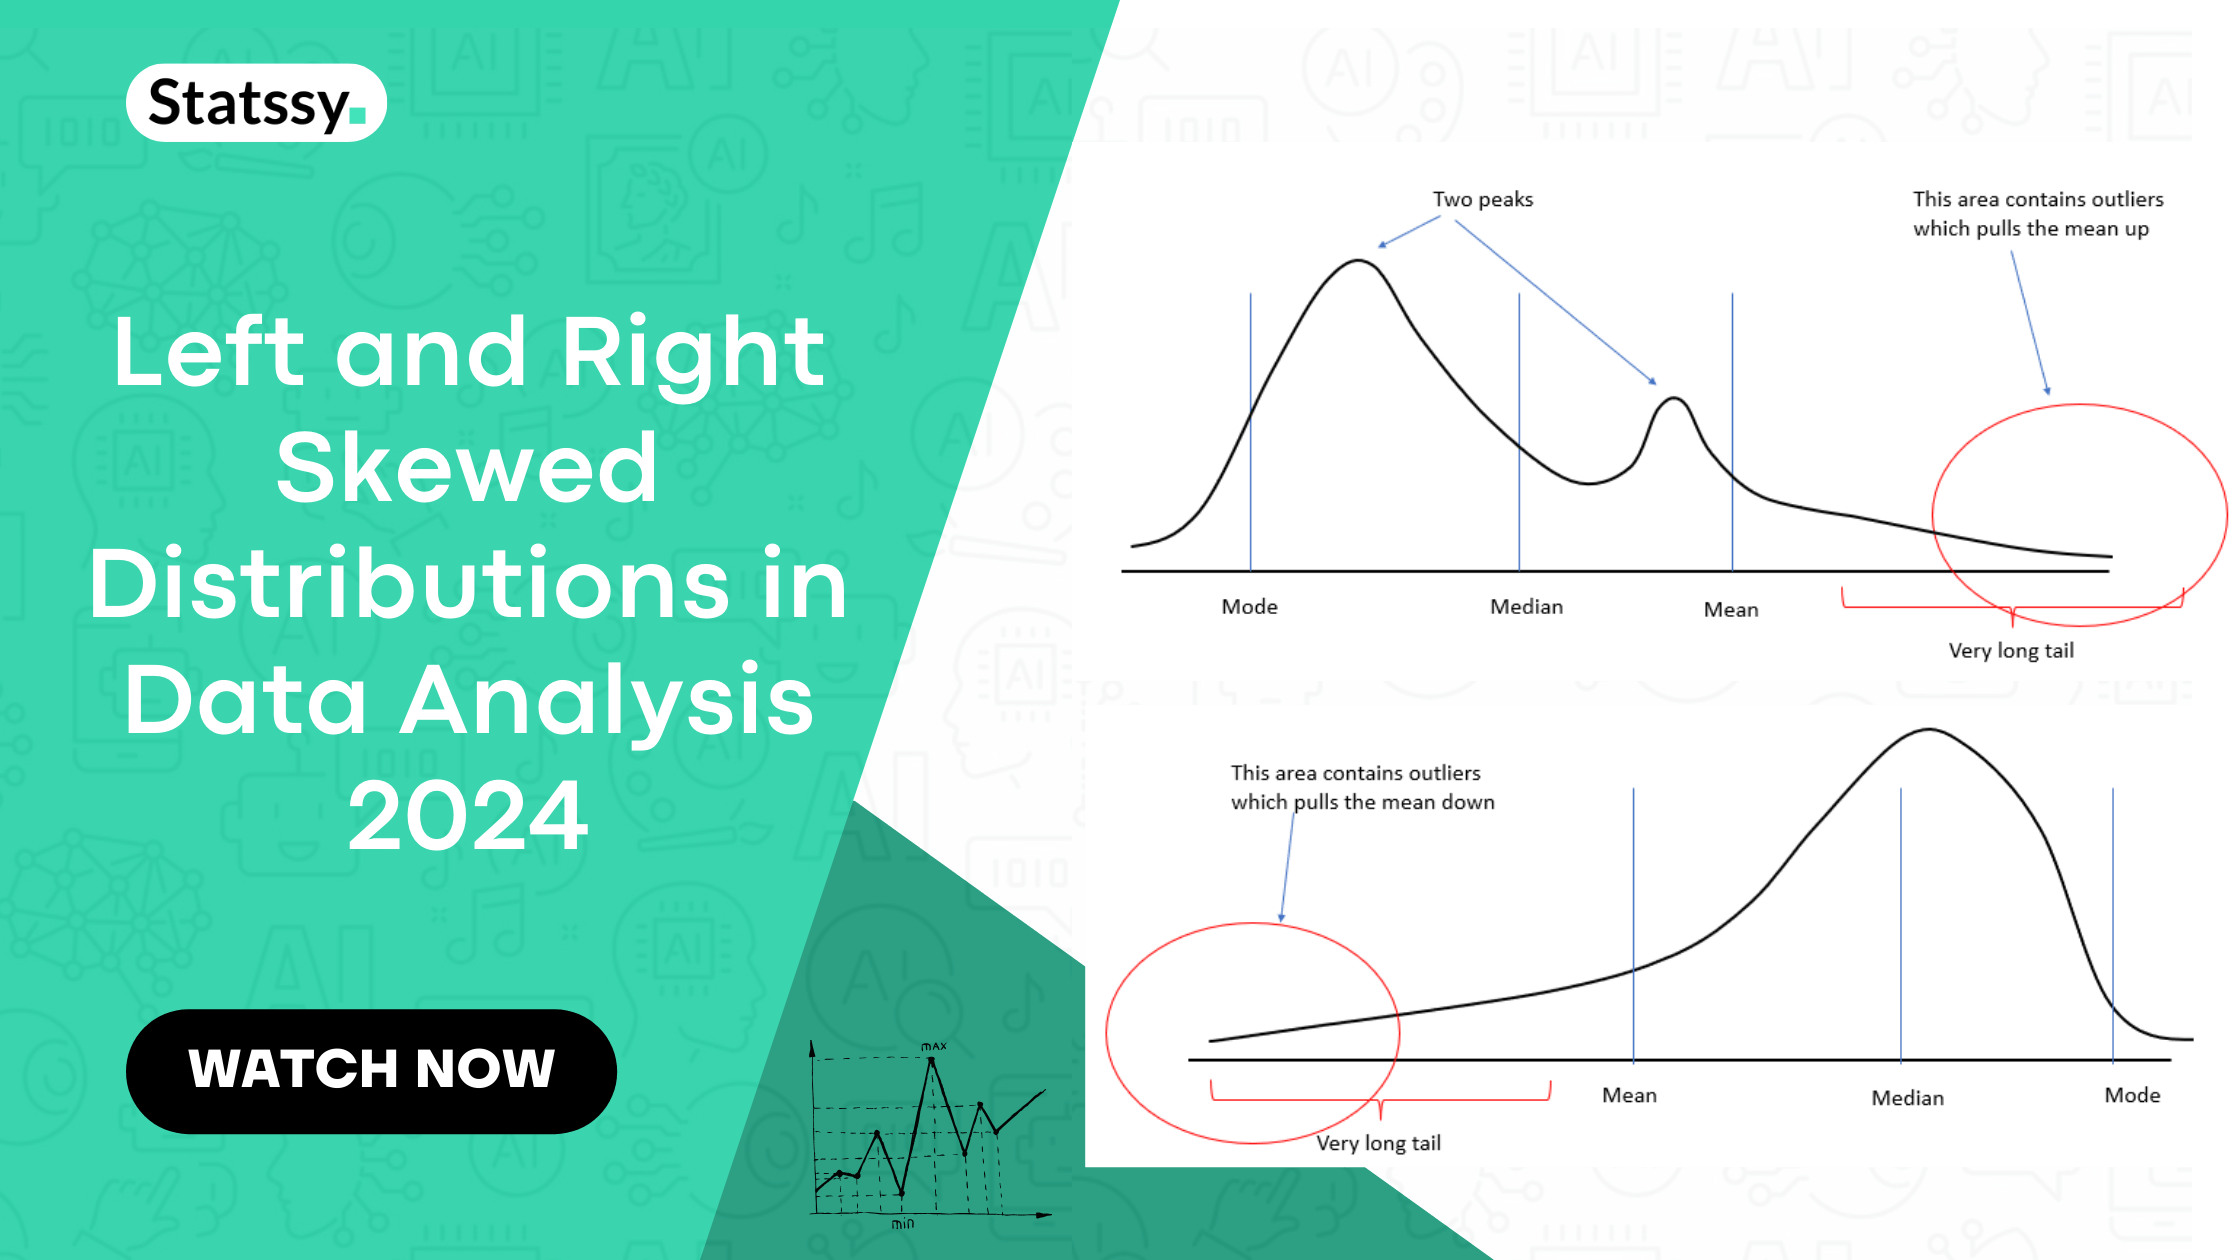
Left and Right Skewed Distributions
Right Skewed Distribution Mean and Median
In a right skewed distribution, the mean is greater than the median. Similar to a left-skewed distribution, this occurs because the mean gets pulled in the direction of the outliers. However, this time, the outliers are on the positive side, hence causing the mean to be greater than the median. This gives us the relationship for a right skewed distribution: Mean > Median.

Consider this real-world example to visualize a right skewed distribution mean and standard deviation. In a class of students, if most students score between 70-80 (the median), but a few score near 100 (outliers), the mean score would shift towards the higher values, giving a right-skewed distribution.
Understanding these relationships is crucial for any budding data analyst because it can provide insights into the dataset’s characteristics, which can subsequently impact the choice of algorithms or techniques used in the analysis.
Left Skewed Distribution Mean and Median
In a left-skewed distribution, the mean is less than the median. This is because the mean, which takes into account all the values in the data set, gets pulled in the direction of the outliers (which are on the negative side in a left-skewed distribution). On the other hand, the median, which is the middle value, isn’t affected as much. So, in a left skewed distribution of data, you’ll observe this relationship: Mean < Median.

Understanding these relationships is crucial for any budding data analyst because it can provide insights into the dataset’s characteristics, which can subsequently impact the choice of algorithms or techniques used in the analysis.
Skewed Right Shape of Distribution
With the right skewed distribution, the shape of distribution takes a distinctive form. The “tail” of the distribution on the right-hand (positive) side is longer than on the left-hand side. The mean and median will be greater than the mode due to the weight of the outlier values pulling the balance of the distribution towards the right.
Skewed Left Shape of Distribution
On the other hand, a left-skewed graph would have a long tail on the left side. The mass of the distribution is on the right, which means most data points are concentrated towards the higher end of the range, with fewer data points in the lower range, causing the left skew. The mean and median of a left skewed distribution will be less than the mode.
Normal Vs Skewed Distribution
A natural question that arises is how a normal distribution compares with these skewed distributions. A normal distribution is symmetrical and is characterized by the mean, median, and mode being at the same point at the center of the distribution.
In contrast, in skewed distributions (whether left skewed or right skewed), the mean, median, and mode all occur at different points. This is due to the presence of outliers that ‘skew’ the distribution either to the left or right.
Let’s move on to discuss some more advanced topics related to skewed distributions.
Advanced Topics: Bimodal and Non-Gaussian Distributions
Right Skewed Bimodal Distribution
Bimodal distributions are unique as they have two peaks. These peaks represent two different groups within the data set. But, can a distribution be both right skewed and bimodal? Absolutely! A right skewed bimodal distribution would have two peaks, with a long tail extending to the right. An example could be a distribution of incomes in a neighborhood with both high-income earners and middle-income earners, with a few ultra-high-income earners skewing the distribution to the right.

Non-Gaussian Right Skewed Distribution
The term “Gaussian” often refers to a distribution that is perfectly symmetrical, like the normal distribution. A right-skewed distribution is non-Gaussian as it lacks this symmetry due to the presence of outliers on the positive side. Hence, a right-skewed distribution is not Gaussian. Understanding this is important because many statistical tests and machine learning algorithms make the assumption of normality, which does not hold in skewed distributions.
Central Tendency of Right Skewed Distribution
In a right skewed distribution, the central tendency or the most representative value is often the median rather than the mean. That’s because in skewed distributions, the mean is affected by outliers, and hence might not represent the ‘typical’ observation. On the other hand, the median, being the middle value, is resistant to outliers, making it a better measure of central tendency in skewed distributions.
Examples in Real Life
We can find examples of skewed distributions all around us. For example, the distribution of people’s ages in a country can be right skewed if there are more young people than old people. Conversely, the distribution could be left skewed if there are more old people than young people.
Understanding skewness and its effects on data analysis is an important skill for any data analyst. As a fresher transitioning into the data analytics field, understanding these concepts can help you make informed decisions and build more accurate models.
To sum it all up, the direction of skewness is determined by the side of the distribution that contains the outliers. A right-skewed distribution has its tail on the right side, while a left-skewed distribution has its tail on the left side.
The mean and median shift according to the skewness, with the mean being pulled more by the outliers. In right-skewed distributions, the mean is larger than the median. In left-skewed distributions, the mean is smaller than the median. This understanding of skewness and distributions forms the foundation for deeper statistical analysis, essential in fields like data analytics.
Now that you have a basic understanding of what skewed distributions are, take a deeper dive into our Statistics Courses to equip yourself with the knowledge needed to interpret and analyze data accurately. Happy learning!
Understanding Left and Right Skewed Distributions in Data Analysis 2024
Some Frequently Asked Questions about Skewness
- What is the simplest way to identify if a distribution is left or right skewed?
You can identify the skewness of a distribution by looking at its shape. If the distribution tail points to the right, it’s right-skewed, and if it points to the left, it’s left-skewed. However, for an exact measure, we often calculate skewness coefficient using specific formulas. - Can you explain why the mean is more affected by outliers than the median in a skewed distribution?
The mean is a measure of central tendency that involves all values in the dataset, including outliers. In contrast, the median, which is another measure of central tendency, is the middle value of a sorted dataset and is less affected by outliers. - How can a bimodal distribution also be right skewed? Can you provide a real-world example?
A bimodal distribution can be right-skewed if one mode is towards the left and the other is towards the right, with the right one having a long tail. An example could be a dataset representing people’s ages at a company that hires a lot of interns and retains experienced staff, resulting in two age peaks but more old-aged staff. - What is the significance of understanding skewness in the field of data analytics?
Understanding skewness is crucial as it impacts various data analytics processes, including data preprocessing, selecting the correct statistical model, and interpreting results accurately. - Are there any strategies to deal with skewed data in machine learning algorithms?
Yes, some common strategies include data transformation (like log transformation), using non-parametric methods that don’t assume a normal distribution, or using algorithms that are less sensitive to skewness. - Why is a right-skewed distribution called non-Gaussian?
A Gaussian distribution, also known as a normal distribution, is symmetric around its mean. However, a right-skewed distribution is asymmetric and has a longer tail on the right, so it’s considered non-Gaussian. - Can you provide an example of a real-world situation where the distribution of data is left skewed?
Yes, consider an exam where the majority of students score highly and only a few score low. The distribution of these scores could be left-skewed, with the tail pointing towards the left of the graph. - Is it possible to transform skewed data into a normal distribution? If yes, how?
Yes, various techniques like log, square root, or cube root transformations can be used to reduce skewness and approximate a normal distribution. - What happens to the standard deviation in a right-skewed distribution?
In a right-skewed distribution, the mean is typically greater than the median, which inflates the standard deviation. This is because the standard deviation is based on the mean, and outliers to the right pull the mean upwards. - How does the concept of skewness relate to the concepts of kurtosis and variance?
Skewness, kurtosis, and variance are all statistical measures that describe different aspects of a distribution. While skewness deals with the symmetry of data, kurtosis describes the “tailedness” or the extreme values in tails, and variance measures the dispersion of data from the mean.


