
Levels of measurement in statistics in 2026
Hey there, Welcome to Statssy!
Ever felt like you’re navigating a maze when dealing with data? Trust us, you’re not alone. But what if we told you there’s a compass that can guide you through this labyrinth? Yep, that’s right! Understanding the types of data and their levels of measurement in statistics is that compass.
What’s on the Menu?
In this article, we’re going to unravel the mystery behind data types and levels of measurement. We’ll dig into what they are, why they’re your best friends in data analysis, and how they can literally make or break your research. So, if you’re ready for an adventure, you’re in the right place!
A Quick Peek into the Business World
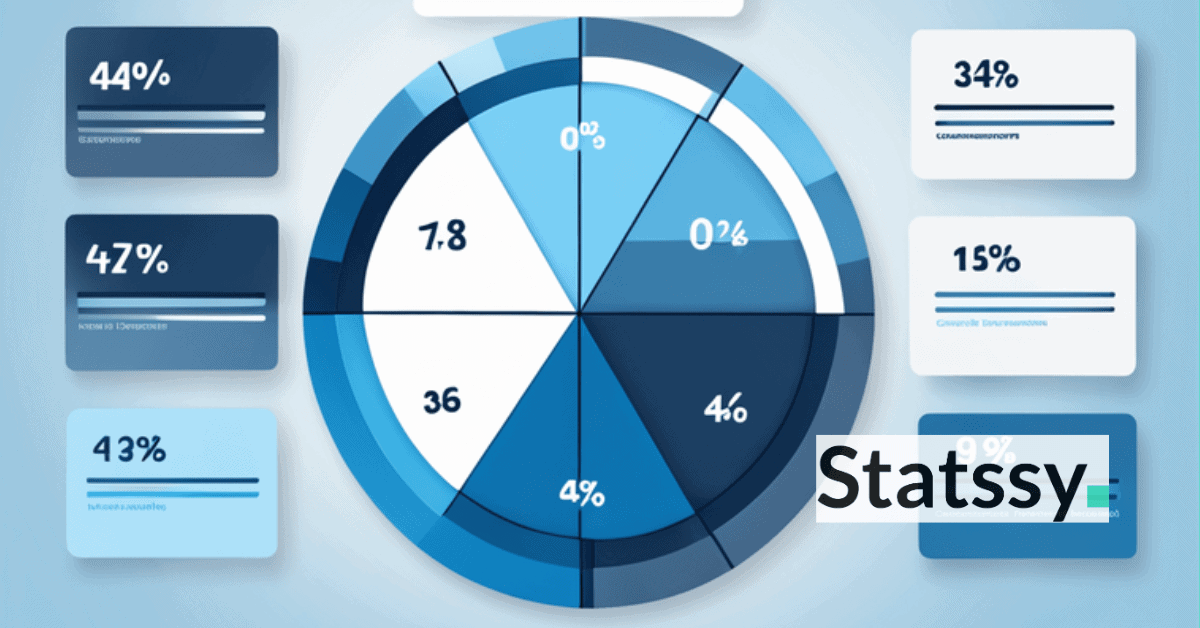
Ever wondered how the big shots in the business world use different levels of measurement in their data? Imagine this pie chart as a delicious pizza . Nominal data is like the cheese, covering 35% of the pizza.
It’s everywhere! Then comes Ordinal data, the pepperoni, taking up 25%. Interval and Ratio data? They’re the veggies and meat, each claiming 20% of your pizza pie.
Why should you care? Well, each slice of this data pizza has its own flavor and rules for munching—err, we mean analyzing.
Ready to dig in and become a data gourmet? Let’s get this party started!
The Essence of Data Collection and Analysis
Hey there, future data gurus! Ready to dive deeper? Let’s talk about the backbone of any research or analysis—the variables and their precision in data collection.
The VIPs: Variables and Precision
Think of variables as the characters in your favorite movie. Each has a role to play, and the story won’t make sense without them. In the same way, variables are the building blocks of your data collection. They can be anything from age, income, to even your preference for pineapple on pizza (controversial, we know! ).
Now, how you measure these variables—whether you ask for an exact age or just a range, for instance—adds layers of precision to your data. And guess what? The more precise your data, the juicier the insights you can squeeze out of it.
The Game-Changer: Levels of Measurement
Choosing the right level of measurement for your variables is like picking the right gear for a hiking trip. Pick the wrong one, and you might find yourself stuck in statistical quicksand! The level of measurement sets the stage for the kind of statistical tests you can run and the insights you can gain.
For example, if you’re measuring income using a nominal scale like “High,” “Medium,” or “Low,” you’re limiting yourself to basic comparisons. But if you use a ratio scale, you can calculate averages, make precise comparisons, and even predict future trends.
The Big Picture: How It All Fits Together
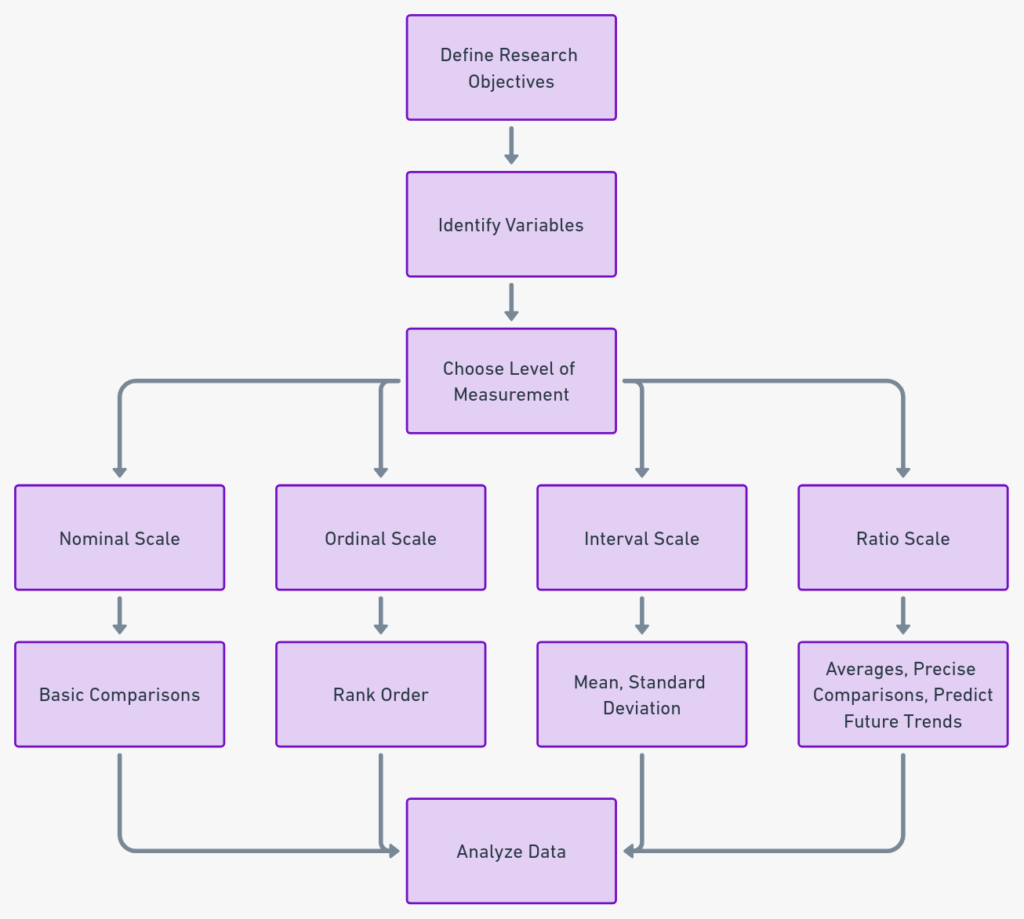
The flowchart above is your roadmap. It starts with defining your research objectives and identifying your variables. Then comes the crucial step of choosing the level of measurement, which, as you can see, directly impacts how you’ll analyze your data later on.
Ready to move on? The next stop on our data journey is understanding why these levels of measurement are so darn important.
Why Understanding Levels of Measurement is Critical
Alright, data aficionados, let’s get into the nitty-gritty! Ever wondered why understanding levels of measurement is such a big deal? Well, it’s like choosing the right lens for your camera.
The lens you pick will determine how clear, detailed, and vibrant your photos will be. Similarly, the level of measurement you choose impacts the depth of insights you can gain from your data.
The Depth of Your Insights: Beyond the Surface
Imagine you’re a detective trying to solve a mystery. The more clues you have, the closer you get to cracking the case. The same goes for data. The level of measurement you choose can either give you a surface-level overview or deep, actionable insights.
For instance, nominal data might tell you that most people prefer online shopping, but ratio data could reveal that they spend 35% more when shopping in-store. See the difference? 🛒
The Sky’s the Limit… Or Is It?
Here’s the kicker: the level of measurement also sets boundaries on the statistical tests you can perform. Nominal and ordinal data are like the training wheels of statistics—you can do some basic stuff, but you won’t be winning the Tour de France.
Interval and ratio data, on the other hand, are your high-performance racing bikes, allowing for more complex analyses like regression, variance, and so much more. Levels of measurement in statistics in 2024
Your Roadmap to Making the Right Choice
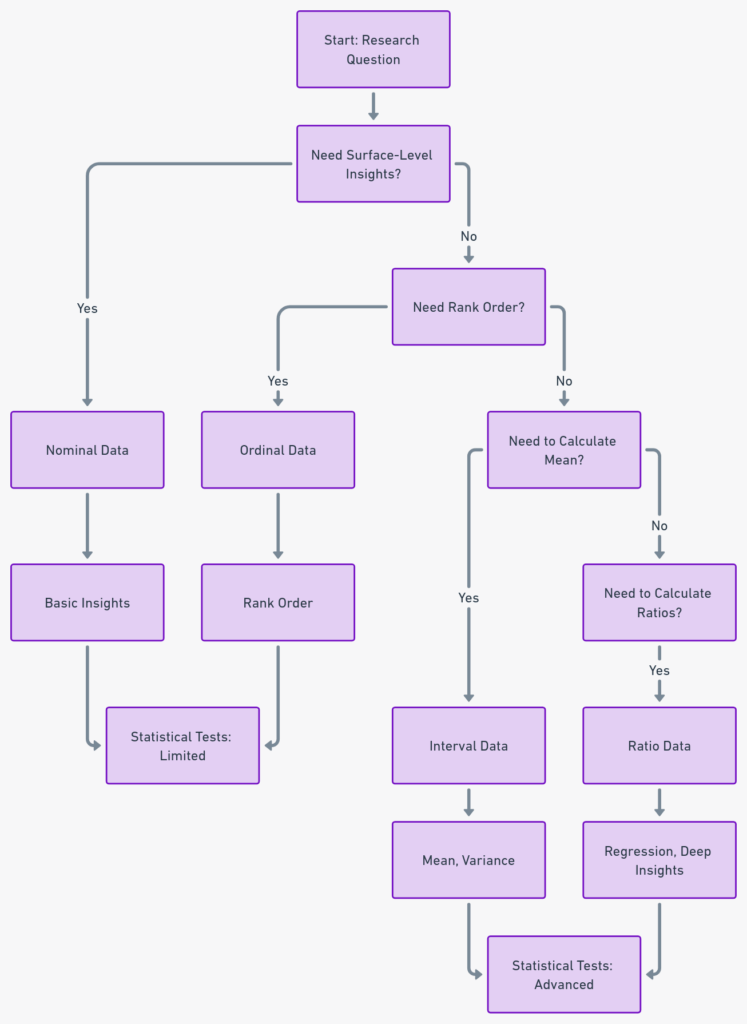
Confused about which level of measurement to choose? The decision tree above is your go-to guide. It starts with your research question and guides you through a series of choices to help you pick the perfect level for your needs.
Types of Data in Statistics
Hey there, data enthusiasts! Ready to dive into the colorful world of statistical data types? Think of this as a paint palette —each color represents a different type of data, and knowing when to use which can turn your analysis into a masterpiece!
The Big Picture: Statistical Data Types
In the realm of statistics, data types are generally divided into two broad categories:
- Quantitative Data: This is all about numbers. It’s like measuring how much water is in a glass—precise and numerical.
- Qualitative Data: This is more about characteristics that can be observed but not measured in numbers. Imagine describing the taste of your favorite ice cream.
The Connection: Levels of Measurement
Now, how do these data types relate to levels of measurement? Great question!
- Quantitative Data usually falls under the Interval or Ratio levels. Why? Because these levels allow for precise, numerical analysis. You can do all sorts of mathematical gymnastics here—like calculating the mean, median, and even standard deviation!
- Qualitative Data, on the other hand, is generally associated with Nominal and Ordinal levels. These levels are more about categorizing and ranking data. You won’t be doing complex calculations here, but you’ll get valuable insights into patterns and trends.
The Handy Guide: Data Types and Levels of Measurement
| Types of Data | Levels of Measurement |
|---|---|
| Quantitative | Interval, Ratio |
| Qualitative | Nominal, Ordinal |
This table is your quick reference guide. It shows how different types of data in statistics correlate with the appropriate levels of measurement. Keep it handy; you’ll use it a lot!
An In-Depth Look at the Four Levels of Measurement
Alright, data wizards, it’s time to roll up those sleeves and dig into the meat and potatoes of our topic—the four levels of measurement!
The Hierarchy and Mathematical Nature
Picture this: The four levels of measurement are like the floors of a shopping mall. The higher you go, the more exclusive and specialized the shops become. Similarly, each level of measurement builds upon the previous one, adding more mathematical capabilities as you ascend.
- Nominal: The ground floor, where you find basic stores. You can categorize and label, but that’s about it.
- Ordinal: The first floor, with a bit more specialization. You can categorize, label, and even rank data.
- Interval: The second floor, where things get fancy. You can do all the above, plus calculate differences between data points.
- Ratio: The penthouse suite of data measurement! You can do everything the other levels can do, plus you get a true zero point, allowing for a full range of mathematical operations.
Comparative Table: The Four Levels Side-by-Side
| Level of Measurement | Characteristics | Mathematical Operations | Examples | Common Uses |
|---|---|---|---|---|
| Nominal | Categorization, Labeling | None | Hair color, Gender | Surveys, Basic Research |
| Ordinal | Categorization, Labeling, Ranking | Median, Mode | Customer satisfaction levels, Education level | Market Research, Social Science Studies |
| Interval | Categorization, Labeling, Ranking, Equal Intervals | Mean, Standard Deviation | Temperature in Fahrenheit, IQ scores | Physical Sciences, Advanced Market Research |
| Ratio | All of the above + True Zero Point | Mean, Standard Deviation, Median, Mode | Height, Weight, Income | Engineering, Medical Research |
This table is your cheat sheet! It gives you a quick rundown of what each level is capable of, the mathematical operations you can perform, and where you’re most likely to use them.
Nominal Level of Measurement
Hey there, data aficionados! Let’s zoom in on the first level of our measurement hierarchy—the Nominal Level. Think of it as the “name-tag” level, where we’re all about labeling and categorizing.
What is the Nominal Level?
The Nominal Level is the most basic level of measurement. It’s all about categorizing and labeling data without any concern for order or hierarchy. Imagine you’re sorting fruits into different baskets based on their type—apples go here, oranges go there, and so on.
Characteristics and Practical Applications
- Categorization: You can sort data into different categories.
- Labeling: Each category gets a unique label or name.
- No Order: The categories don’t have a specific order or rank.
Where You’ll Use It: Surveys, market research, social science studies—you name it!
Example: Hair Colors
Let’s say you surveyed 100 people to find out their hair color. The results might look something like this:
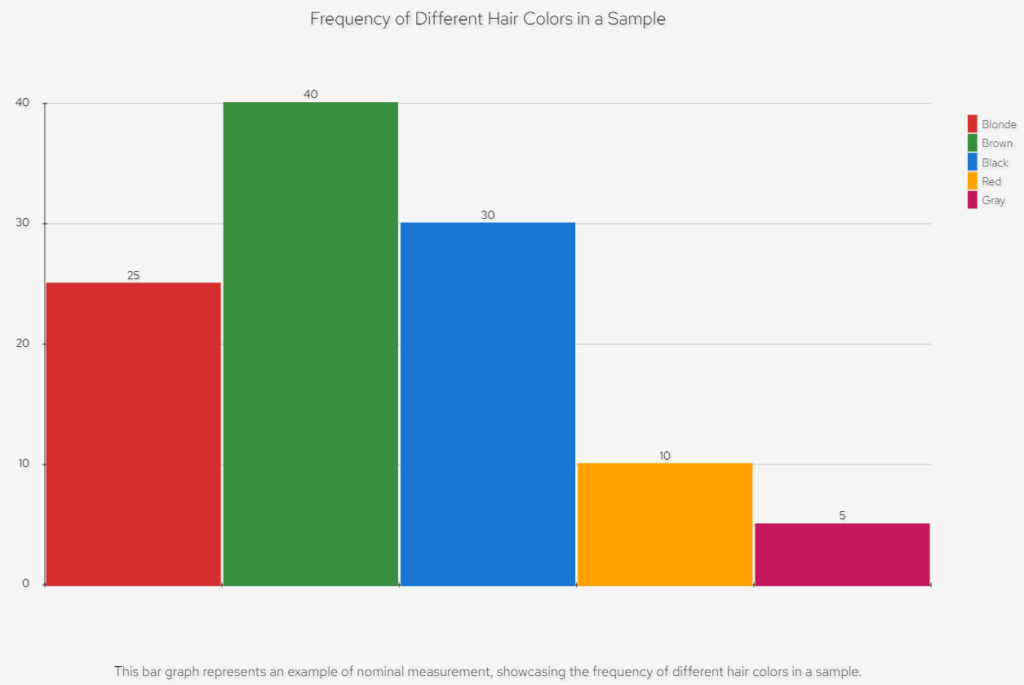
This bar graph represents an example of nominal measurement, showcasing the frequency of different hair colors in a sample.
How to Analyze Nominal Data
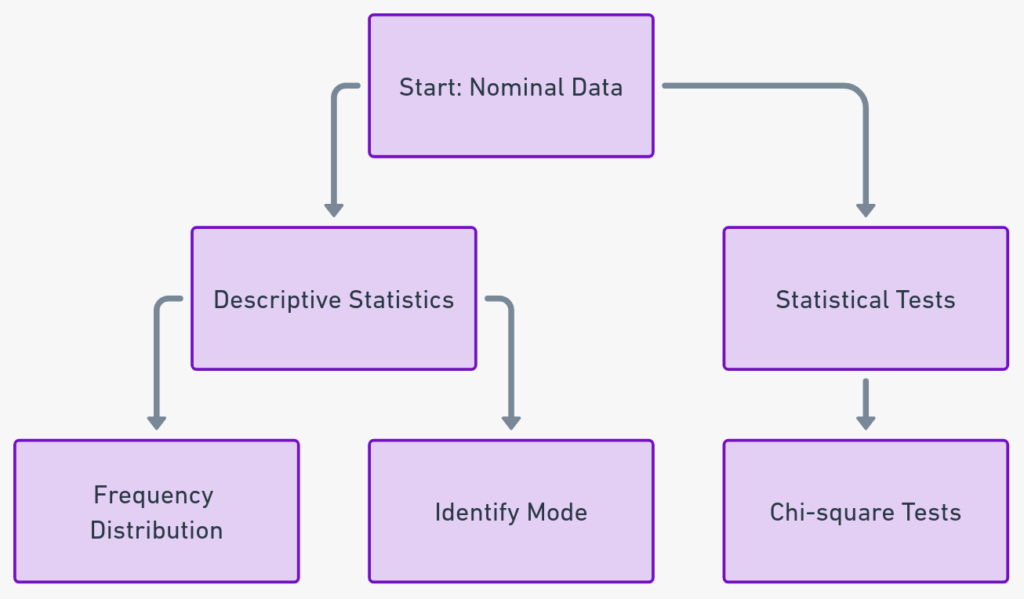
- Descriptive Statistics: The most common way to summarize nominal data is through frequency distribution and identifying the mode (most frequent category).
- Statistical Tests: Chi-square tests are your go-to for analyzing relationships between different nominal variables.
Here’s a flowchart to guide you through the process:
Ordinal Level of Measurement
Hey there, data enthusiasts! Ready to level up? Let’s move on to the Ordinal Level of Measurement. Imagine you’re ranking your favorite movies from best to worst—that’s ordinal data for you!
What is the Ordinal Level?
The Ordinal Level of Measurement is a step above the nominal level. Here, you can not only categorize and label data but also rank it in a specific order. It’s like sorting your playlist from your most to least favorite songs.
Characteristics and Practical Applications
- Categorization: Just like the nominal level, you can sort data into different categories.
- Labeling: Each category gets a unique label or name.
- Ranking: The categories have a specific order or rank.
Where You’ll Use It: Customer satisfaction surveys, educational research, and even in your daily decision-making like choosing a restaurant based on reviews!
Example: Customer Satisfaction Ratings
Let’s say you’ve been tracking customer satisfaction ratings for your business over the last six months. The results could look something like this:
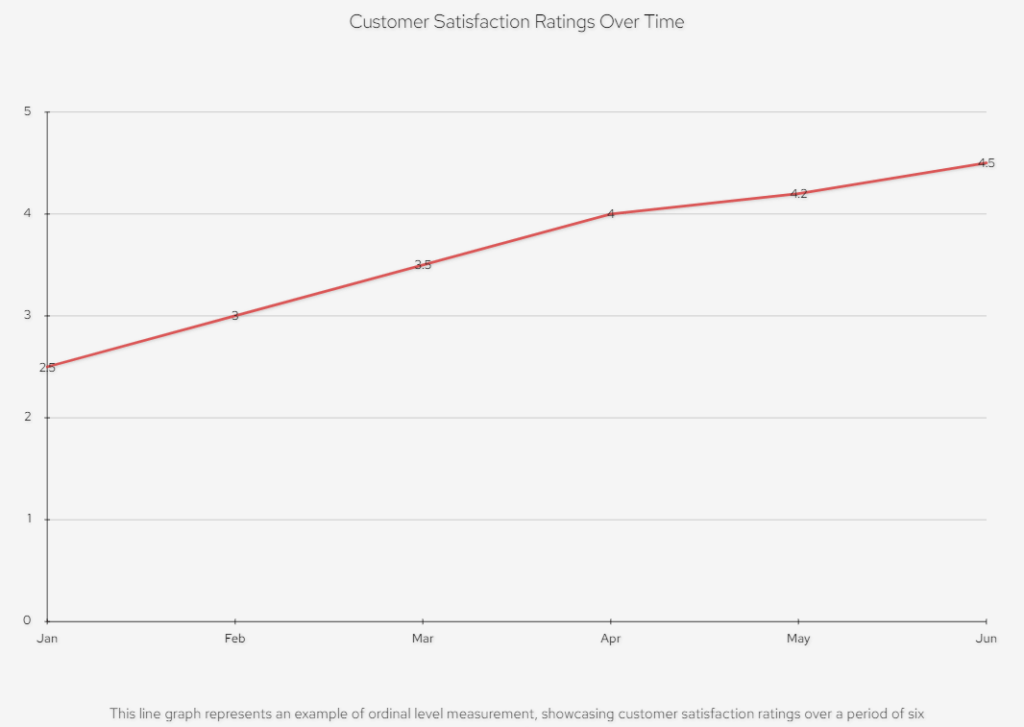
This line graph represents an example of ordinal level measurement, showcasing customer satisfaction ratings over a period of six months.
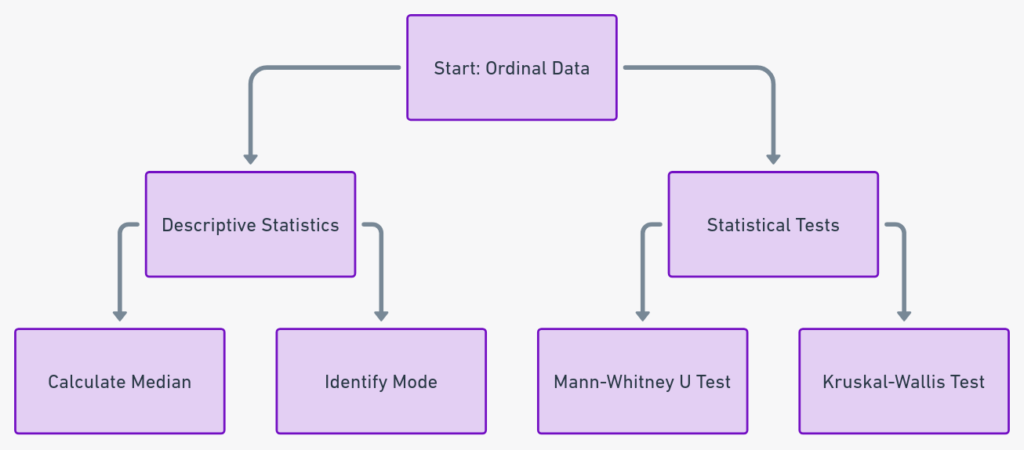
How to Analyze Ordinal Data
- Descriptive Statistics: The median and mode are your best friends here. They help you understand the central tendency of your data.
- Statistical Tests: Non-parametric tests like the Mann-Whitney U test or Kruskal-Wallis test are commonly used for ordinal data.
Here’s a flowchart to guide you through the process:
Interval Level of Measurement
Hey, data aficionados! Ready to heat things up? Let’s dive into the Interval Level of Measurement. Think of it like a thermostat—you can measure the exact difference between temperatures, but zero doesn’t mean “no temperature.”
What is the Interval Level?
The Interval Level of Measurement allows you to not only categorize and rank data but also measure the exact distance between each data point. It’s like knowing the exact difference in scores between two basketball teams at the end of a game.
Characteristics and Practical Applications
- Categorization: Yep, you can still sort data into categories.
- Labeling: Unique labels or names for each category.
- Ranking: Data points can be ranked.
- Equal Intervals: The distance between rankings is uniform and measurable.
Where You’ll Use It: Weather forecasting, IQ tests, and even in measuring customer satisfaction on a more nuanced scale.
Example: Temperature Variations
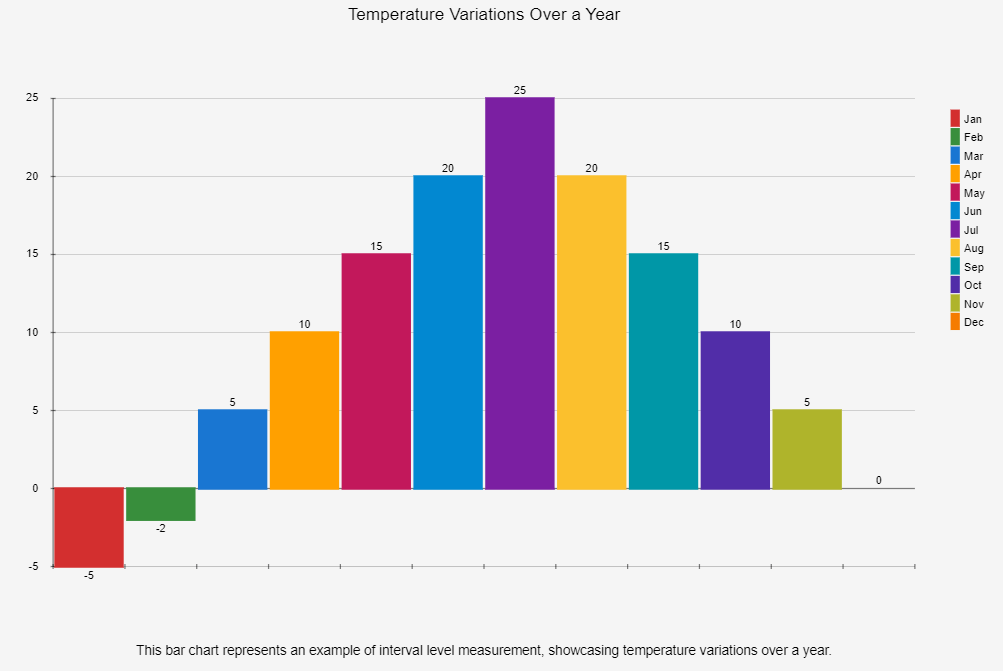
This bar chart represents an example of interval level measurement, showcasing temperature variations over a year. Levels of measurement in statistics in 2024
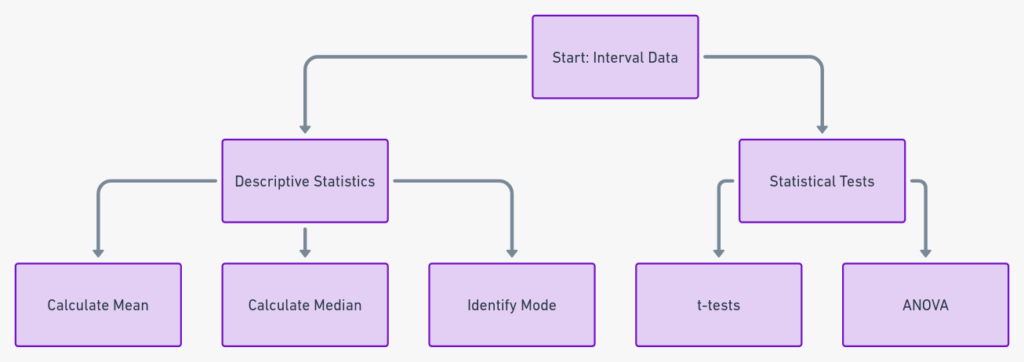
How to Analyze Interval Data
- Descriptive Statistics: You can go all out with mean, median, and mode here.
- Statistical Tests: Parametric tests like t-tests and ANOVA are your go-to options.
Here’s a flowchart to guide you through the process:
Ratio Level of Measurement
Alright, data enthusiasts, we’ve reached the pinnacle—the Ratio Level of Measurement! This is where things get real. Unlike the interval level, the ratio level has a true zero point, meaning zero actually signifies the absence of the attribute being measured.
What is the Ratio Level?
The Ratio Level of Measurement is the most precise among all levels. It allows for a full range of statistical tests and is the only level that allows for meaningful statements about ratios.
Characteristics and Practical Applications
- Categorization: Yes, you can categorize.
- Labeling: Unique labels for each category.
- Ranking: Data points can be ranked.
- Equal Intervals: Uniform distance between rankings.
- True Zero: The presence of a true zero point.
Where You’ll Use It: Income studies, weight measurements, age, and even the speed of a car.
Example: Income Distribution
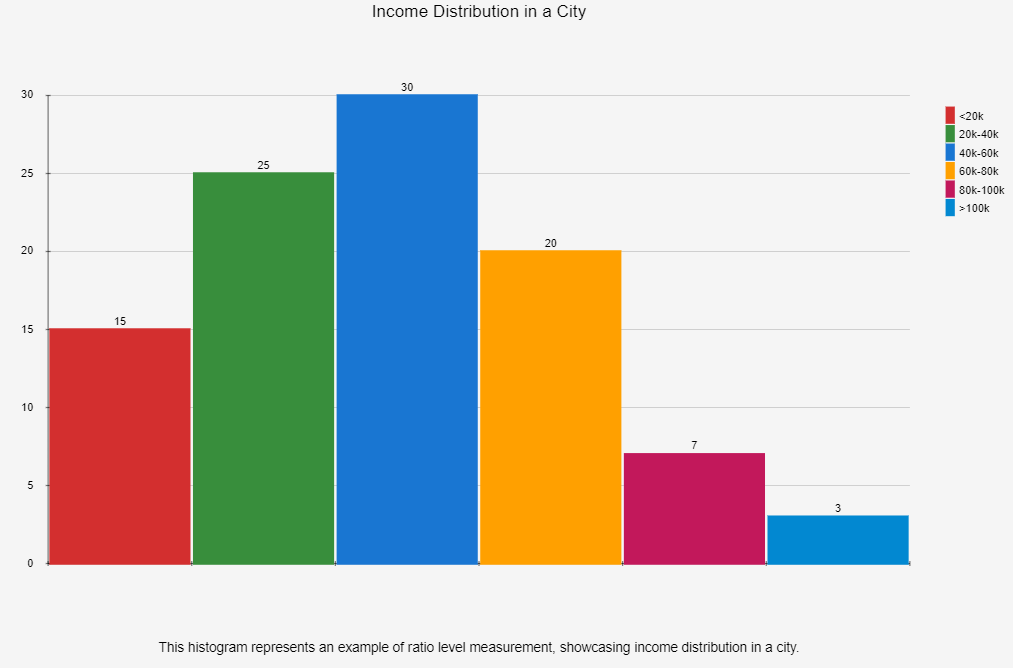
This histogram represents an example of ratio level measurement, showcasing income distribution in a city.
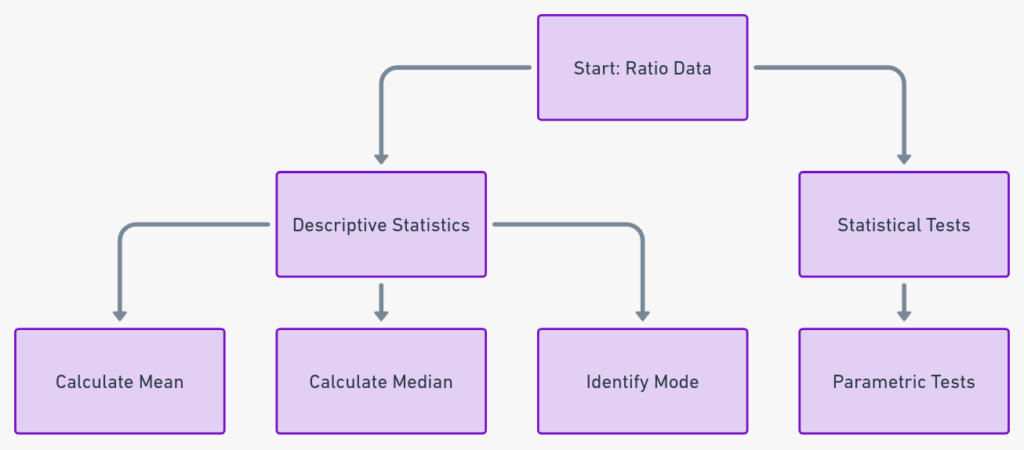
How to Analyze Ratio Data
- Descriptive Statistics: You can use mean, median, and mode.
- Statistical Tests: Parametric tests are your best friends here.
Here’s a flowchart to guide you:
Comparative Analysis of Levels of Measurement
Alright, let’s wrap this up with a bang! We’ve talked about the four levels of measurement individually, but how do they stack up against each other?
Implied Hierarchy Among the Four Levels
The levels of measurement aren’t just random categories; they form an implied hierarchy. As you move from nominal to ratio, the level of precision and the types of statistical tests you can perform increase.
- Nominal: Basic categorization
- Ordinal: Categorization + Order
- Interval: Categorization + Order + Equal Intervals
- Ratio: Categorization + Order + Equal Intervals + True Zero
Sensitivity and Complexity in Statistical Analysis
- Nominal: Limited to basic descriptive statistics and non-parametric tests.
- Ordinal: Allows for more complex tests that consider order but not the exact differences between categories.
- Interval: Enables even more complex statistical tests that consider the exact differences between categories.
- Ratio: The sky’s the limit! You can perform all sorts of parametric tests.
Here’s a radar chart to give you a visual comparison:
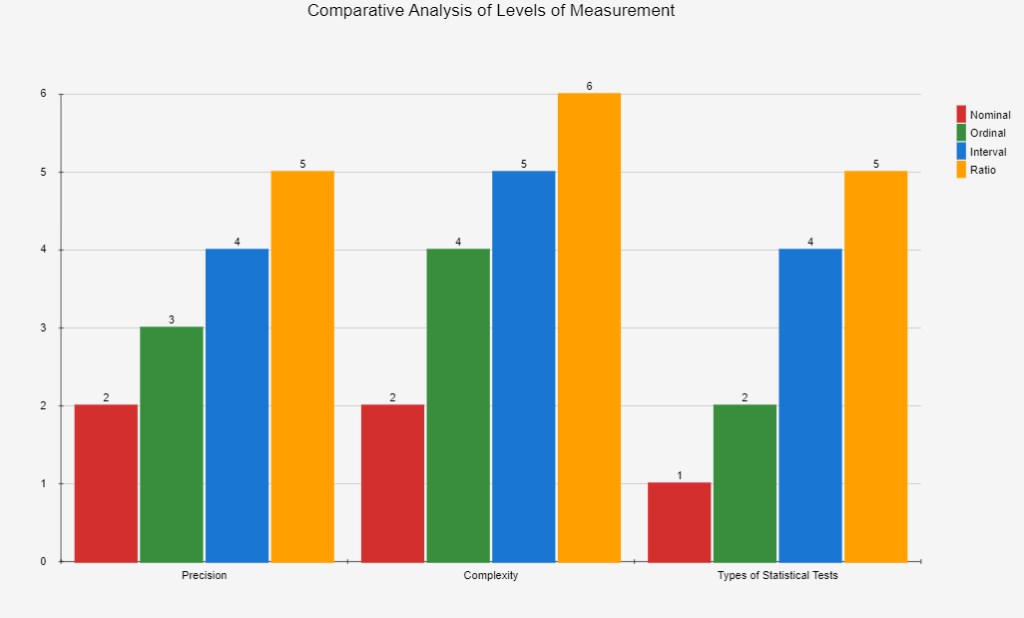
This chart compares the four levels of measurement based on criteria like precision, complexity, and types of statistical tests applicable.
Key Takeaways and Practical Tips
We’ve covered a lot of ground, haven’t we? But don’t worry, we’ve got a neat little package of key takeaways and practical tips to make your data journey smoother.
Key Takeaways
- Nominal Level: Great for basic categorization.
- Ordinal Level: Adds the element of order to your data.
- Interval Level: Brings in equal intervals for more precision.
- Ratio Level: The gold standard with a true zero point.
- Statistical Tests: The level of measurement dictates the types of statistical tests you can run.
- Data Precision: Higher levels allow for more precise and complex analyses.
Practical Tips for Researchers and Statisticians
- Plan Ahead: Know the level of measurement you’ll need for your desired statistical tests.
- Be Consistent: Stick to one level of measurement for similar variables.
- Check for True Zero: If your data has a true zero point, you’re likely dealing with ratio data.
- Review: Always double-check your data and the level of measurement before running tests.
Bullet Points with Icons
- Nominal: Basic but useful.
- Ordinal: Order matters.
- Interval: Precise intervals.
- Ratio: The ultimate level.
- Statistical Tests: Choose wisely.
- Precision: Aim for higher levels.
Checklist for Analysts and Researchers
Now I know that a detailed checklist can be a lifesaver! Here’s a comprehensive version to guide you through your research journey:
Planning Phase
- [ ] Literature Review: Familiarize yourself with existing research on your topic.
- [ ] Identify Research Questions: Clearly define what you aim to find out.
- [ ] Select Research Methods: Decide on qualitative, quantitative, or mixed methods.
- [ ] Identify Your Variables: Know what you’re measuring and how it fits into your research questions.
Data Collection Phase
- [ ] Determine the Level of Measurement: Choose the most appropriate level—nominal, ordinal, interval, or ratio.
- [ ] Design Your Instrument: Whether it’s a survey, experiment, or observational study, make sure it aligns with your level of measurement.
- [ ] Pilot Test: Test your instrument on a smaller sample to iron out any issues.
- [ ] Collect Data: Execute your data collection plan with your chosen level of measurement in mind.
Data Analysis Phase
- [ ] Data Cleaning: Remove any outliers or errors in your dataset.
- [ ] Select Statistical Tests: Choose tests that are compatible with your level of measurement.
- [ ] Run Preliminary Analyses: Conduct initial tests to get a sense of your data.
- [ ] Analyze: Perform your chosen statistical tests.
Interpretation and Reporting Phase
- [ ] Interpret Results: Make sense of your statistical outputs.
- [ ] Relate to Research Questions: How do your results answer your initial questions?
- [ ] Draw Conclusions: Summarize the key findings and their implications.
- [ ] Peer Review: Have colleagues or mentors review your findings.
- [ ] Publish or Present: Share your research with the world!
If you would like to learn step by step process of writing business research report, then check out our courses