
What are different Statistical Analysis Techniques? Get to know all in easy way
Hey there! Welcome to Statssy!. Today we will learn about different statistical analysis techniques and processes.
Why should I learn statistical analysis techniques?
Ever wondered how Netflix knows exactly what show you’ll binge-watch next? Or how your favorite online store seems to know what you’re going to buy before you do? Well, it’s not magic—it’s statistical analysis!
Statistical analysis is like the secret sauce that makes sense of all the data around us. It helps us understand trends, make predictions, and basically, it’s the reason why the digital world seems so in tune with our needs.
But hold up, it’s not just Netflix and shopping apps that are in on this. Statistical analysis is a big deal in a bunch of fields. From healthcare—like predicting the spread of a virus (yeah, we’re looking at you, COVID-19 )—to gaming strategies in eSports, and even in climate change research.
So, what’s coming up in this article? We’re going to dive deep into:
- Why statistical analysis is super important
- The different functions it serves
- The various types of statistical analysis you should know about
- A step-by-step guide on how to actually do it
- Some cool methods and tools you can use
And because we know you love visuals, we’ve got some killer charts and graphs to make everything extra clear.
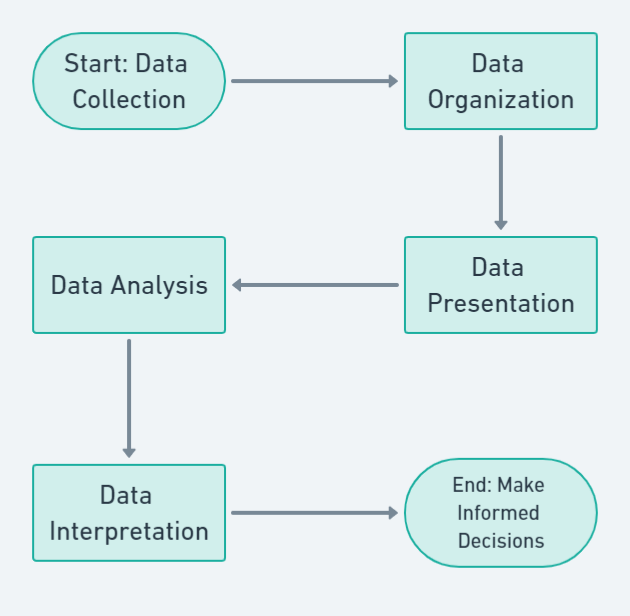
To kick things off, check out this flowchart that takes you on a journey from collecting data to making sense of it all.
Ready to become a data wizard? Let’s get started!
1. What is the importance of Statistical Analysis
Alright, so you’re intrigued by statistical analysis. But why should you care? Well, let’s break it down.
Making Informed Decisions
First off, statistical analysis is your go-to tool for making decisions that actually make sense. Imagine you’re a game developer . You’ve got tons of data from beta testers, but how do you know what features to keep or ditch? Statistical analysis helps you sift through the noise and focus on what gamers really want.
Fields Where It’s a Game-Changer
- Academia: Ever wondered how researchers conclude that one teaching method is better than another? Yep, you guessed it—statistical analysis.
- Healthcare: In the medical world, statistical analysis is a lifesaver—literally. It helps in drug development, patient care, and even in managing hospital resources.
- Business: If you’re into the stock market or just curious about how companies like Amazon or Tesla make their moves, it’s all about crunching those numbers.
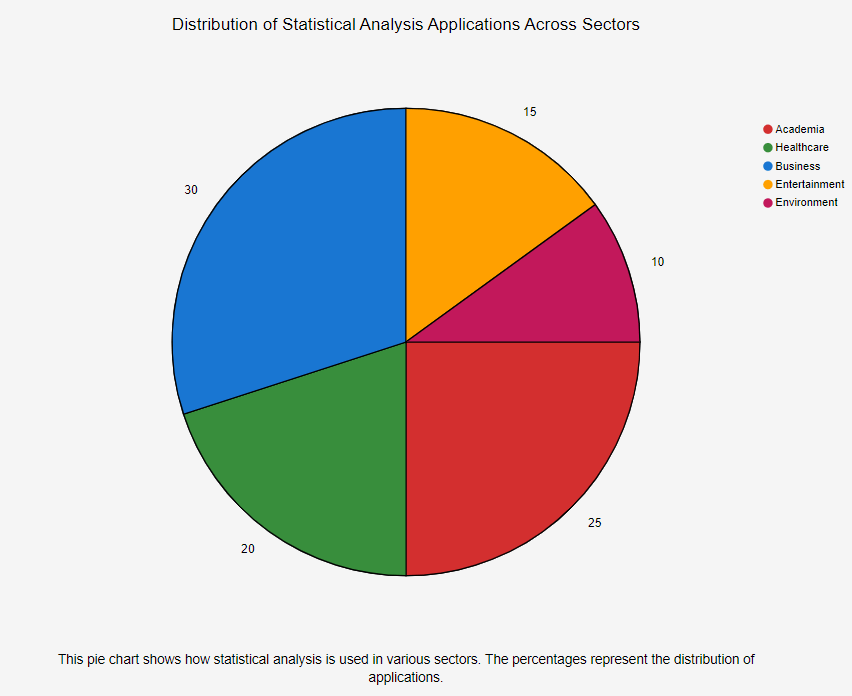
To give you a clearer picture, check out this pie chart that shows where statistical analysis is most commonly used.
So, whether you’re planning to be the next Elon Musk or just trying to ace your next exam, statistical analysis has got your back.
Ready to dive into the different functions of statistical analysis? Let’s go Statistical Analysis Techniques
2. What are the functions of Statistical Analysis
So, we’ve established that statistical analysis is pretty awesome, right? But what exactly can it do? Let’s dig into some of its major functions.
Prediction
One of the coolest things about statistical analysis is its ability to predict future events. For example, sports analysts use statistical methods to predict which team is likely to win the next big game. Or think about weather forecasting; meteorologists use statistical data to predict if you’ll need an umbrella tomorrow.
Risk Assessment
Ever heard of insurance companies calculating premiums? That’s statistical analysis methods at work! They assess the risk associated with insuring your car, health, or even your pet goldfish. The higher the risk, the higher the premium. It’s also used in healthcare to assess the effectiveness of a new vaccine or treatment.
Trend Identification
This is where businesses and marketers get really excited. By using statistical techniques, they can identify consumer trends. For example, if you’ve noticed that avocado toast is suddenly everywhere, that’s not an accident. Marketers have identified a trend and are capitalizing on it.
Visual Aid: Imagine a spider web chart where each of these functions is a point on the web, and lines connect them to show how they’re interrelated. For instance, prediction and risk assessment might be closely connected because predicting future events often involves assessing risks.
| Function | Example | Interconnection with Other Functions |
|---|---|---|
| Prediction | Sports outcomes, weather forecast | Closely linked with Risk Assessment |
| Risk Assessment | Insurance premiums, vaccine effectiveness | Intersects with Prediction and Trend Identification |
| Trend Identification | Consumer trends like avocado toast popularity | Linked with Prediction |
So, whether you’re trying to predict the next big TikTok trend or assessing the risk of launching a new product, statistical analysis methods have got you covered.
Ready to explore the different types of statistical analysis? Let’s go
3. What are types of Statistical Analysis
Alright, let’s get into the nitty-gritty—the different types of statistical analysis. Trust me, it’s not as complicated as it sounds!
3.1 What is Descriptive Statistical Analysis
Purpose: This is like the baby steps of statistical analysis. It helps you understand what your data is telling you at a glance. For example, if you’re looking at your grades, descriptive analysis will tell you your highest, lowest, and average grades.
Methods: We’re talking mean, median, mode—the basics.
Limitations: While it’s great for summarizing data, it doesn’t tell you why something is happening. Like, it can tell you that you scored low in Math, but it won’t tell you why.
3.2 What is Inferential Statistical Analysis
Purpose: This is where you start making educated guesses (aka inferences) about a larger group based on a sample. Like, if 9 out of 10 of your friends love a new Netflix series, you might infer that it’s generally popular.
Methods: Here, you’ll encounter statistical analysis methods like t-tests, chi-square tests, and ANOVA.
Tests: These tests help you make sure your inferences are legit and not just flukes.
3.3 What is Associational Statistical Analysis
Purpose: This type gets a bit complex. It’s all about finding relationships between variables. For instance, does eating more chocolate really make you happier?
Methods: Correlation and regression are your go-to statistical techniques here.
Mathematical Tools: Think Spearman’s rank, Pearson’s correlation, and linear regression models.
3.4 Predictive Analysis
Purpose: Predictive analysis is like your very own crystal ball, but backed by data. It uses historical data to predict future events. This is especially useful in market trends, customer behaviors, and even in predicting natural disasters.
Methods Involved: Regression analysis, time series analysis, and machine learning algorithms are commonly used in predictive analysis.
Applications: Ever wondered how Netflix knows what show you’ll binge-watch next? Or how weather apps predict rain down to the minute? That’s predictive analysis at work.
Limitations: While it’s powerful, it’s not foolproof. Predictions are based on past data, which means if the data is flawed, your predictions will be too.
3.5 Prescriptive Analysis
Purpose: If predictive analysis tells you what might happen in the future, prescriptive analysis goes a step further and tells you what you should do about it.
Methods Involved: Optimization models and simulation algorithms are often used here.
Applications: Think of healthcare, where doctors can prescribe treatments based on a patient’s medical history and current condition. In business, it can help in resource allocation and inventory management.
Limitations: It often requires a vast amount of data and high computational power. Also, the recommendations are only as good as the data you feed into it.
3.6 Exploratory Analysis
Purpose: When you’re not sure what you’re looking for, exploratory analysis allows you to sift through data sets and identify patterns or anomalies.
Methods Involved: Descriptive statistics, clustering, and principal component analysis are some of the techniques used.
Applications: It’s widely used in research to explore new theories. For example, you might use it to find out what factors contribute to student stress.
Limitations: It’s more about discovery and less about confirmation, so while it can point you in a direction, it can’t provide definitive answers.
3.7 Causal Analysis
Purpose: This type digs deep to find out the cause of a particular event or phenomenon. It’s not just about knowing what happened, but why it happened.
Methods Involved: Controlled experiments and longitudinal studies are common methods.
Applications: In medicine, it’s used to find out the causes of diseases. In marketing, it can help understand why a particular campaign succeeded or failed.
Limitations: Establishing causality is complex and often requires controlled environments, which may not always be feasible.
| Type | Methods | Applications | Limitations | Time Frame to Learn (Weeks) |
|---|---|---|---|---|
| Descriptive | Mean, Median, Mode | Summarizing data like grades, customer reviews | Doesn’t explain ‘why’ or underlying causes | 2-4 weeks |
| Inferential | T-tests, Chi-square, ANOVA | Making inferences like predicting Netflix show popularity, election outcomes | Requires a representative sample, prone to errors if assumptions aren’t met | 4-6 weeks |
| Associational | Correlation, Regression | Finding relationships like the link between chocolate and happiness, or exercise and health | Complexity, requires expertise in model fitting | 5-7 weeks |
| Predictive | Regression, Time Series Analysis | Market trends, customer behavior, weather forecasting | Predictions are based on past data, can be flawed | 6-8 weeks |
| Prescriptive | Optimization Models, Simulation Algorithms | Healthcare treatments, business resource allocation | Requires vast data and high computational power | 7-9 weeks |
| Exploratory | Descriptive Statistics, Clustering, Principal Component Analysis | Research theories, data discovery, identifying patterns | More about discovery, less about confirmation | 3-5 weeks |
| Causal | Controlled Experiments, Longitudinal Studies | Causes of diseases, marketing campaign effectiveness | Complex, often requires controlled environments | 8-10 weeks |
So, whether you’re trying to summarize your grades or predict the next big social media trend, there’s a type of statistical analysis for you.
Ready to walk through the step-by-step statistical analysis process? Let’s go!
4. Step-by-Step Statistical Analysis Process
4.1 Data Collection
Methods: Data can be collected in various ways, such as surveys, observations, and web scraping. For example, if you’re researching Gen Z’s favorite video games, you might use online surveys distributed on social media platforms like Instagram or Reddit.
Tips: To ensure your data is representative, aim for a diverse sample. If you’re only asking your circle of friends about their favorite Netflix shows, you might conclude that “Stranger Things” is universally loved, which might not be the case.
4.2 Data Organization
Once you’ve gathered your data, it’s crucial to clean it. For instance, you might find inconsistencies like names being spelled differently— “Joush” in one entry and “Joshua” in another. Dates could also be formatted differently, like “25/08/2023” and “08/25/2023.” These discrepancies need to be standardized for accurate analysis.
4.3 Data Presentation
Tools: After cleaning your data, you’ll want to present it in an understandable format. Software like Excel or Tableau can help you create various types of graphs. For example, if you’re looking at the popularity of different social media platforms among Gen Z, a bar graph could visually represent the number of users for each platform.
4.4 Data Analysis
This is where you’ll apply statistical techniques to your organized data. For instance, if you’re studying the impact of study hours on exam scores, you might use regression analysis to find a correlation. Software like SPSS or R can be particularly useful for this stage.
4.5 Data Interpretation
After the analysis, you’ll interpret what the data is telling you. For example, your analysis might reveal that Gen Z is more likely to invest in sustainable brands or cryptocurrencies. This is where you translate the numbers into actionable insights.
Lets sum up everything
| Step | Methods & Tools | Examples & Tips |
|---|---|---|
| Data Collection | – Surveys – Observations – Web scraping | Example: Researching Gen Z’s favorite video games using online surveys on Instagram or Reddit. Tips: Aim for a diverse sample to make your data representative. |
| Data Organization | – Data Cleaning – Standardization | Example: Standardizing names like “Joush” to “Joshua” and date formats like “25/08/2023” to “08/25/2023”. Tips: Consistency is key for accurate analysis. |
| Data Presentation | – Excel – Tableau | Example: Using a bar graph to show the popularity of different social media platforms among Gen Z. Tips: Choose the right type of graph to best represent your data. |
| Data Analysis | – Descriptive Statistics – Inferential Statistics – Regression Analysis – Software like SPSS or R | Example: Using regression analysis to study the impact of study hours on exam scores. Tips: Use specialized software for complex analyses. |
| Data Interpretation | – Translate data into insights – Actionable recommendations | Example: Finding that Gen Z is more likely to invest in sustainable brands or cryptocurrencies. Tips: Make sure to translate your findings into actionable insights. |
Key Takeaways:
- Data Collection: Choose the right method for your research. If you’re diving into Gen Z’s favorite video games, surveys on platforms they frequent can be a goldmine.
- Data Organization: Cleaning and standardizing your data is crucial. Imagine finding out halfway through your analysis that “Joush” and “Joshua” are the same person!
- Data Presentation: Tools like Excel and Tableau can turn your raw data into understandable graphs. A well-placed bar graph can speak louder than a thousand numbers.
- Data Analysis: This is where the magic happens. Use statistical techniques like regression analysis to uncover hidden patterns. Software like SPSS or R can be your best friends here.
- Data Interpretation: Last but not least, make sense of what you’ve found. Maybe you’ve discovered that Gen Z is all about that sustainable life.
So, ready to start your own statistical analysis journey? You’ve got the steps, the tips, and the tools. Now all you need is some data!
I hope this detailed breakdown provides a clearer and more comprehensive understanding of the statistical analysis process. Ready to move on to some common statistical analysis methods? To the moon!
5. Four Common Statistical Analysis Methods
Ready to get into the meat and potatoes of statistical analysis? Let’s explore some of the most commonly used statistical analysis methods and how they work.
5.1 Mean
How to Calculate: The mean is basically the average of a set of numbers. To calculate it, you add up all the numbers and then divide by the total number of values. For example, if you have exam scores of 80, 90, and 100, the mean would be (80+90+100)/3 = 90.
Applications: The mean is super useful in various fields. In education, it can help teachers understand the average performance of a class. In business, it can help analyze customer satisfaction scores.
5.2 Standard Deviation
How to Calculate: Standard deviation measures how spread out the numbers in a data set are. The formula might look intimidating, but software like Excel can do the heavy lifting for you.
Significance: Standard deviation helps you understand the variability in a data set. For example, if you’re looking at the ages of a group of people, a low standard deviation means most people are close to the average age, while a high standard deviation means the ages are more spread out.
5.3 Regression
What It Is: Regression analysis helps you understand the relationship between variables. For example, it can help you understand how hours spent studying affect exam scores.
Applications: Regression is widely used in fields like economics to predict stock prices, in healthcare to predict patient outcomes, and even in sports to predict game results.
5.4 Hypothesis Testing
Concept: Hypothesis testing is like the scientific method for data. You start with a hypothesis—like “Gen Z prefers online shopping to in-store shopping”—and then use data to test it.
Practical Example: Let’s say you conduct a survey and find that 70% of Gen Z respondents prefer online shopping. You would then use hypothesis testing to determine if this preference is statistically significant or just by chance. 🛒
Lets sum up things
| Method | How to Calculate | Applications | Real-World Example |
|---|---|---|---|
| Mean | Add all numbers and divide by the total number of values | Education, Business, Healthcare | Calculating average exam scores in a class |
| Standard Deviation | Use formula or software like Excel | Any field requiring understanding of data variability | Understanding age diversity in a community |
| Regression | Use statistical software for complex calculations | Economics, Healthcare, Sports | Predicting stock prices based on market trends |
| Hypothesis Testing | Conduct tests like t-tests or chi-square tests depending on your data | Marketing, Social Sciences, Medicine | Determining if a new drug is more effective than existing ones |
I hope this detailed table and examples help you grasp the fundamentals of these common statistical analysis methods. Ready to explore some advanced tools and software for statistical analysis? Let me know!
Section 6: Advanced Tools and Software for Statistical Analysis
Alright, you’ve got the basics down, so let’s talk about the tools that can make your life easier when performing statistical analysis. Whether you’re a student crunching numbers for a project or a marketer trying to understand consumer behavior, there’s a tool out there for you.
- Excel: This is the OG tool for statistical data analysis methods. It’s great for beginners and can handle tasks like calculating the mean, median, and even standard deviation. For example, if you’re a student looking to analyze your grades, Excel is a good starting point.
- SPSS: This is like the Swiss Army knife of statistical analysis methods. It’s widely used in academia and social sciences. If you’re a psychology student looking to analyze survey data, SPSS is your go-to.
- R: This one’s for the data science enthusiasts. It’s open-source and can handle complex statistical techniques like regression analysis and hypothesis testing. For instance, if you’re an economist looking to forecast economic trends, R is a powerful tool.
- Tableau: If you’re into statistical data analysis methods that involve a lot of data visualization, Tableau is a great option. It’s used in business analytics to create interactive dashboards. Imagine you’re a marketer trying to visualize customer engagement metrics; Tableau can make that data come alive.
- MATLAB: This one’s for the engineers and scientists. It’s excellent for types of statistical analysis that involve complex mathematical computations. For example, if you’re an engineer working on signal processing, MATLAB is your best bet.
- SAS: This is a powerhouse for statistical analysis methods and is widely used in healthcare for clinical trials. If you’re a researcher looking to analyze the effectiveness of a new drug, SAS can handle that complex data.
Lets sum up things
| Tool | Best For | Types of Statistical Analysis Covered | Example Use-Case |
|---|---|---|---|
| Excel | Beginners, Basic Analysis | Mean, Median, Standard Deviation | Analyzing student grades |
| SPSS | Academia, Social Sciences | Descriptive, Inferential | Psychology research |
| R | Data Science, Economics | Regression, Hypothesis Testing | Economic forecasting |
| Tableau | Business Analytics, Visualization | Descriptive, Basic Inferential | Visualizing customer engagement metrics |
| MATLAB | Engineering, Scientific Research | Complex Mathematical Computations | Signal processing in engineering |
| SAS | Healthcare, Advanced Research | Descriptive, Inferential, Regression, Hypothesis Testing | Clinical trials in healthcare |
So, whether you’re just starting out or looking to dive deep into complex statistical analysis methods, there’s a tool tailored for your needs.
Conclusion
Wow, what a journey we’ve been on! From understanding the importance of statistical analysis to diving into its various types and methods, we’ve covered a lot of ground.
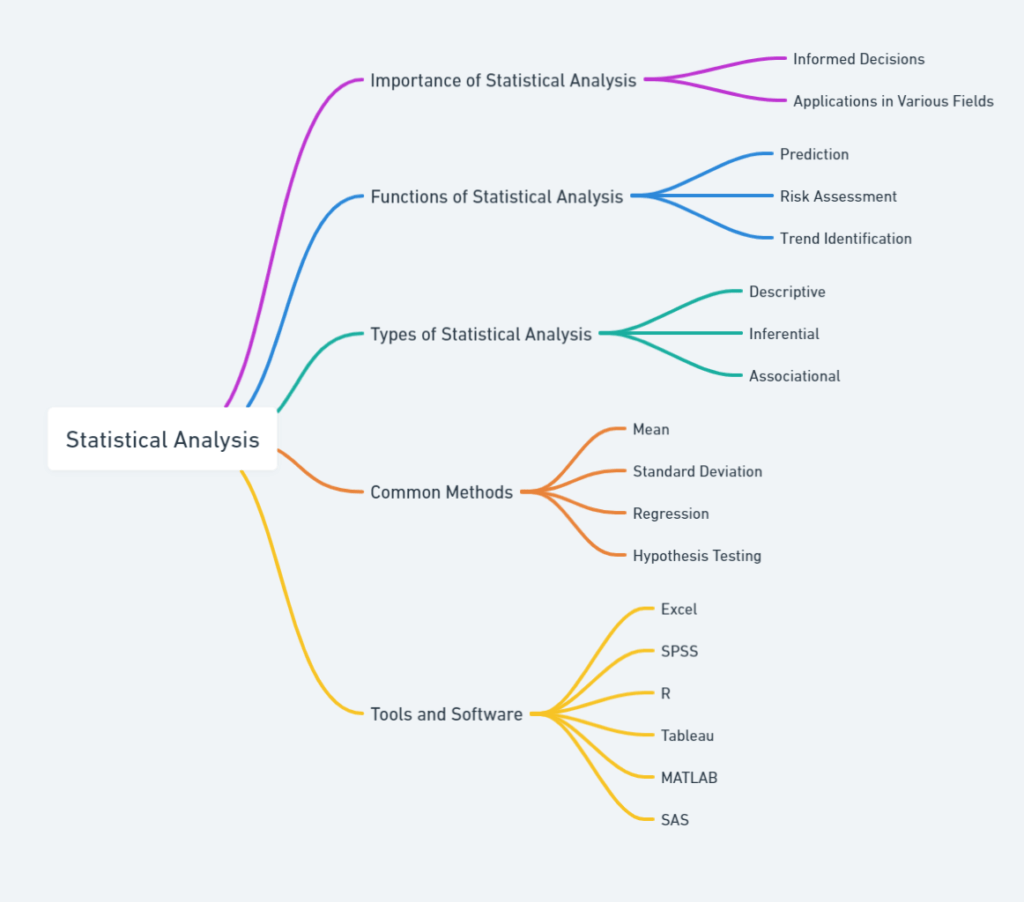
- Importance of Statistical Analysis: We kicked things off by exploring how crucial statistical analysis is for making informed decisions. Whether you’re in academia, healthcare, or business, these statistical methods are your best friends for data-driven insights.
- Functions of Statistical Analysis: Remember, statistical analysis isn’t just about crunching numbers; it’s also about prediction, risk assessment, and identifying trends. So, whether you’re predicting the next big TikTok trend or assessing the risk of a new business venture, statistical analysis has got you covered.
- Types of Statistical Analysis: We delved into the various types like Descriptive, Inferential, and Associational. Each has its own set of statistical techniques and applications, from summarizing data to making complex inferences.
- Common Methods: We also looked at some of the most commonly used statistical analysis methods, such as the mean, standard deviation, regression, and hypothesis testing. These are the building blocks for any data analysis project.
- Tools and Software: Finally, we explored the tools that can help you in your statistical analysis journey, from beginner-friendly Excel to more advanced options like R and SAS.
So, what are you waiting for? The world of data is at your fingertips, and statistical analysis is your key to unlocking meaningful insights. Whether you’re a student, a professional, or just someone curious about the world, there’s a place for statistical analysis in your life.
To sum it all up, here’s a mind map that encapsulates the key points we’ve discussed.
That’s a wrap! I hope this article has been both informative and engaging. Ready to dive into your own statistical analysis project? Go for it!
Feeling like a data wizard yet? If you’re eager to level up your statistical analysis game, you’ve got to check out these must-read blogs on Statssy. From mastering the essential data terminology for business analytics to getting hands-on with calculating simple linear regression, these blogs are your next stop. Want to get into the nitty-gritty?
Learn how to calculate Pearson correlation coefficients by hand or dive into the concept of residuals in statistics. And that’s not all! Understand the levels of measurement in statistics and get to grips with understanding skewed distributions. Trust me, you don’t want to miss out on these gems!