
Introduction
The coefficient of variation (CV) is a useful statistical measure that compares the relative dispersion in a data around mean value. It is defined as the ratio of the standard deviation to the mean and is expressed as a percentage. In the business field, the CV can help measure the risk associated with investments or the variability of sales or revenue. In this article, we will learn how to calculate the coefficient of variation in Stata using a simple example from business domain.
Table of Contents
Example Dataset:
Let’s assume we have a dataset of annual revenue (in million USD) of a company over ten years:

Calculating the Coefficient of Variation in Stata:
Input the data in Stata:
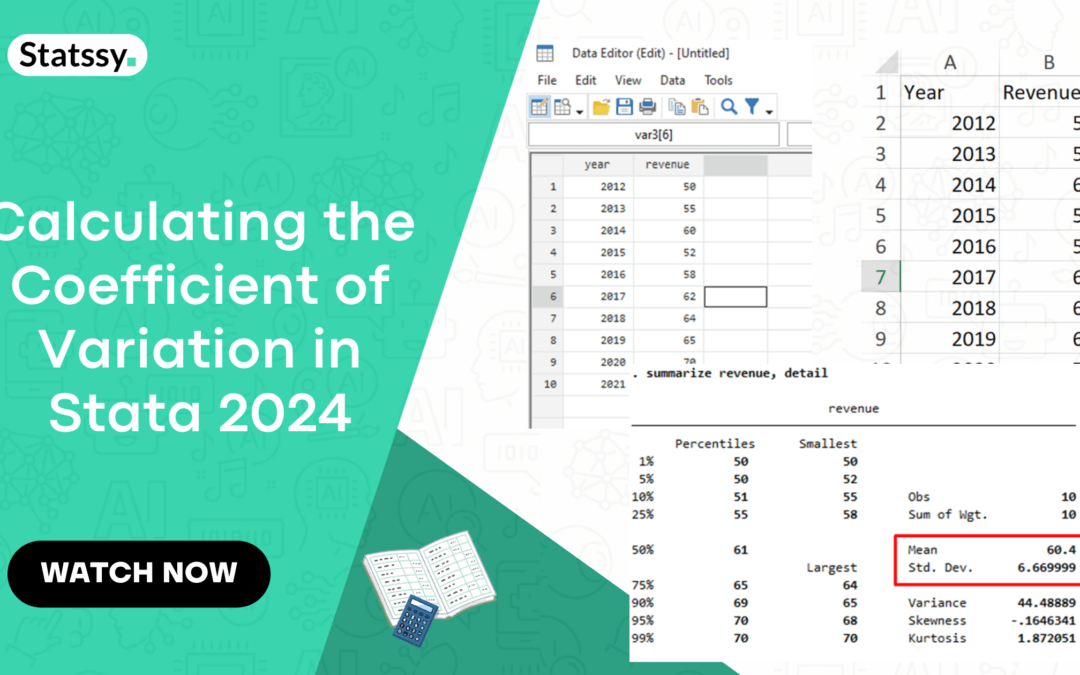
1. First, we need to input the data into Stata. You can either use the “Data Editor” or type the following commands in the Stata command window:
clear
input year revenue
2012 50
2013 55
2014 60
2015 52
2016 58
2017 62
2018 64
2019 65
2020 70
2021 68
end

After you enter this command and click “ENTER”, the dataset will be created in Stata. To check the data, click on “Data Editor” on the toolbar.


2. Calculate the mean and standard deviation:
We will use Stata’s summarize command to calculate the mean and standard deviation of the revenue:
summarize revenue, detail

Enter this command in Command window and press “ENTER”. You will find the summary generated in the output window with mean and standard deviation along with other details.

Let’s now focus on mean and standard deviation only.
From the output, note the mean (µ) and the standard deviation (σ) of the revenue.
3. Calculate the Coefficient of Variation:
Now, we will calculate the CV using the formula CV = (σ/µ) * 100:
gen cv = (r(sd) / r(mean)) * 100

list cv in 1

Once you run the command, you will find the results in output window.

This shows that there is 11.04% variations in the revenue compared to the mean revenue across years.
Conclusion: Coefficient of Variation in Stata 2024
In this blog post, we learnt how to calculate the coefficient of variation in Stata using a simple business case. The CV is a useful measure for comparing the relative variability of datasets and can be particularly helpful in the business context for assessing risk or variability in sales, revenue, or other financial metrics.