R Shiny Dashboard Creation Services

Slider Image
Slider Image
Slider Image
Slider Image
Slider Image
Slider Image
Slider Image
Slider Image
Slider Image
Slider Image
Slider Image
Slider Image
Slider Image
Slider Image
Slider Image
Slider Image
Slider Image

STARTS AT $50

1.

R Shiny Interactive Dashboards

2.

Custom Data Visualization Solutions

3.

Real-Time Data Analysis Expert

Enhance your data’s impact with my expert dashboard development in R Shiny. I design dynamic, interactive dashboards that make your data engaging and comprehensible.

  1. Implement data integration and user interface design in R Shiny, ensuring a seamless and intuitive user experience.
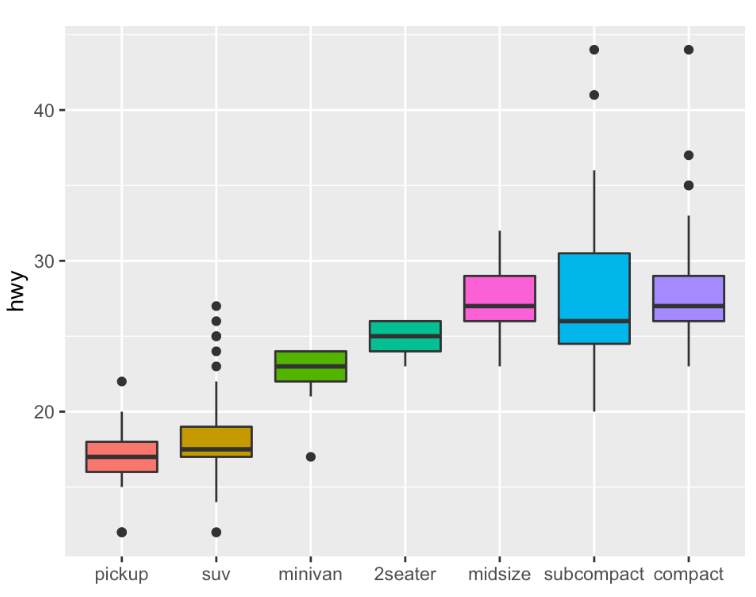
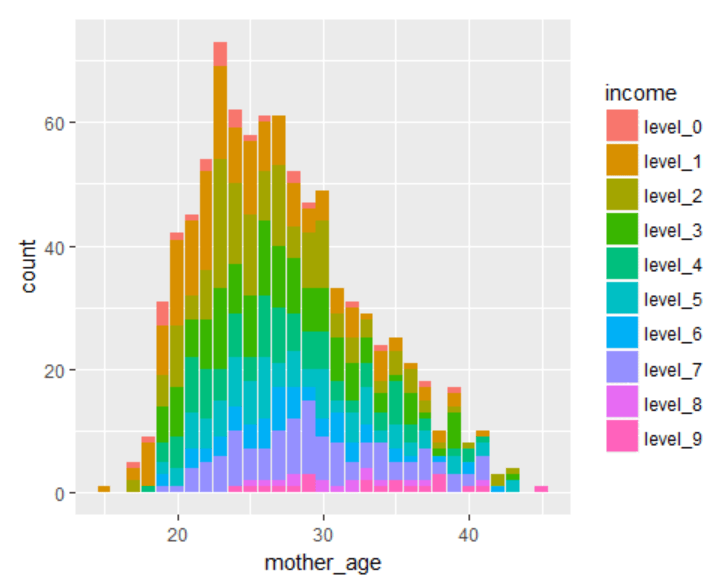
  2. Utilize R Shiny’s interactive capabilities to allow users to manipulate and explore data in real-time, fostering better insights.
  3. Design and implement custom visual components in R Shiny, from interactive graphs to data tables, tailored to your specific needs.
  4. Incorporate advanced analytical techniques directly within your dashboards, such as predictive models and real-time data analysis.
  5. Produce comprehensive, interactive reports using R Markdown, integrating R Shiny applications for a fully interactive data narrative.
  6. Ensure high performance and responsiveness of your dashboards, optimizing for both speed and usability across devices.


Specialized in R Shiny for creating powerful, user-focused dashboards, proficient with related technologies including HTML, CSS, and JavaScript for enhanced customization. My expertise includes designing for usability, integrating complex datasets, and delivering rich, interactive visualizations.

Utilizing the full potential of R Shiny, I offer personalized dashboard solutions that transform your raw data into strategic insights. My approach not only emphasizes technical precision but also focuses on delivering clear, actionable information through well-crafted interactive tools.

R Shiny Dashboard Developer

Elevate your data analysis with bespoke, interactive dashboards in R Shiny. Discover the power of dynamic data visualization, enabling tailored insights and decision-making in real-time.

My Body of Work

FAQ's

What is the price ?

What is the time of delivery?

Why should I trust your service?

Do you give refund?

What are the payment terms?

How do you ensure data confidentiality?

Can you work with sector-specific data?

What R packages are you proficient in?

How do you ensure the quality of analysis in R?

What types of data can be used for creating dashboards in R Shiny?

Can you customize dashboards to meet specific departmental or organizational needs?

How can these dashboards be integrated into our existing business processes?

How do you ensure the performance and reliability of the dashboards?

Review Image

Thomas J.

4

2023-02-28

R analysis was spot on but needed a bit more detail in the report. Overall, good job
Review Image

Anita P.

5

2022-07-06

Very professional service. The data visualization in R was amazing. Highly recommended.
Review Image

Lars N.

4

2023-11-09

The statistical analysis was comprehensive, but the delivery was a bit late.
Review Image

Yumi T.

5

2023-05-06

Excellent in-depth analysis using R. Helped a lot in my research work.
Review Image

Lucas B.

5

2023-09-14

Good work but had some issues understanding the report. Needed clearer explanations.
Review Image

Fiona W.

4

2023-10-11

Impressive R skills, the data analysis was exactly what I needed for my project.
Review Image

Ahmed S.

4

2023-07-06

The analysis was good, but communication could have been better.
Review Image

Marie D.

5

2023-09-29

Great service! The R report was detailed and easy to follow.
Review Image

Henry C.

4

2023-04-10

Needed more customization in the analysis. Was expecting a bit more.
Review Image

Chiara V.

5

2023-07-29

The statistical methods used were advanced and well-explained. Great use of R.
Review Image

Alex P.

4

2023-07-29

Fast delivery but the analysis lacked some depth. Decent overall.
Review Image

Nina K.

4

2023-09-29

The R analysis was thorough, but I had to ask for revisions for more clarity.
Review Image

Omar F.

4

2023-06-29

Excellent service, the R visualizations were exactly as per my requirements.
Review Image

Sarah L.

4

2023-06-29

The project was well-handled but faced some delays in getting the final report.
Review Image

Wei Z.

4

2023-08-29

Impressive statistical analysis in R, but the report had some minor errors.
Review Image

Miguel A.

4

2023-09-29

Needed a quick analysis in R. The service was good but not exceptional.
Review Image

Hannah M.

5

2023-07-29

Very detailed and accurate R analysis. Will definitely recommend.
Review Image

Ivan G.

4

2023-07-05

Good service but the interpretation of the data could have been more detailed.
Review Image

Emma S.

4

2023-10-17

Great analytical skills, but there was a misunderstanding regarding my data requirements.
Review Image

Diego R.

5

2023-11-08

The R analysis was comprehensive and well-structured. A bit pricey but worth it.

What I Need to Start Your Project

To ensure that I can provide you the best possible service and deliver results that meet your needs, I will need the following information from you before starting your project:

Project Details:

  • Overview and Objectives: A concise description of the dashboard project, outlining its goals and the specific insights or decisions it aims to support.
  • User Interaction Requirements: Any specific features or interactions you want to include, such as dropdowns, sliders, or clickable elements.

Data and Data Description (if available):

  • Dataset(s) for the Dashboard: The data to be used, preferably in a format that can be easily imported into R (like CSV, Excel, or text files).
  • Data Details: Comprehensive information about the data, including source, variables, and any preprocessing or cleaning that has already been done.

Dashboard Requirements:

  • Customization Needs: Details on the specific types of visualizations (e.g., bar charts, heat maps, time series), interactive elements, or color schemes you prefer.
  • Performance Specifications: Expectations regarding the dashboard’s response time and handling of data updates (e.g., real-time, periodic updates).

Reporting and Documentation (if applicable to the service):

  • Documentation Needs: Preferences for the structure and format of any supporting documentation, including user manuals or technical guides.
  • Output Formats: Required formats for exporting data from the dashboard (e.g., PDF, Excel, interactive web page).

Communication Preferences:

  • Channels and Frequency of Updates: Your preferred methods for communication (e.g., email, phone calls, video conferencing) and how often you would like to receive project updates.
  • Project Timeline: Any critical deadlines or milestones that need to be met, including the desired launch date for the dashboard.


Related Services