Interactive Dashboard in Excel

Slider Image
Slider Image
Slider Image
Slider Image
Slider Image
Slider Image
Slider Image
Slider Image
Slider Image

STARTS AT $25

1.

Excel Dashboard Developer

2.

Interactive Reporting Specialist

3.

Data Visualization Expert

Transform your data into actionable insights with my expertise in building interactive Excel dashboards. My service focuses on creating user-friendly, dynamic dashboards that provide a clear and comprehensive view of your key business metrics, facilitating informed decision-making.

  1.  Design custom Excel dashboards, integrating various data sources for a unified and interactive reporting experience.
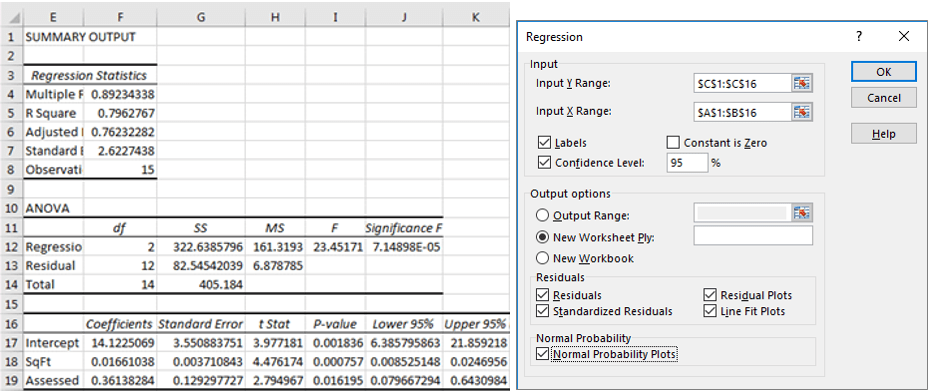
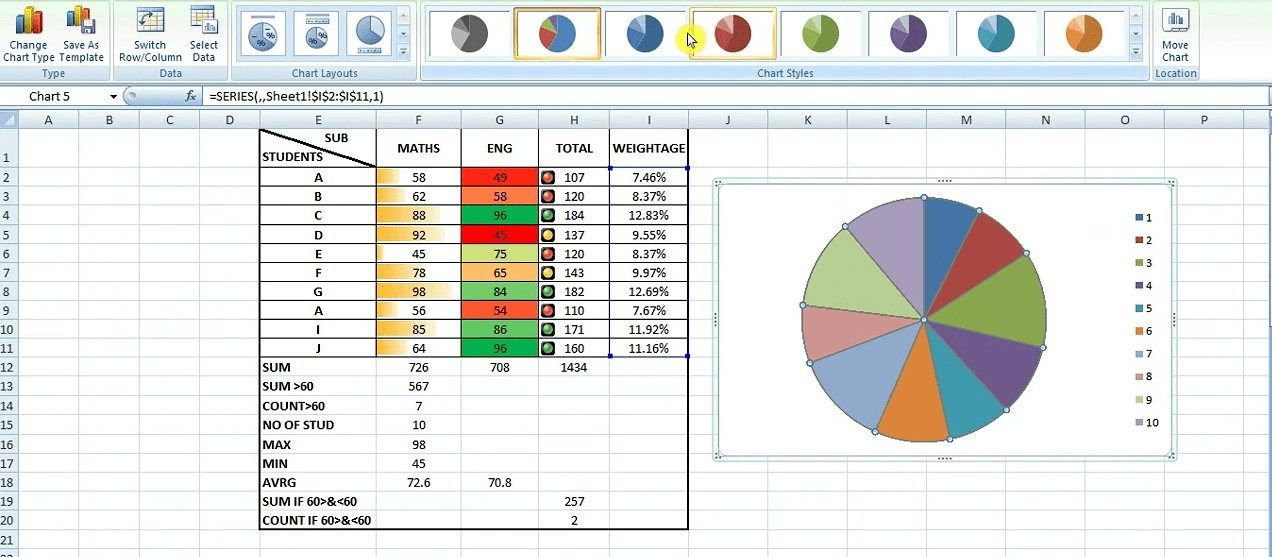
  2. Utilize advanced Excel features like PivotTables, slicers, and formulas to create dynamic, data-driven dashboards.
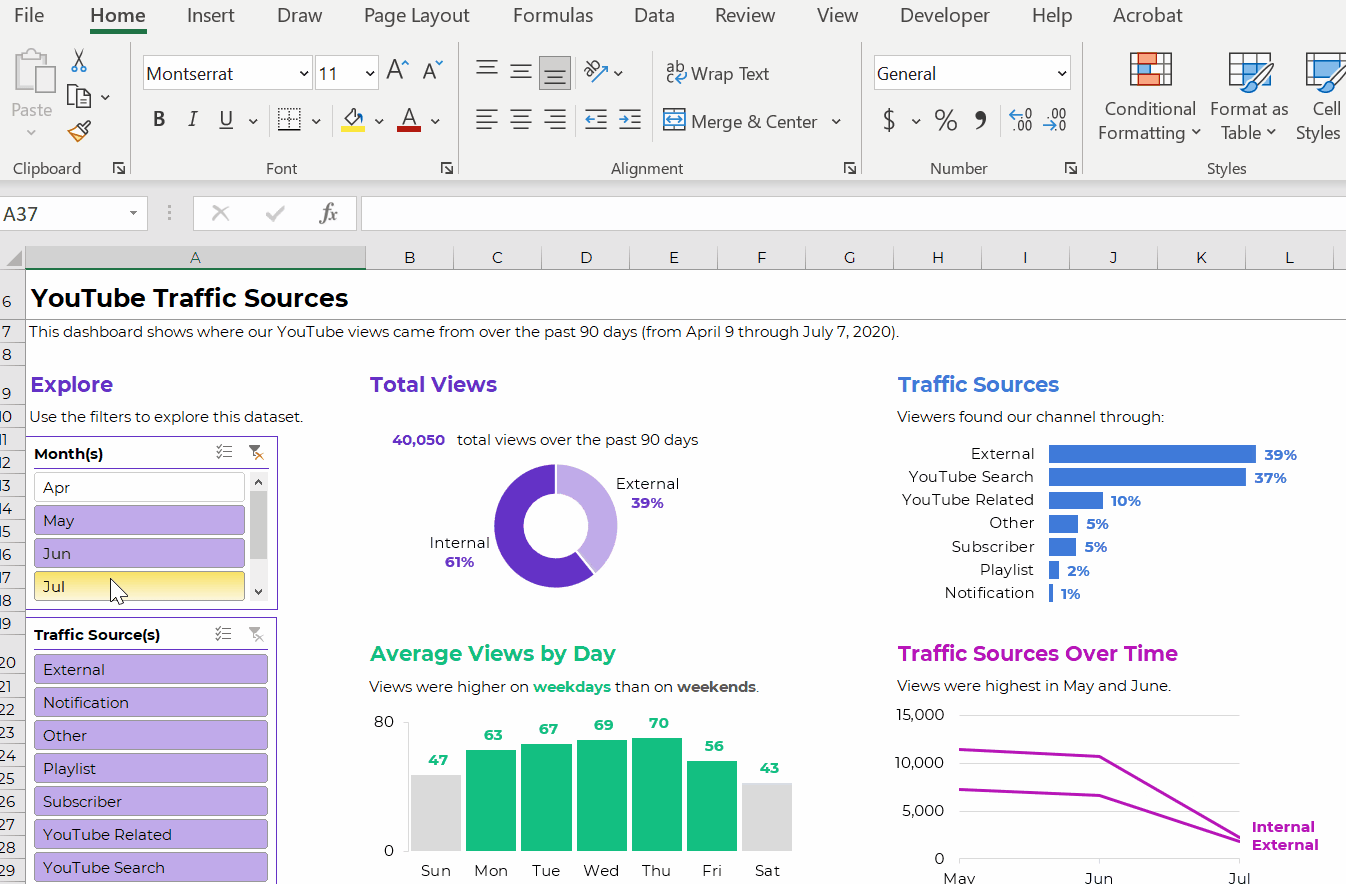
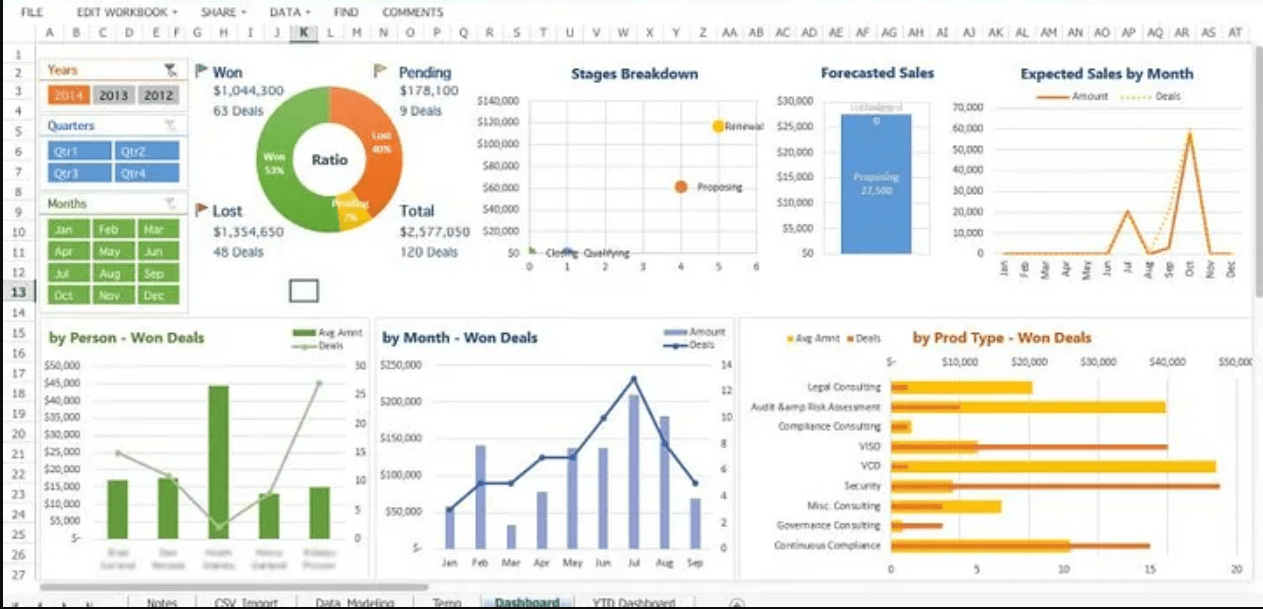
  3. Implement interactive elements, allowing users to filter, sort, and drill down into data for detailed analysis.
  4. Develop clear, visually appealing charts and graphs within Excel, enhancing the presentation and comprehension of complex data.
  5. Customize dashboard layout and design to meet your specific business needs and preferences, ensuring ease of use and relevance.
  6. Provide training and support on using the Excel dashboard effectively, ensuring your team can leverage the full potential of the tool for ongoing data analysis and reporting.


Proficient in designing interactive dashboards in Excel, skilled in using advanced Excel features like PivotTables, PivotCharts, slicers, and dynamic formulas. Experienced in integrating various data sources, creating visually appealing and user-friendly interfaces, and customizing dashboards for specific business analytics needs. 

Utilizing Excel’s powerful capabilities, I provide customized, interactive dashboards that transform your data into actionable insights. My focus is on delivering dashboards that are not only informative but also engaging, enabling easier data analysis and decision-making. 

Excel Dashboard Virtuoso

Elevate your data analysis with custom Excel dashboards. Experience the power of interactive and intuitive data visualization, turning complex datasets into clear, actionable insights.

My Body of Work

FAQ's

What is the price ?

What is the time of delivery?

Why should I trust your service?

Do you give refund?

What are the payment terms?

How do you ensure data confidentiality?

Can you work with sector-specific data?

How do you tailor the Excel dashboard to our specific business needs?

Can the dashboard be updated easily with new data?

Do you provide training on how to use and interpret the dashboard?

How do you ensure data accuracy and integrity in the dashboard?

Review Image

John D

4

2023-08-20

Absolutely thrilled with the Excel analysis! It really made a difference in understanding our sales trends.
Review Image

Sarah L.

5

2023-10-21

Incredible work with the inferential statistics on our project data. Thanks for the quick turnaround!
Review Image

Mike B

5

2023-03-24

Perfect execution of predictive statistics in Excel. This has helped our forecasts immensely.
Review Image

Emma C.

4

2023-08-24

Superb job cleaning and analyzing our survey data. Will definitely return for more services!
Review Image

Alex F.

3

2023-01-02

Transformed our complex financial data into easy-to-read Excel reports. Highly recommend!
Review Image

Nina P.

5

2024-11-21

Delivered detailed statistical reports using Excel, which were exactly what our business needed to make informed decisions.
Review Image

Omar K.

5

2023-06-15

Handled our healthcare data with great care, providing clear statistical insights through Excel.
Review Image

Chloe T.

5

2023-07-06

Amazing job with the regression analysis. Really helped us understand the customer behavior patterns.
Review Image

Lucas W.

4

2023-08-22

The Excel dashboards are fantastic! Great for our monthly performance reviews.
Review Image

Sophia R.

4

2023-11-15

Did a great job on short notice with our market research data. The analysis in Excel was spot on.
Review Image

Elena M.

5

2023-08-22

Excelled in creating predictive models for our retail data. The insights were truly enlightening!
Review Image

Rajesh N.

3

2023-09-11

Provided excellent exploratory analysis on our environmental data. Very thorough and informative.
Review Image

Julie H.

5

2023-04-14

Statistical reporting was top-notch. Made our year-end review process so much easier with the clear Excel visuals.
Review Image

Takashi S.

5

2023-11-02

Very impressed with the hypothesis testing done on our new product data. Reliable and insightful.
Review Image

Grace K.

5

2023-12-01

Fantastic work with Excel on our historical data. The trend analysis provided was extremely helpful.
Review Image

Carlos A.

5

2024-01-11

Handled our complex dataset with professionalism. The inferential statistics provided were exactly what we needed.
Review Image

Anna B.

5

2023-06-22

Did a great job with the correlation analysis between our sales channels. Provided clear Excel charts and explanations.
Review Image

Youssef T.

5

2023-05-09

Amazing speed and accuracy in delivering a comprehensive statistical report using Excel. Saved us a lot of time!

What I Need to Start Your Project

To ensure that I can provide you the best possible service and deliver results that meet your needs, I will need the following information from you before starting your project:

  1. Dashboard Objectives and Key Metrics: Clear understanding of the objectives for the dashboard, such as tracking sales, monitoring project status, or analyzing financial data. Identification of key metrics and KPIs (Key Performance Indicators) to be visualized on the dashboard.
  2. Data Sources and Accessibility: Detailed information on data sources to be used for the dashboard (e.g., internal databases, Excel files, cloud-based data). Requirements for data accessibility and any periodic updates or refresh needs.
  3. Excel Capabilities and Features: Specification of desired Excel features to be used, such as PivotTables, charts, slicers, or conditional formatting. Any advanced Excel functionalities required, like VBA (Visual Basic for Applications) for automation or interactive elements.
  4. Layout and Design Preferences: Preferences for dashboard layout, design elements, and color schemes. Requirements for user interface elements that facilitate interaction, such as drop-down lists, sliders, or buttons.
  5. User Interaction and Functionality: Details on how users will interact with the dashboard, including filtering, sorting, and drill-down capabilities. Any specific functionalities needed for data manipulation or exploration within the dashboard.
  6. Reporting and Output: Requirements for reporting features, such as exporting data or generating automated reports from the dashboard. Considerations for print layouts or PDF export options.
  7. Security and Access Control: Protocols for data security and confidentiality within the Excel dashboard. Access control requirements, if the dashboard will be shared among multiple users.
  8. Integration with Other Tools: Information on integration with other tools or systems, if necessary (e.g., connecting Excel to an external database or application).
  9. Timeline and Development Phases: Expected timeline for the dashboard development, including key milestones and review points. Schedule for delivering initial prototypes and final version.
  10. Feedback and Revision Process: Process for providing feedback on initial designs and functionality. Willingness for iterative development based on user feedback and testing.

Related Services