
Ever heard of the Pearson Correlation Coefficient? It’s this cool concept named after a statistician named Karl Pearson. In simple terms, it’s a way to measure how two continuous variables move together.
It’s a pretty big deal in fields like statistics, data science, and research. But don’t worry if it sounds complicated – we’re here to break it down together, step by step, so that even if you’re a complete beginner, you’ll get the hang of it.
Table of Contents
So, What Exactly is the Pearson Correlation Coefficient?
Great question! The Pearson Correlation Coefficient, which we often shorten to ‘r’, is a statistical tool that helps us understand the strength of the relationship between two variables. Think of it like a scale that ranges from -1 to 1. If ‘r’ is -1, it means the two variables are perfectly negatively correlated – when one goes up, the other goes down.
If ‘r’ is 1, it means they’re perfectly positively correlated – when one goes up, the other goes up too. And if ‘r’ is 0, it means there’s no correlation at all – the two variables are doing their own thing, independent of each other. Cool, right?
\[ r = \frac{\sum (x_i – \bar{x})(y_i – \bar{y})}{\sqrt{\sum (x_i – \bar{x})^2(y_i – \bar{y})^2}} \]
Where:
- \(x_i\) and \(y_i\) are the individual sample points indexed with i
- \(\bar{x}\) and \(\bar{y}\) are the mean of x and y respectively.
Step-by-Step Calculation
Let’s break down the calculation of the Pearson Correlation Coefficient into simple steps using two relatable examples.
Example 1: Hours Spent Studying vs Test Scores
Let’s say we have data for the number of hours a group of students spent studying for a test and their respective test scores. We want to find out if there’s a correlation between the hours spent studying and the test scores.
| Student | Hours Spent Studying (x) | Test Score (y) |
|---|---|---|
| 1 | 2 | 50 |
| 2 | 3 | 60 |
| 3 | 4 | 70 |
| 4 | 5 | 80 |
| 5 | 6 | 90 |
Step 1: Calculate the Mean of x and y
The mean (average) is calculated by adding up all the values and dividing by the number of values.
For x (Hours Spent Studying) and y (Test Score):
Calculate Pearson Correlation Coefficient
\[ \bar{x} = \frac{2 + 3 + 4 + 5 + 6}{5} = 4 \] \[ \bar{y} = \frac{50 + 60 + 70 + 80 + 90}{5} = 70 \]Calculate Pearson Correlation Coefficient in 2024
Step 2: Subtract the Mean from Each Data Point
This gives us the deviation of each data point from the mean.
\[ x_i – \bar{x} = [2 – 4, 3 – 4, 4 – 4, 5 – 4, 6 – 4] = [-2, -1, 0, 1, 2] \] \[ y_i – \bar{y} = [50 – 70, 60 – 70, 70 – 70, 80 – 70, 90 – 70] = [-20, -10, 0, 10, 20] \]Calculate Pearson Correlation Coefficient in 2024
Step 3: Multiply the Results from Step 2
Multiply the results from step 2 for each corresponding pair of x and y.
\[ (x_i – \bar{x})(y_i – \bar{y}) = [-2 * -20, -1 * -10, 0 * 0, 1 * 10, 2 * 20] = [40, 10, 0, 10, 40] \]Calculate Pearson Correlation Coefficient
Step 4: Square the Results from Step 2
Square the results from step 2 for x and y separately.
\[ (x_i – \bar{x})^2 = [-2^2, -1^2, 0^2, 1^2, 2^2] = [4, 1, 0, 1, 4] \] \[ (y_i – \bar{y})^2 = [-20^2, -10^2, 0^2, 10^2, 20^2] = [400, 100, 0, 100, 400] \]Calculate Pearson Correlation Coefficient
Step 5: Sum Up the Results
Sum up the results from step 3 and step 4.
\[ \sum (x_i – \bar{x})(y_i – \bar{y}) = 40 + 10 + 0 + 10 + 40 = 100 \] \[ \sum (x_i – \bar{x})^2 = 4 + 1 + 0 + 1 + 4 = 10 \] \[ \sum (y_i – \bar{y})^2 = 400 + 100 + 0 + 100 + 400 = 1000 \]Step 6: Substitute the Values into the Formula
Finally, substitute the values obtained from the above steps into the formula:
\[ r = \frac{100}{\sqrt{10 * 1000}} \] \[ r = 1 \]After calculating, we find that (r = 1). This indicates a perfect positive correlation between the hours spent studying and the test scores. In other words, as the number of hours spent studying increases, the test scores increase as well.
Example 2: Social Media Usage vs Test Scores
Now, let’s consider a different scenario. We have data for the number of hours a group of students spent on social media the day before a test and their respective test scores. We want to find out if there’s a correlation between social media usage and test scores.
| Student | Hours Spent on Social Media (x) | Test Score (y) |
|---|---|---|
| 1 | 6 | 50 |
| 2 | 5 | 60 |
| 3 | 4 | 70 |
| 4 | 3 | 80 |
| 5 | 2 | 90 |
Step 1: Calculate the Mean of x and y
The mean (average) is calculated by adding up all the values and dividing by the number of values.
For x (Hours Spent on Social Media) and y (Test Score):
\[ \bar{x} = \frac{6 + 5 + 4 + 3 + 2}{5} = 4 \] \[ \bar{y} = \frac{50 + 60 + 70 + 80 + 90}{5} = 70 \]Step 2: Subtract the Mean from Each Data Point
This gives us the deviation of each data point from the mean.
\[ x_i – \bar{x} = [6 – 4, 5 – 4, 4 – 4, 3 – 4, 2 – 4] = [2, 1, 0, -1, -2] \] \[ y_i – \bar{y} = [50 – 70, 60 – 70, 70 – 70, 80 – 70, 90 – 70] = [-20, -10, 0, 10, 20] \]Step 3: Multiply the Results from Step 2
Multiply the results from step 2 for each corresponding pair of x and y.
\[ (x_i – \bar{x})(y_i – \bar{y}) = [2 * -20, 1 * -10, 0 * 0, -1 * 10, -2 * 20] = [-40, -10, 0, -10, -40] \]Calculate Pearson Correlation Coefficient
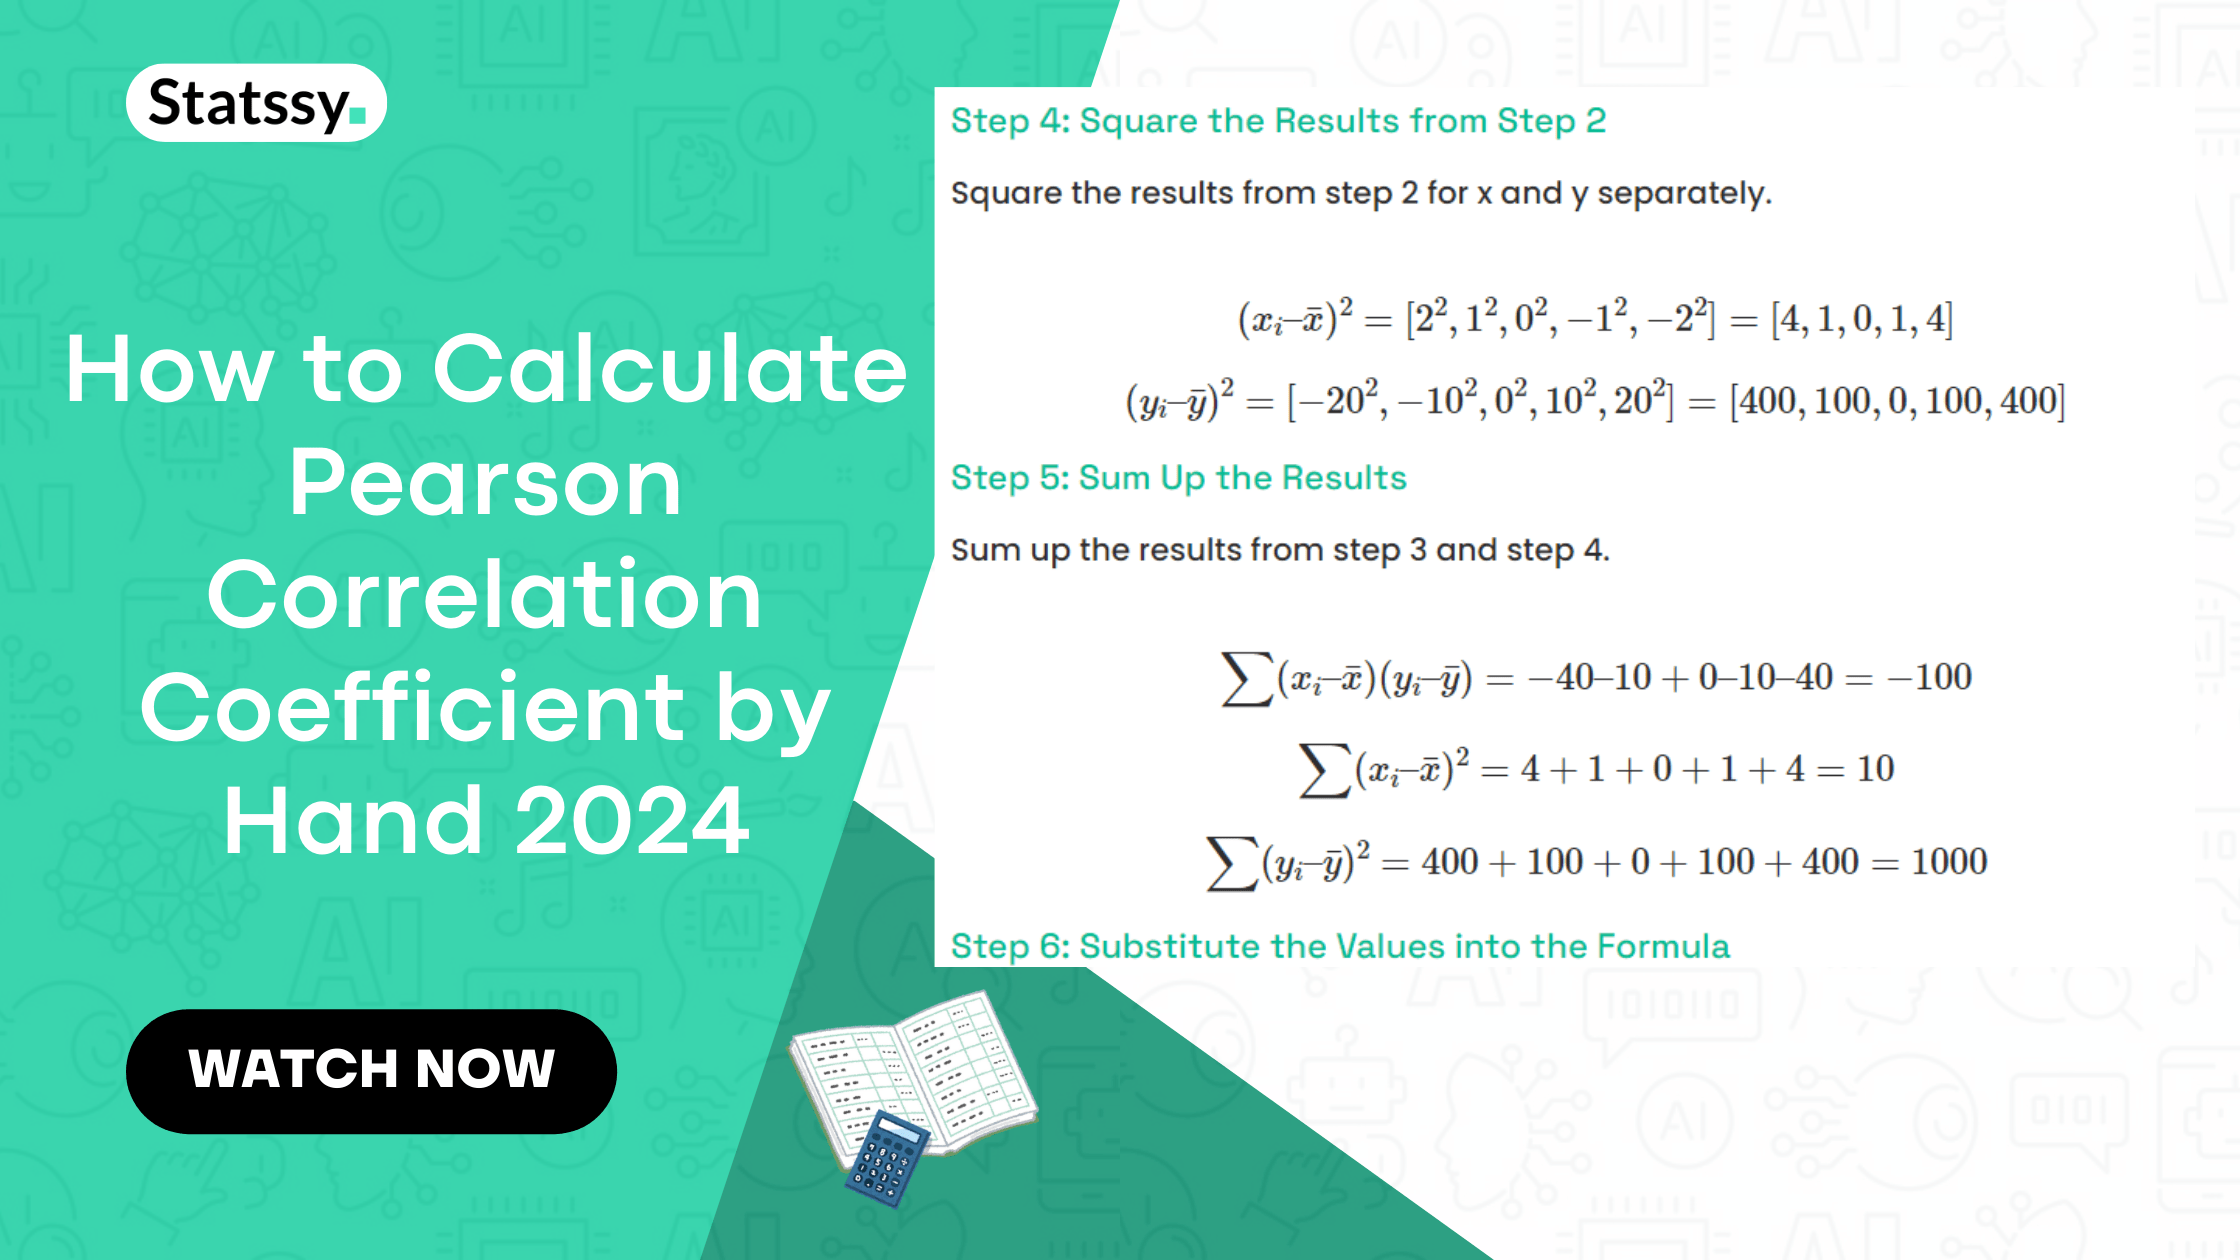
Step 4: Square the Results from Step 2
Square the results from step 2 for x and y separately.
\[ (x_i – \bar{x})^2 = [2^2, 1^2, 0^2, -1^2, -2^2] = [4, 1, 0, 1, 4] \] \[ (y_i – \bar{y})^2 = [-20^2, -10^2, 0^2, 10^2, 20^2] = [400, 100, 0, 100, 400] \]Step 5: Sum Up the Results
Sum up the results from step 3 and step 4.
\[ \sum (x_i – \bar{x})(y_i – \bar{y}) = -40 – 10 + 0 – 10 – 40 = -100 \] \[ \sum (x_i – \bar{x})^2 = 4 + 1 + 0 + 1 + 4 = 10 \] \[ \sum (y_i – \bar{y})^2 = 400 + 100 + 0 + 100 + 400 = 1000 \]Step 6: Substitute the Values into the Formula
Finally, substitute the values obtained from the above steps into the formula:
\[ r = \frac{-100}{\sqrt{10 * 1000}} \] \[ r = -1 \]After calculating, we find that (r = -1). This indicates a perfect negative correlation between the hours spent on social media and the test scores. In other words, as the number of hours spent on social media increases, the test scores decrease.
Conclusion
The Pearson Correlation Coefficient is a powerful statistical tool that allows us to quantify the relationship between two variables. Understanding how to calculate it manually not only deepens our understanding of the concept, but also helps us appreciate the computations that software packages perform behind the scenes when we use them for statistical analysis.
Remember, correlation does not imply causation. While the Pearson Correlation Coefficient can tell us the strength and direction of a relationship between two variables, it does not tell us if one variable causes the other to change.


