Note: This article is intended for intermediate and advanced-level data professionals. If you are beginner, I encourage to read the entire article but not to worry if you are not able to understand everything.
Exploring how different features influence regression models in an easy and engaging way.
Ever wondered why a machine-learning model makes a certain prediction? It’s not just about getting the answer; it’s about understanding the “how” and “why” behind it. That’s where “feature contribution” comes into play. It’s like the backstage pass to your model, showing you how each variable influences the final prediction.
In this blog post, we’re going to explore feature contribution in the context of regression, using none other than the Random Forest algorithm. Whether you’re just starting out or you’re a seasoned pro, Random Forest is a go-to method in data science that you’ll want to know about.
Table of Contents
- Grasping the Basics: Machine Learning and Regression Analysis
- The Power of Features
- Meet the Random Forest Algorithm
- Understanding the Role of Features in Random Forest
- Interpreting Feature Contribution in Random Forest
- Case Study: Predicting House Prices
- Final Thoughts
Need help with Machine Learning?
Connect on Whatsapp
Grasping the Basics: Machine Learning and Regression Analysis
Before we dive into the nitty-gritty of feature contribution in Random Forests, let’s get comfy with two big terms: Machine Learning (ML) and Regression Analysis. Trust me, they’re easier to understand than they sound!

What is Machine Learning (ML)
Machine Learning is like teaching your computer to fish Instead of telling it exactly what to do, you feed it data and let it figure things out on its own. For example, you can train a machine learning model to recognize cats by showing it lots of cat pictures.
Here’s a simple Python code snippet using sci-kit-learn to train a model:
from sklearn.datasets import load_iris
from sklearn.model_selection import train_test_split
from sklearn.ensemble import RandomForestClassifier

# Load iris dataset
iris = load_iris()
X, y = iris.data, iris.target

# Split data into training and test sets
X_train, X_test, y_train, y_test = train_test_split(X, y, test_size=0.2)

# Create a Random Forest Classifier
clf = RandomForestClassifier(n_estimators=50)

# Train the classifier
clf.fit(X_train, y_train)

# Make predictions
y_pred = clf.predict(X_test)
What is Regression Analysis
Regression Analysis is all about relationships. It’s like being a detective, figuring out how different variables (features) affect an outcome. For example, how do square footage, location, and the number of bedrooms affect house prices?
In Python, you can perform a simple linear regression like this:
from sklearn.linear_model import LinearRegression

# Sample data: Square footage of houses
X = [[1500], [2000], [2500], [3000]]
# Corresponding house prices
y = [300000, 400000, 450000, 600000]

# Create a Linear Regression model
model = LinearRegression()

# Fit the model
model.fit(X, y)

# Predict the price of a 2700 sqft house
predicted_price = model.predict([[2700]])
Now that you’ve got the basics down, let’s move on to how these concepts come together in Random Forests!
The Power of Features – Feature Importance in Machine Learning
Hold up! Before we get into the complexities of regression and the Random Forest Model, let’s give a big shoutout to the unsung heroes of any ML model—the features.
What are the Features?
Features are like the ingredients in a recipe. They’re the variables from our dataset that we mix and match to whip up some delicious predictions. For instance, if you’re trying to predict house prices, your features could be:
- Number of Bedrooms: More bedrooms usually mean a higher price.
- Size of the Living Room: A spacious living room can be a selling point.
- Proximity to the City Center: Closer to the action often equals a higher price tag.
Why are Features Important in Machine Learning?
Each feature contributes to the model’s final prediction, but not all features are created equal. Some might have a big impact, while others might not matter much. This is what we call Feature Importance. It’s like knowing which spices really make your dish pop!
Here’s a Python code snippet to find feature importance using Random Forest:
from sklearn.datasets import load_boston
from sklearn.ensemble import RandomForestRegressor
import numpy as np

# Load Boston housing dataset
boston = load_boston()
X, y = boston.data, boston.target

# Create a Random Forest Regressor
rf = RandomForestRegressor(n_estimators=100)

# Fit the model
rf.fit(X, y)

# Get feature importances
importances = rf.feature_importances_

# Print feature importances
for feature, importance in zip(boston.feature_names, importances):
    print(f"{feature}: {importance}")
By understanding the importance of each feature, you can focus on what really matters and even simplify your model.
Meet the Random Forest Algorithm
Welcome to the jungle…of Machine Learning algorithms! Among the towering giants, the Random Forest algorithm stands out as a true ensemble superstar.
What is the Random Forest Model?
Random Forest is like the Avengers of ML algorithms. It assembles a team of decision trees—each one a mini-expert on some aspect of the data—and combines their wisdom for a more accurate and stable prediction. Breaking Down Complex Predictions: A Beginner’s Dive into Random Forests
Why do we call it a Random Forest?
Picture each decision tree as a detective, each specializing in solving a specific type of crime. One might be an expert in understanding how a house’s size affects its price, while another might be a guru in location factors. When you bring all these detectives together, you get a ‘Random Forest’—a dream team that gives you a 360-degree view of the case.
Here’s a Python code snippet to create a Random Forest model:
from sklearn.ensemble import RandomForestRegressor

# Sample data: Square footage, number of bedrooms, and distance to city center
X = [[1500, 3, 5], [2000, 4, 3], [2500, 4, 2], [3000, 5, 1]]
# Corresponding house prices
y = [300000, 400000, 450000, 600000]

# Create a Random Forest Regressor
rf_model = RandomForestRegressor(n_estimators=100)

# Fit the model
rf_model.fit(X, y)

# Make a prediction
predicted_price = rf_model.predict([[2700, 4, 2]])
What’s Next?
Stick around as we delve into how features come alive in a Random Forest. We’ll also explore how to interpret their contribution and apply these insights in real-world scenarios.
What is the Role of Features in Random Forest
Alright, now that we’ve met the Random Forest algorithm, let’s dig deeper into how features strut their stuff on this stage.
How Do Features Work in Random Forest Model?
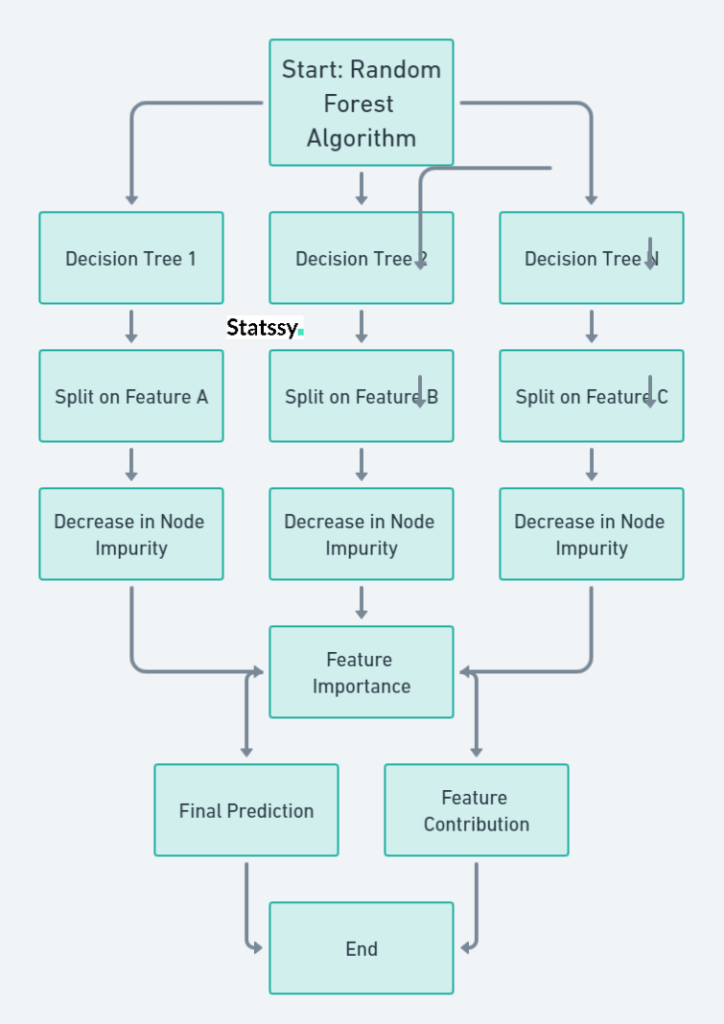
Imagine each decision tree in the forest as a different route on a treasure map . Each tree uses different features to split the data at each node, creating a maze of potential paths to the treasure (or in our case, the prediction).
Here’s a Python code snippet to visualize feature importance in a Random Forest model:
<span class="hljs-keyword">import</span> matplotlib.pyplot <span class="hljs-keyword">as</span> plt

# Using the previously created Random Forest model <span class="hljs-string">'rf_model'</span>
feature_importances = rf_model.feature_importances_

# Features used <span class="hljs-keyword">in</span> the model
features = [<span class="hljs-string">'Square Footage'</span>, <span class="hljs-string">'Number of Bedrooms'</span>, <span class="hljs-string">'Distance to City Center'</span>]

# Plotting feature importances
plt.barh(features, feature_importances)
plt.xlabel(<span class="hljs-string">'Importance'</span>)
plt.ylabel(<span class="hljs-string">'Features'</span>)
plt.title(<span class="hljs-string">'Feature Importance in Random Forest'</span>)
plt.show()
Measuring Feature Importance
In Random Forest, the importance of a feature is usually gauged by how much it decreases the impurity in the nodes. Features that often appear high in the trees and significantly reduce impurity are considered MVPs (Most Valuable Players).
Beyond Classic Measures
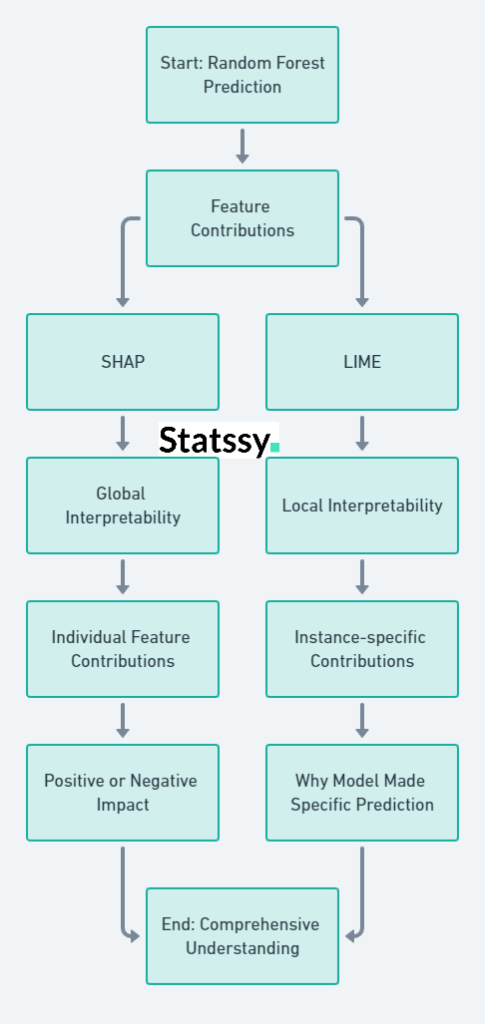
But wait, there’s more! The classic measure of Feature Importance has its limits. It tells you which features are generally important but doesn’t show how each feature contributes to individual predictions. That’s where Feature Contribution steps in to give us a more nuanced view.

Interpreting Feature Contribution in Random Forest Model
So, you’ve got your prediction from the Random Forest model. Awesome! But wait, do you know why the model made that prediction? That’s where feature contributions come into play.
SHAP: The All-Rounder
SHAP (SHapley Additive exPlanations) is like the Swiss Army knife of feature interpretation. It gives you a detailed breakdown of how each feature contributes to individual predictions.
Here’s a Python code snippet to calculate SHAP values:
import shap

# Using the previously created Random Forest model 'rf_model'
explainer = shap.TreeExplainer(rf_model)
shap_values = explainer.shap_values(X)

# Plotting SHAP values for a single prediction
shap.initjs()
shap.force_plot(explainer.expected_value[0], shap_values[0], X[0])
LIME: The Local Expert
LIME (Locally Interpretable Model-agnostic ExPlanations) is your go-to for local interpretability. It helps you understand why the model made a specific prediction in a particular instance.
Here’s how you can use LIME:
from lime.lime_tabular import LimeTabularExplainer

# Create a LIME explainer
explainer = LimeTabularExplainer(X, training_labels=y, feature_names=features, mode='regression')

# Explain a single instance
explanation = explainer.explain_instance(X[0], rf_model.predict)
Putting It All Together
Using SHAP and LIME, you can get a comprehensive understanding of how much each feature contributes to the outcome—whether it’s pushing the prediction up or pulling it down
So, the next time your model makes a prediction, you’ll know exactly why it made that call.

Case Study: Predicting House Prices
Alright, folks, it’s showtime! To bring all these high-flying concepts down to Earth, let’s dive into a real-world example—predicting house prices.
The Dataset
Imagine we’ve got a dataset chock-full of features like:
- Number of Rooms: Because who doesn’t love a good walk-in closet?
- Size of the House: Square footage matters!
- Age of the House: Old or modern, each has its charm.
- Location: Are you a downtown diva or a countryside connoisseur?
The Game Plan
- Data Pre-processing: First things first, we’ll clean and prep our data for the big show.
- Random Forest Regression: Next, we’ll use our trusty Random Forest model to make some price predictions.
- Feature Interpretation: Finally, we’ll use SHAP and LIME to dissect the model’s predictions.
The Real Question: Why?
But hey, we’re not just after the “right” prediction. We’re on a quest to understand the why behind each prediction.
- Why did the model think the size of the house was the star of the show?
- Or why did it give more weight to location over the age of the house?
Answering these questions will not only make us Random Forest aficionados but also data-savvy individuals.
What’s Next?
Stick around for the grand finale where we tie up all the loose ends and see how this all fits into the big, beautiful world of data science.
So, if we roll with this game plan, we’re not just gonna get some cool predictions about house prices. Nope, we’re going full-on Sherlock Holmes here! We’ll know exactly why our model thinks a swanky downtown loft costs more than a cosy suburban home. With tools like SHAP and LIME in our toolkit, we’ll get the inside scoop on what’s really driving those price tags up or down.
It’s like having X-ray vision but for data! And hey, this isn’t just about being data whizzes for a day; this knowledge is pure gold for any future projects or big decisions we’ve gotta make. So, we’re not just predicting; we’re understanding, and that’s a game-changer!
Advantages and Disadvantages
| Aspect | Advantages | Disadvantages |
|---|---|---|
| Prediction Accuracy | High accuracy thanks to the ensemble nature of Random Forest. | Overfitting can be an issue if not properly tuned. |
| Feature Interpretability | SHAP and LIME give us a deep dive into feature contributions. | These methods can be computationally expensive. |
| Model Complexity | Can handle a wide range of data types and relationships between features. | Complexity makes it harder to explain to non-experts. |
| Real-world Application | Insights can be directly applied to other projects or decision-making. | Requires a well-prepared dataset, which can be time-consuming to assemble. |
| Trustworthiness | Transparency in predictions builds trust in the model. | Interpretation methods are not 100% foolproof and should be used carefully. |
Final Thoughts: Keep Asking ‘Why’
Alright, folks, we’ve come to the end of our deep-dive, and what a ride it’s been! Understanding feature contribution in Random Forests isn’t just some geeky skill—it’s like having a magic key that unlocks the secrets behind those mysterious predictions.
The Best of Both Worlds
You see, we’re not just chasing after accurate predictions; we’re also after the why behind them. It’s like having your cake and eating it too! We’re breaking down that age-old trade-off between being accurate and being understandable.
Your Data Science Toolkit
As you gear up for your own data science adventures, don’t forget: knowing why is just as crucial as knowing what. With nifty tools like SHAP and LIME, you’re not just making predictions; you’re making sense of them.
A Shoutout to Statssy.com
Here at Statssy.com, we’re all about giving you the know-how and the tools to be a data wizard. Our courses go beyond the basics, diving into real-world datasets and some pretty mind-blowing advanced stuff.
Keep the Curiosity Alive
So, whether you’re a data science newbie or a pro looking to level up, remember: the journey is all about asking the right questions. Each question is like a breadcrumb on the trail to becoming a data genius. So keep asking, keep exploring, and most importantly, stay curious!
Feeling pumped about diving deeper into the world of data science and business analytics? Trust us, you’re just scratching the surface! If you’re serious about levelling up your skills and making a big splash in your career, you’ve got to check out our data science courses on Statssy.com.
From mastering the basics to tackling advanced topics, we’ve got courses that’ll turn you into a data science superstar. Don’t just take our word for it—head over to our courses page and see for yourself how we can empower you to become a leader in data science and business analytics.


