
Case Study in Marketing Analytics in Digital Marketing
Hey there, fam! Welcome to our super chill case study on marketing analytics. If you’re just starting out and wondering what the hype is all about, you’re in the right spot.
Meet Rahul, our data analyst hero at a cool e-commerce company. He’s gonna be our guide through this awesome world of marketing analytics. We’ll tag along with him to see how he uses data to figure out what makes people hit that “Buy Now” button.
We’ll even decode some buzzwords like “regression analysis” and make them super easy to get. So, whether you’re thinking about sliding into a career in this field, or you’re just super curious, stick around. Let’s get this bread!
Need help with Marketing Analytics?
Connect on Whatsapp
Scenario
So, let’s spill the tea. Rahul works as a data analyst at this rad e-commerce site called GoBankrupt.com. Don’t let the name fool you; they’re all about selling top-notch curtains.
The competition is fierce out there, y’all. To keep up, GoBankrupt.com needs to know what’s making their customers click that “Add to Cart” button. Rahul’s boss is like, “Hey, we gotta know what’s driving our sales, ASAP!”
So, Rahul’s got a mission: Figure out what’s making people go from window shopping to actual shopping.
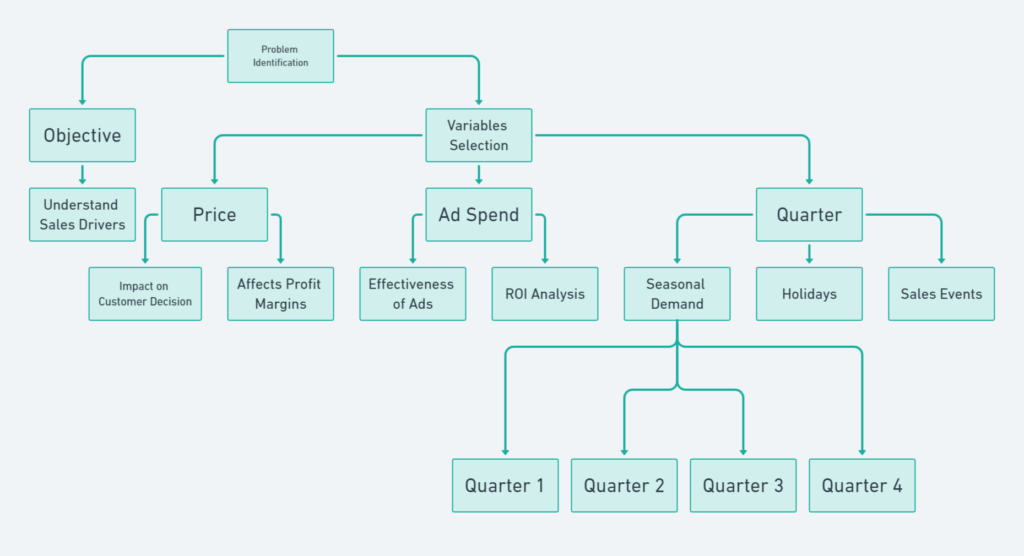
Problem Identification: Rahul’s Game Plan
Alright, so Rahul’s got his thinking cap on. First up, he’s gotta pick the right factors that could be game-changers for sales. He’s looking for stuff that’s not just relevant but also easy to track and analyze.
First thing that pops into his mind? The ‘Price’ tag, duh! Rahul knows that price is like the OG influencer when it comes to buying stuff. Too high and peeps might ghost the product; too low and, well, bye-bye profits. So, ‘Price’ is in the game.
Next up, ‘Ad Spend.’ GoBankrupt.com is dropping some serious cash on ads to get you to notice them. Rahul’s wondering if all that ad money is actually turning into sales. So, ‘Ad Spend’ makes it to his list.
Last but not least, Rahul’s thinking about the time of the year. You know how some stuff just sells like hotcakes during the holidays or specific seasons? Yeah, Rahul’s onto that. He’s adding ‘Quarter’ to his list, breaking it down into Q1, Q2, Q3, and Q4.
So, there you have it! Rahul’s got his variables: ‘Price,’ ‘Ad Spend,’ and ‘Quarter.’ He’s pretty sure these are gonna give him the 411 on what’s driving sales for GoBankrupt.com.
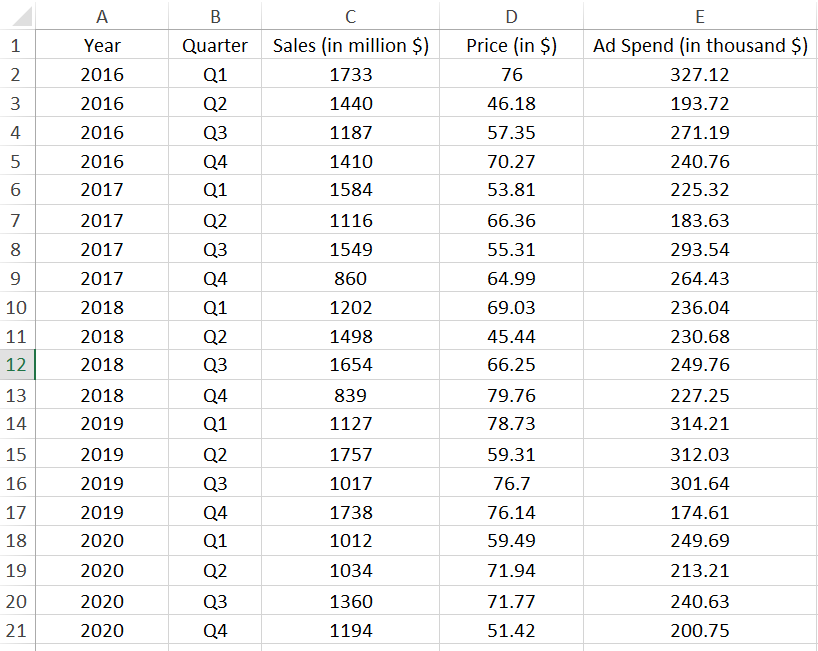
Data Collection: Rahul’s Treasure Hunt
Okay, so Rahul’s got his game plan, but now he needs the deets—the data! Let’s see how he gathers all the info he needs.
Price Data
First up, Rahul dives into the company’s Product Management System (PMS). Think of it as the ultimate cheat sheet for everything product-related, including prices. He hits export and boom! He’s got a year’s worth of pricing data.
Ad Spend Data
Next, he switches gears to ‘Ad Spend.’ The company uses this Digital Marketing Platform (DMP) that’s like the control center for all their ad campaigns. Rahul pulls up the reports, does some quick math, and now he knows how much they’ve been spending on ads for each product.
Quarter Data
Last but not least, Rahul needs to know when these sales are happening. Easy peasy! The company’s Sales Management System (SMS) has got all that info, right down to the date of each sale. He exports this data and figures out which quarter each sale falls into.
The Final Touch
Once he’s got all this data, Rahul’s not just gonna leave it messy. Nah, he cleans it up, checks for any missing pieces or weird numbers that could mess up his analysis.
And voila! Rahul’s got his cleaned-up dataset and is ready to do some serious number-crunching to find out what’s really making GoBankrupt.com’s cash register ring.
The dataset:Marketing Analytics
Want to learn Marketing Analytics?
Connect on Whatsapp
How Rahul Picks His Tools: The Power of Regression Analysis
So, how does Rahul figure out which technique to use to find out what’s really driving those sales? Imagine you’re trying to figure out what makes a TikTok go viral. You’d look at stuff like the music, the timing, the hashtags, right? Now, how do you know which of these things actually makes a difference?
Enter regression analysis! It’s like the ultimate hack for measuring how different things impact something you care about. In Rahul’s world, he’s all about those sales numbers. He wants to know how the price, ad spend, and even the season impact those sales.
Predicting Sales
The coolest part? Regression analysis isn’t just about understanding the past; it’s about predicting the future. Like, if you know that certain hashtags make a TikTok viral, you’d use them in your next video, right? Similarly, Rahul can use this tool to predict how future sales might look based on the price, ad spend, and the time of year.
Why Price and Ad Spend, Though?
So you might be wondering, why did Rahul pick price and ad spend? Well, think about the last time you bought something online. The price mattered, didn’t it? And you probably clicked ‘Buy’ because you saw some ads that hyped it up. These are things Rahul can actually plan for, so it’s a no-brainer for him to focus on them.
Time to Crunch Those Numbers
Guess what? Rahul’s about to get down to business. He’s using Microsoft Excel to crunch those numbers and find out what’s really making GoBankrupt.com’s sales pop.
Analysis: Rahul’s Deep Dive into Sales
Okay, so analysis time! First things first, Rahul needs to figure out what he’s actually trying to understand. In fancy terms, this is called the ‘dependent variable.’ Why? Because it ‘depends’ on other stuff. For Rahul, that’s ‘Sales.’ He wants to know what makes those numbers go up or down.
The Independent Squad
Next up, Rahul’s gotta pick his ‘independent variables.’ These are the things he thinks might make those sales numbers move.
He goes for ‘Price’ and ‘Ad Spend.’ Why? Well, ‘Price’ is like the VIP of shopping decisions. And ‘Ad Spend’? That’s all about making the product pop on your feed.
The Equation of Sales: Breaking It Down
Alright, so Rahul’s got this equation he’s gonna use to figure out how ‘Sales’ are influenced by ‘Price’ and ‘Ad Spend.’ Let’s break it down:
The Equation
The equation Rahul is using looks something like this:
Sales = a + b1 x Price + b2 x Ad Spend
Here’s what each part means:
- Sales: This is what Rahul is trying to predict or understand better. It’s known as the dependent variable because it ‘depends’ on other factors.
- a: This is the constant. It’s like the base level of sales that would happen even if Price and Ad Spend were zero.
- b1 and b2: These are the coefficients. They tell us how much Sales will change when Price or Ad Spend change by one unit.
- Price and Ad Spend: These are the independent variables. They’re what Rahul thinks might be influencing Sales.
What Does It All Mean?
So, in simple terms, Rahul is trying to find out how much ‘Price’ and ‘Ad Spend’ are affecting ‘Sales.’ If ( b_1 ) is a big number, that means changes in ‘Price’ have a big impact on ‘Sales.’ The same goes for ( b_2 ) and ‘Ad Spend.’
Why Regression Analysis?
Rahul uses regression analysis because it’s like a magic wand for understanding relationships between variables. It helps him measure the impact of ‘Price’ and ‘Ad Spend’ on ‘Sales,’ and even predict future sales based on these variables.
Crunch Time in Excel
Rahul’s got his game face on. He fires up MS Excel, goes to Data -> Data Analysis -> Regression. A whole new tab pops up, and that’s where he’ll plug in his dependent and independent variables.
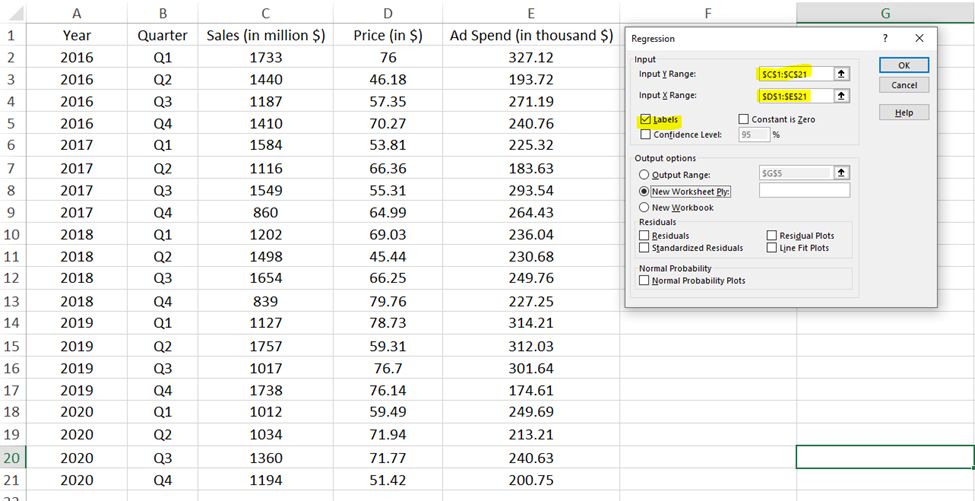
Once Rahul clicks “OK” after entering the data, he will get the following results from the regression analysis.
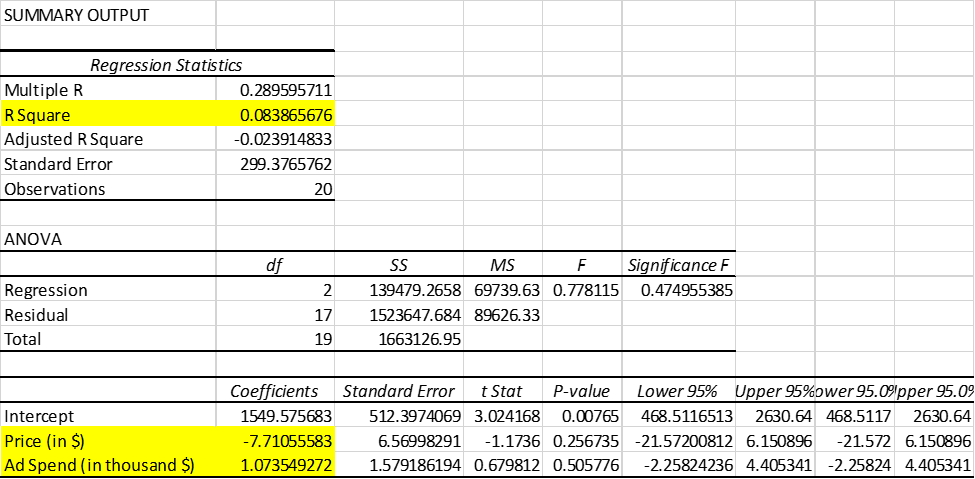
For simplicity we will rely on only three things here, R-square, Price (in $), Ad Spend (in thousand $)
Case Study in Marketing Analytics in Digital Marketing
Understanding the Results: The Scoreboard
R-Squared: The Report Card
First up, let’s talk about the R-squared value. Think of it like a grade on a test, but instead of A’s and F’s, it’s a score out of 1. A score of 1 would be like acing the test—it means our factors (price and ad spend) predict sales perfectly. A score of 0 is like, “Oops, better study next time.”
In Rahul’s case, the R-squared value is 0.0839, or about 8.39%. So, what’s that mean? It means only about 8.39% of changes in sales can be predicted by changes in price and ad spend. So yeah, they matter, but there’s more to the story.
Price: The Cost of Doing Business
The number for ‘Price’ is -7.71. This is the coefficient, and it’s like the exchange rate between price and sales. In this case, a coefficient of -7.71 means that for every extra $1 you slap on the price tag, you can expect sales to dip by about $7.71 million. Makes sense, right? More expensive curtains = fewer buyers.
Ad Spend: The Hype Machine
The number for ‘Ad Spend’ is 1.07. This coefficient tells us that for every extra $1000 spent on ads, you can expect sales to jump by about $1.07 million. So, the more you spend on ads, the more curtains you’re gonna sell. It’s like investing in your own hype!
| Metrics | Statistical Interpretation | Value for Business |
|---|---|---|
| R-Squared | 0.0839 or 8.39% | Only about 8.39% of sales changes can be predicted by price and ad spend. Indicates other factors are at play. |
| Price | Coefficient: -7.71 | For every $1 increase in price, expect sales to decrease by about $7.71 million. Higher prices could lead to fewer sales. |
| Ad Spend | Coefficient: 1.07 | For every $1000 increase in ad spend, expect sales to increase by about $1.07 million. More ad spend likely boosts sales. |
Conclusion: The Journey Continues
So, what did Rahul’s initial deep dive reveal? Well, it gave us some cool insights, but also left us with more questions than answers. The regression model showed that price and ad spend do affect sales, but they’re just the tip of the iceberg, explaining only about 8.39% of sales changes.
The Good, The Bad, and The Unknown
The negative vibe between price and sales? Totally makes sense. Raise the price, and peeps are gonna think twice before hitting ‘Buy.’ On the flip side, spending more on ads seems to be a win, boosting sales. But given that low R-squared score, Rahul’s got more detective work to do.
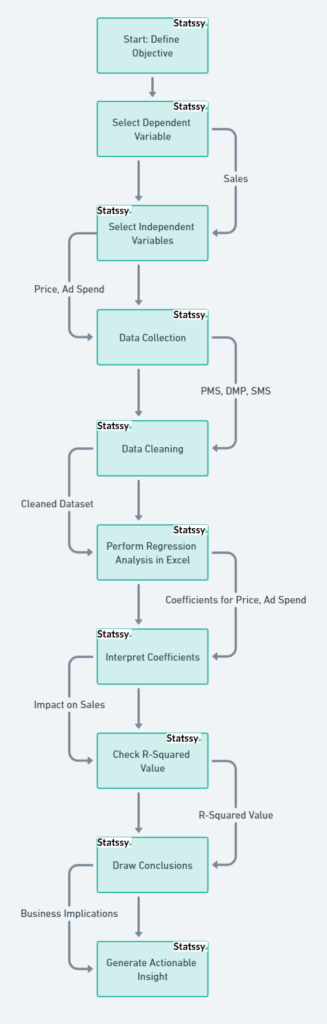
Here is an entire workflow that you can use as a reference
What’s Next?
Rahul could dig into other factors like curtain design, the economy, or even specific marketing campaigns. The goal? To get a fuller picture of what’s driving those sales numbers.
Level Up Your Skills
If this case study got you pumped about marketing analytics, you’re in luck! We’ve got a killer course that can turn you into a Rahul-level pro. And hey, the average salary for a Marketing Analyst in the U.S. is over $60k, with top earners raking in six figures!
Our course covers not just regression analysis but a whole toolbox of statistical techniques. Whether you’re a newbie or looking to level up, we’ve got you covered.Case Study in Marketing Analytics in Digital Marketing
Ready to become a data wizard and make some serious career moves? Join us today at Statsy.com and take your first step towards a successful career in Marketing Analytics!